. 2019 Oct 23;39(43):8439-8456.
doi: 10.1523/JNEUROSCI.0728-19.2019. Epub 2019 Sep 13.

Regulation of Hippocampal Memory by mTORC1 in Somatostatin Interneurons

Affiliations

Regulation of Hippocampal Memory by mTORC1 in Somatostatin Interneurons

Julien Artinian et al. J Neurosci. .

Abstract

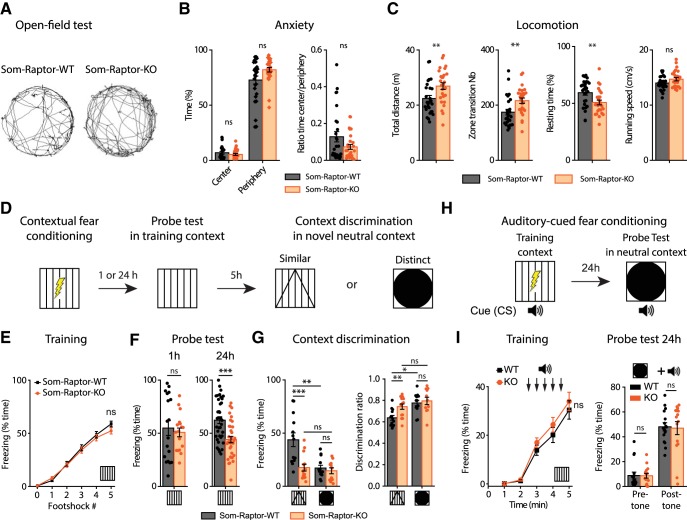
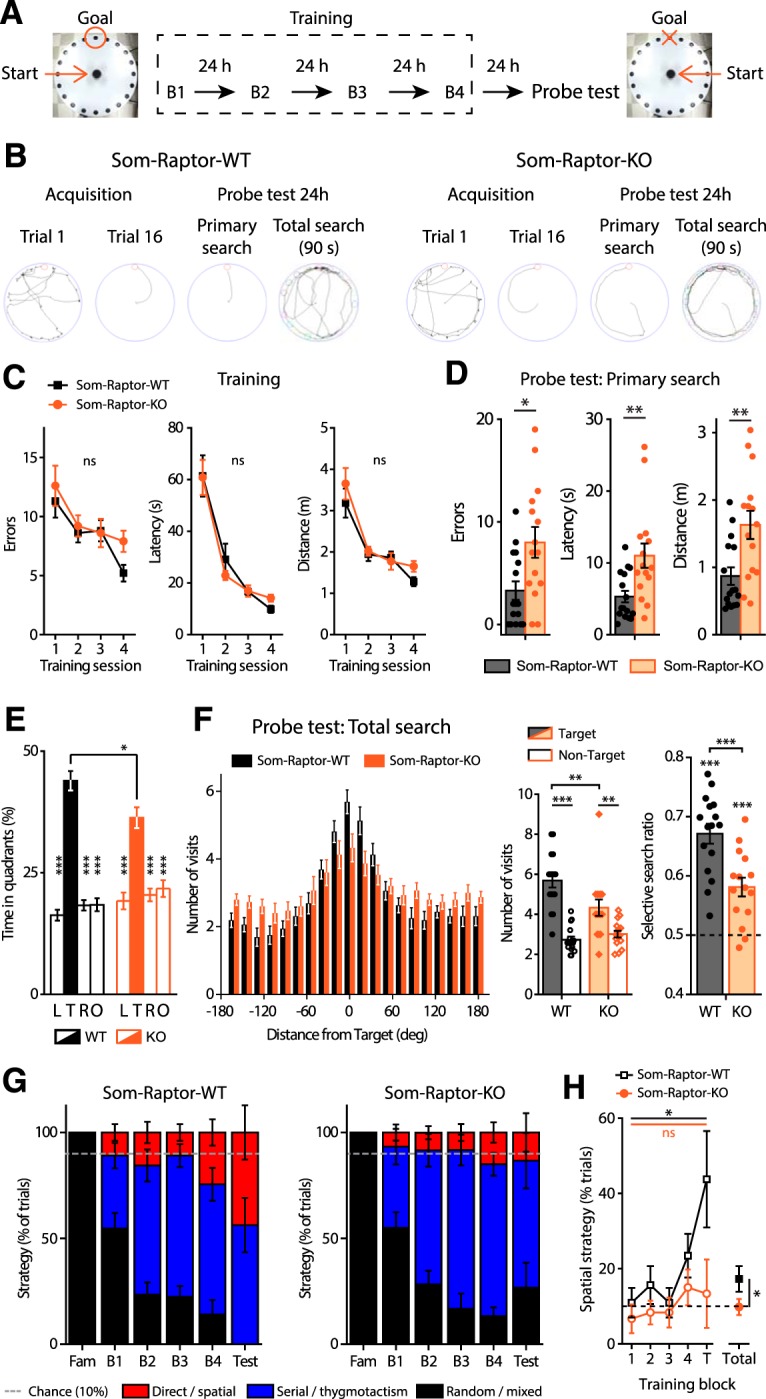
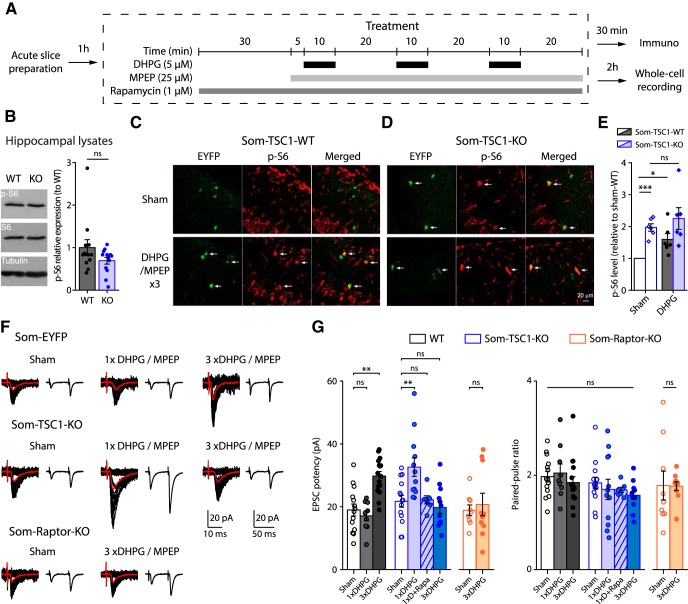
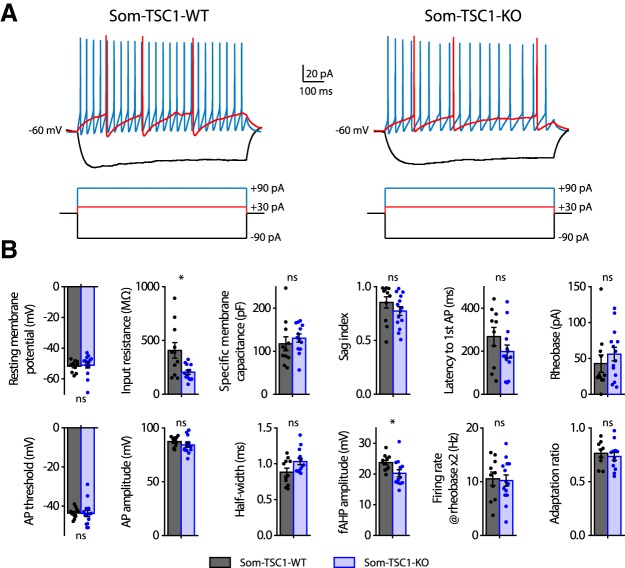
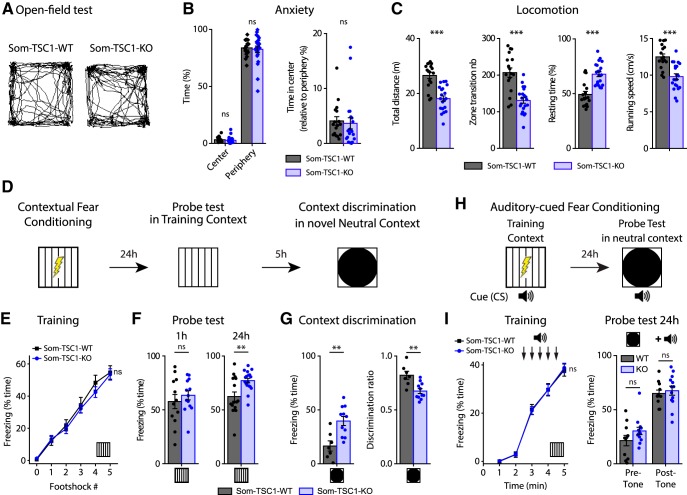
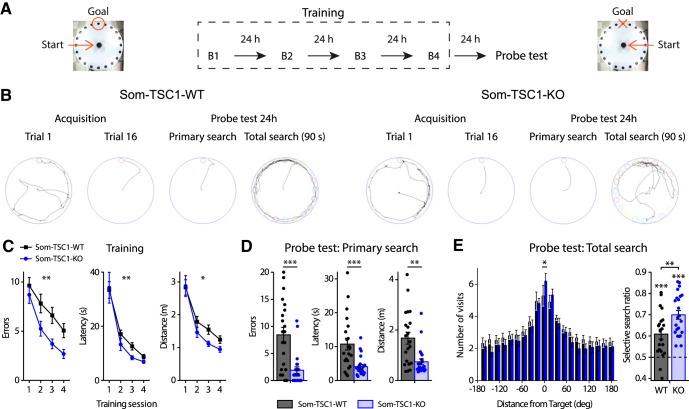
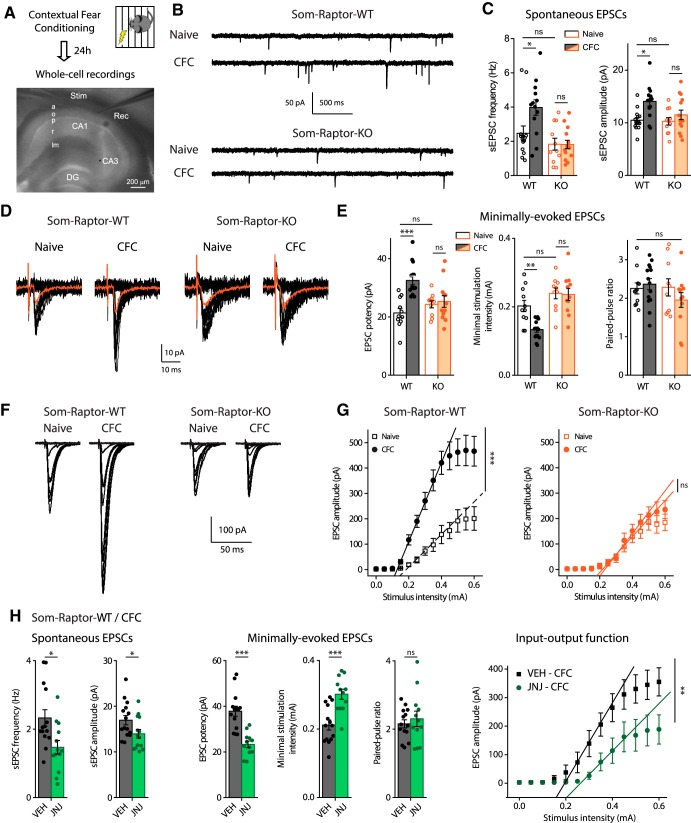
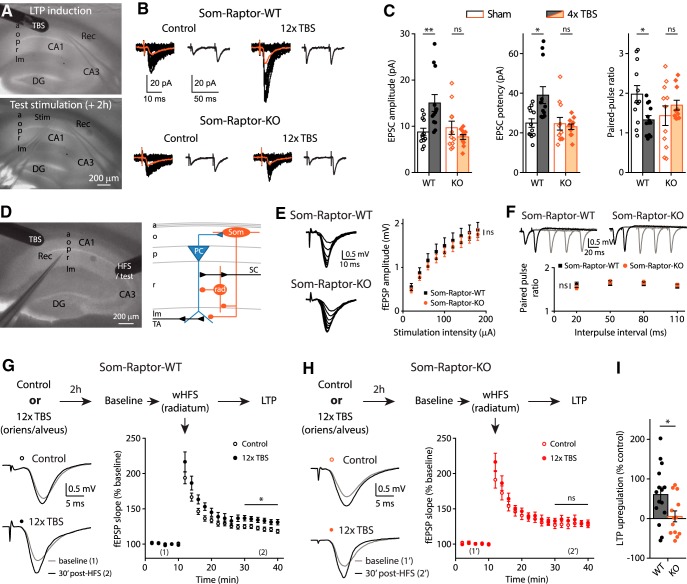
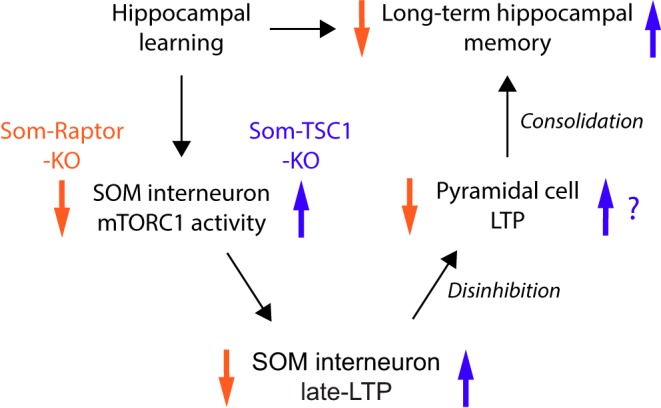
Translational control of long-term synaptic plasticity via Mechanistic Target Of Rapamycin Complex 1 (mTORC1) is crucial for hippocampal learning and memory. The role of mTORC1 is well characterized in excitatory principal cells but remains largely unaddressed in inhibitory interneurons. Here, we used cell-type-specific conditional knock-out strategies to alter mTORC1 function selectively in somatostatin (SOM) inhibitory interneurons (SOM-INs). We found that, in male mice, upregulation and downregulation of SOM-IN mTORC1 activity bidirectionally regulates contextual fear and spatial memory consolidation. Moreover, contextual fear learning induced a metabotropic glutamate receptor type 1 (mGluR1)-mediated late long-term potentiation (LTP) of excitatory input synapses onto hippocampal SOM-INs that was dependent on mTORC1. Finally, the induction protocol for mTORC1-mediated late-LTP in SOM-INs regulated Schaffer collateral pathway LTP in pyramidal neurons. Therefore, mTORC1 activity in somatostatin interneurons contributes to learning-induced persistent plasticity of their excitatory synaptic inputs and hippocampal memory consolidation, uncovering a role of mTORC1 in inhibitory circuits for memory.SIGNIFICANCE STATEMENT Memory consolidation necessitates synthesis of new proteins. Mechanistic Target Of Rapamycin Complex 1 (mTORC1) signaling is crucial for translational control involved in long-term memory and in late long-term potentiation (LTP). This is well described in principal glutamatergic pyramidal cells but poorly understood in GABAergic inhibitory interneurons. Here, we show that mTORC1 activity in somatostatin interneurons, a major subclass of GABAergic cells, is important to modulate long-term memory strength and precision. Furthermore, mTORC1 was necessary for learning-induced persistent LTP at excitatory inputs of somatostatin interneurons that depends on type I metabotropic glutamatergic receptors in the hippocampus. This effect was consistent with a newly described role of these interneurons in the modulation of LTP at Schaffer collateral synapses onto pyramidal cells.

Keywords: hippocampus; mTORC1; memory consolidation; metaplasticity; somatostatin interneurons; synaptic plasticity.


Figures

Figure 1.
Figure 1.
Chemically induced persistent LTP at excitatory synapses onto CA1 SOM-INs depends on mGluR1a and mTOR. A, Representative images of EYFP expression (left) and SOM immunofluorescence (middle) in hippocampal CA1 area from Sstires-Cre; Rosa26lsl-EYFP mice, showing 84.4 ± 2.6% of EYFP+ cells colabeled for somatostatin (right) in stratum oriens. B, Diagram of chemical late LTP induction and recording protocol in organotypic slice cultures. C–F, Representative EPSCs evoked by minimal stimulation in EYFP expressing SOM-INs at 24 h after induction in different conditions: sham treatment (C), and repeated mGluR1 stimulation alone (D), in the presence of the mGluR1a antagonist LY367385 (E) or mTOR inhibitor PP242 (F). From left to right: EPSCs including failures (individual traces in gray, average trace in black), averaged EPSC potency (excluding failures), average of EPSCs evoked by paired-pulse stimulation, and superimposed first and second EPSCs of average pair. G, EPSC potency (EPSC amplitude excluding failures) and paired-pulse ratio after sham and MPEP/DHPG alone, in the presence of LY367385 or PP242. **p < 0.01; ***p < 0.001
Figure 2.
Figure 2.
Cell-specific deficit in Raptor expression impairs mTORC1 signaling and late-LTP in SOM-INs of Som-Raptor-KO mice. A, Left, Representative images of Raptor immunopositive (red) EYFP+ (green) CA1 SOM-INs (arrows, colabeling) in Som-Raptor-KO relative to Som-Raptor-WT mice. Right, Percentage of Raptor+ cells relative to EYFP+ cells. B, Left, Representative Western blots of Raptor and phospho-S6S235/236 from hippocampal lysates. Right, Raptor (normalized to tubulin) and p-S6 (normalized to S6 and tubulin) levels (relative to Som-Raptor-WT mice). C, Same as in (B) but in hippocampal cultured slices. D, E, Representative confocal images illustrating EYFP+ CA1 SOM-INs (green), S6S235/236 phosphorylation (red) and colabeling (merged) in Som-Raptor-WT (D) and Som-Raptor-KO (E) mice, after sham, DHPG/MPEP and DHPG/MPEP in the presence of 1 μm rapamycin treatments. Arrows point to EYFP+ SOM-INs with p-S6 colabeling. F, Phosphorylated S6S235/236 level relative to sham treatment in Som-Raptor-WT mice. G, Diagram of chemical late-LTP experimental protocol in cultured slices. H, Representative EPSCs evoked by minimal stimulation in SOM-INs. Traces are superimposed 20 consecutive events (EPSCs + failures, black), average EPSC (including failures, red) and average of EPSC pairs (20 events) evoked by paired-pulse stimulation. I, EPSC amplitude (including failures), EPSC potency (excluding failures) and paired-pulse ratio of SOM-INs 24 h after DHPG/MPEP relative to sham treatment in Som-Raptor-WT, Som-Raptor-HET, and Som-Raptor-KO mice. *p < 0.05; **p < 0.01; ***p < 0.001; ns, not significant.
Figure 3.
Figure 3.
Intact SOM interneuron numbers and morphology in Som-Raptor-KO mice. A, Montage of representative fluorescence images of EYFP expression in Som-Raptor-WT (left) and Som-Raptor-KO (right) mice. B, EYFP-expressing cell density in CA1 of Som-Raptor-WT and Som-Raptor-KO mice. C, D, Montage of representative confocal images, maximum intensity z-projection (100 stacked images, 1 μm steps) of hippocampal CA1 SOM-IN filled with biocytin (left) and reconstructions (soma and dendrite in black, axon in red; right) from Som-Raptor-WT (C) and Som-Raptor-KO (D) mice. As illustrated, the vast majority (90%) of EYFP-expressing SOM-INs recorded in whole-cell and filled with biocytin in the present study corresponded to the O-LM type of SOM-INs (the remaining 10% corresponding to bistratified cells and projection cells). The dashed lines indicate the approximate boundaries of strata oriens (o), pyramidale (p), radiatum (r), and lacunosum/moleculare (lm). E, Somatic and dendritic morphometric parameters of biocytin-filled SOM-INs in Som-Raptor-WT and Som-Raptor-KO mice. F, Sholl analysis of dendritic arborization of reconstructed SOM-INs (20 μm bins) in Som-Raptor-WT and Som-Raptor-KO mice. ns, not significant.
Figure 4.
Figure 4.
Membrane and firing properties of SOM-INs from Som-Raptor-KO mice. A, Representative electrophysiological responses (top) of SOM-INs to current pulse injections (bottom) from Som-Raptor-WT (left) and Som-Raptor-KO (right) mice. Depolarizing current pulses correspond to near threshold (red) and 4 × threshold (blue) stimulation. B, Membrane and firing properties of SOM-INs from Som-Raptor-WT and Som-Raptor-KO mice.*p < 0.05; **p < 0.01; ns, not significant.
Figure 5.
Figure 5.
Som-Raptor-KO mice show impaired long-term contextual fear memory. A, Representative paths traveled by Som-Raptor-WT (left) and Som-Raptor-KO (right) mice during 5 min free exploration in a circular open field. B, Anxiety properties in the open-field test: percentage of time spent in the center and in the periphery (left) and center/periphery ratio (right). C, Locomotion properties in the open-field test: total distance traveled, zone transition number, percentage of resting time and running speed. D, Diagram of the contextual fear conditioning protocol. E, Percentage of time freezing after each foot shock during the training session for Som-Raptor-WT and Som-Raptr-KO mice (0: before the first foot shock). F, Percentage of time freezing during the probe tests at 1 h (left) and at 24 h (right). G, Percentage of time freezing during the contextual discrimination test in a novel context (left) and discrimination ratio (right). H, Diagram of the auditory-cued fear conditioning protocol. I, Percentage of time freezing for Som-Raptor-WT and Som-Raptor-KO mice during the training session (left) and during the probe test at 24 h (right). *p < 0.05; **p < 0.01; ***p < 0.001; ns, not significant.
Figure 6.
Figure 6.
Som-Raptor-KO mice show impaired long-term reference spatial memory. A, Diagram of the spatial learning protocol in the Barnes maze. B, From left to right: representative paths traveled by Som-Raptor-WT (left) and Som-Raptor-KO (right) mice during the first and last (16th) acquisition trials, as well as during the primary search and total search of the probe test. C, Performance in the Barnes maze during the training of Som-Raptor-WT and Som-Raptor-KO mice. D, Spatial memory performance during the primary search of the probe test. Errors, latency and distance before the first visit of the target. E, Percentage of time spent in each quadrant of the maze during the total search period of the probe test. L, Left, T, target; R, right; O, opposite quadrants. F, Number of visits to all escape holes (left), number of visits expressed as target versus average of all nontarget holes (middle) and selective search ratios (right). G, Percentage of total trials performed using one of three types of strategy (spatial, thygmotactism and random/mixed) to solve the maze by Som-Raptor-WT (left) and Som-Raptor-KO (right) mice. The dashed line represents chance level (10%) to find the target with a direct path. H, Percentage of trials using a spatial strategy over the training protocol. The dashed line represents chance (10%). *p < 0.05; **p < 0.01; ***p < 0.001; ns, not significant.
Figure 7.
Figure 7.
Tsc1 knock-down increases mTORC1 signaling and facilitates mGluR1-mediated late-LTP in SOM-INs. A, Diagram of chemical late-LTP experimental protocol in acute slices. B, Left, representative Western blots of phosphorylated S6S235/236 from hippocampal lysates. Right, p-S6S235/236 (normalized to S6 and tubulin) levels (relative to Som-TSC1-WT mice). C, D, Representative confocal images illustrating EYFP+ CA1 SOM-INs (green), S6S235/236 phosphorylation (red) and colabeling (merged) in Som-TSC1-WT (C) and Som-TSC1-KO (D) mice, after sham and DHPG/MPEP treatments. Arrows point to EYFP+ SOM-INs with p-S6 colabeling. E, p-S6S235/236 level in the different groups relative to sham treatment in Som-TSC1-WT mice. F, Representative EPSCs evoked by minimal stimulation in SOM-INs. Traces are superimposed 20 consecutive events (EPSCs + failures, black), average EPSC (including failures, orange) and average of EPSC pairs (20 events) evoked by paired-pulse stimulation. G, EPSC potency (excluding failures) and paired-pulse ratio of SOM-INs 2 h after sham, single and repeated DHPG/MPEP treatment in WT, Som-TSC1-KO and Som-Raptor-KO mice. *p < 0.05; **p < 0.01; ***p < 0.001; ns, not significant.
Figure 8.
Figure 8.
Membrane and firing properties of SOM-INs from Som-TSC1-KO mice. A, Representative electrophysiological responses (top) of SOM-INs to current pulse injections (bottom) from Som-TSC1-WT (left) and Som-TSC1-KO (right) mice. Depolarizing current pulses correspond to near threshold (red) and 3× threshold (blue) stimulation. B, Membrane and firing properties of SOM-INs from Som-TSC1-WT and Som-TSC1-KO mice, showing intact resting membrane potential, specific membrane capacitance, latency to first action potential (AP), rheobase, AP threshold, AP amplitude, AP half-width, firing rate at rheobase ×2 and adaptation ratio at rheobase ×3; and reduced input resistance and fAHP amplitude. *p < 0.05; ns, not significant.
Figure 9.
Figure 9.
Tsc1 deletion in SOM-INs increased long-term contextual fear memory but impaired context discrimination. A, Representative paths traveled by Som-TSC1-WT (left) and Som-TSC1-KO (right) mice during 5 min free exploration in a square open-field. B, Anxiety properties of Som-TSC1-WT and Som-TSC1-KO mice: percentage of time freezing in the center and in the periphery, and center/periphery ratio. C, Locomotion properties of Som-TSC1-KO mice: total distance traveled, number of zone transitions, resting time and running speed. D, Diagram of the contextual fear conditioning protocol. E, Percentage of time freezing after each foot shock during the training session for Som-TSC1-WT and Som-TSC1-KO mice (0: before the first foot shock). F, Percentage of time freezing during the probe tests at 1 h and at 24 h after conditioning. G, Percentage of time freezing (left) and discrimination ratio (right) during the contextual discrimination test. H, Diagram of the auditory-cued fear conditioning protocol. I, Percentage of time freezing during the training session (left) and during the probe test 24 h after (right) for Som-TSC1-WT and Som-TSC1-KO mice. **p < 0.01; ***p < 0.001; ns, not significant.
Figure 10.
Figure 10.
Som-TSC1-KO mice show enhanced spatial learning and long-term reference memory. A, Diagram of the spatial learning protocol in the Barnes maze. B, Left to right, Representative paths traveled by Som-TSC1-WT (left) and Som-TSC1-KO (right) mice during the first and last (16th) acquisition trials, as well as during the primary search and total search of the probe test. C, Learning curves for Som-TSC1-WT and Som-TSC1-KO mice during the training session. D, Memory performance during the primary search of the probe test. E, Number of visits to all escape holes (left) and selective search ratio (right) during the total search of the probe test. *p < 0.05; **p < 0.01; ***p < 0.001.
Figure 11.
Figure 11.
Contextual fear learning induces mGluR1- and mTORC1-mediated persistent LTP at excitatory synapses onto SOM-INs. A, Diagram of the experimental protocol in acute slices. a, Alveus; o, oriens; p, pyramidale; r, radiatum; lm, lacunosum-moleculare; stim, stimulation pipette; rec, recording pipette. B, Representative traces of spontaneous synaptic activity in SOM-INs from naive and trained Som-Raptor-WT and Som-Raptor-KO mice. C, Spontaneous EPSC frequency and amplitude. D, Representative traces of EPSCs evoked by minimal stimulation in the different conditions. E, Minimally evoked EPSC potency, paired-pulse ratio and minimal stimulation intensity. F, Representative traces of evoked input-output function in SOM-INs in the different conditions. G, Input-output gain of SOM-INs as the slope of individual linear regressions. H, Synaptic properties of SOM-INs from CFC-trained Som-Raptor-WT mice treated with mGluR1 antagonist JNJ16259685 relative to vehicle (VEH). *p < 0.05; **p < 0.01; ***p < 0.001; ns, not significant.
Figure 12.
Figure 12.
mTORC1-mediated late-LTP induction protocol in SOM-INs upregulates SC-LTP in principal cells. A, Recording configuration for late-LTP induction and whole-cell recording 2 h later. B, Representative traces of EPSCs evoked by minimal stimulation in control condition and after repeated TBS stimulation, in Som-Raptor-WT and Som-Raptor-KO mice. Traces are superimposed 20 consecutive events (EPSCs + failures, black), average EPSC (including failures, orange) and average of EPSC pairs (20 events) evoked by paired-pulse stimulation. C, EPSC amplitude, potency (excluding failures) and paired-pulse ratio. D, Recording configuration and simplified diagram of underlying CA1 network. SC: Schaffer collaterals, TA: temporo-ammonic pathway, PC: pyramidal cell, Som: SOM-INs, rad: radiatum interneuron. E, Representative traces and amplitude of field EPSPs in response to incremental SC stimulation in Som-Raptor-WT and Som-Raptor-KO mice. F, Representative traces and ratio of field EPSPs amplitude in response to SC paired-pulse stimulations. G, Top: Description of the stimulation and induction protocol. Left: representative traces of field EPSPs in response to SC stimulation 10 min before (1) and 30 min after weak HFS (wHFS, 100 Hz, 750 ms) stimulation (2) to induce SC-LTP, in control condition and 2 h after the SOM-INs late-LTP induction protocol (repeated TBS stimulation) in Som-Raptor-WT mice. Right: Graph of LTP of field EPSP slope induced by wHFS. H, Same as G in Som-Raptor-KO mice. I, SC-LTP upregulation 2 h after SOM-INs late-LTP induction protocol, normalized to the averaged control SC-LTP. *p < 0.05; **p < 0.01; ns, not significant.
Figure 13.
Figure 13.
Model for regulation of hippocampal memory by mTORC1-mediated late-LTP in CA1 SOM interneurons. Hippocampal learning engages CA1 pyramidal cell firing that increases mGluR1-mediated mTORC1 activity in SOM-INs and induces Hebbian late-LTP at SOM-INs excitatory input synapses. Late-LTP in SOM-INs is then converted into increased output firing that upregulates LTP at SC synapses onto local pyramidal cells by disinhibition. Facilitated LTP in the CA1 principal pathway supports memory consolidation and promotes long-term hippocampal memory for future recall.

References

    1. Abel T, Nguyen PV, Barad M, Deuel TA, Kandel ER, Bourtchouladze R (1997) Genetic demonstration of a role for PKA in the late phase of LTP and in hippocampus-based long-term memory. Cell 88:615–626. 10.1016/S0092-8674(00)81904-2 - DOI - PubMed
    1. Artinian J, Lacaille JC (2018) Disinhibition in learning and memory circuits: new vistas for somatostatin interneurons and long-term synaptic plasticity. Brain Res Bull 141:20–26. 10.1016/j.brainresbull.2017.11.012 - DOI - PubMed
    1. Banko JL, Poulin F, Hou L, DeMaria CT, Sonenberg N, Klann E (2005) The translation repressor 4E-BP2 is critical for eIF4F complex formation, synaptic plasticity, and memory in the hippocampus. J Neurosci 25:9581–9590. 10.1523/JNEUROSCI.2423-05.2005 - DOI - PMC - PubMed
    1. Banko JL, Hou L, Poulin F, Sonenberg N, Klann E (2006) Regulation of eukaryotic initiation factor 4E by converging signaling pathways during metabotropic glutamate receptor-dependent long-term depression. J Neurosci 26:2167–2173. 10.1523/JNEUROSCI.5196-05.2006 - DOI - PMC - PubMed
    1. Barnes CA. (1979) Memory deficits associated with senescence: a neurophysiological and behavioral study in the rat. J Comp Physiol Psychol 93:74–104. 10.1037/h0077579 - DOI - PubMed

Publication types

Substances

Grants and funding