. 2019 Nov 6;39(45):8831-8844.
doi: 10.1523/JNEUROSCI.0901-19.2019. Epub 2019 Sep 13.

Spatial Coupling Tunes NMDA Receptor Responses via Ca2+ Diffusion

Affiliations

Spatial Coupling Tunes NMDA Receptor Responses via Ca2+ Diffusion

Gary J Iacobucci et al. J Neurosci. .

Abstract

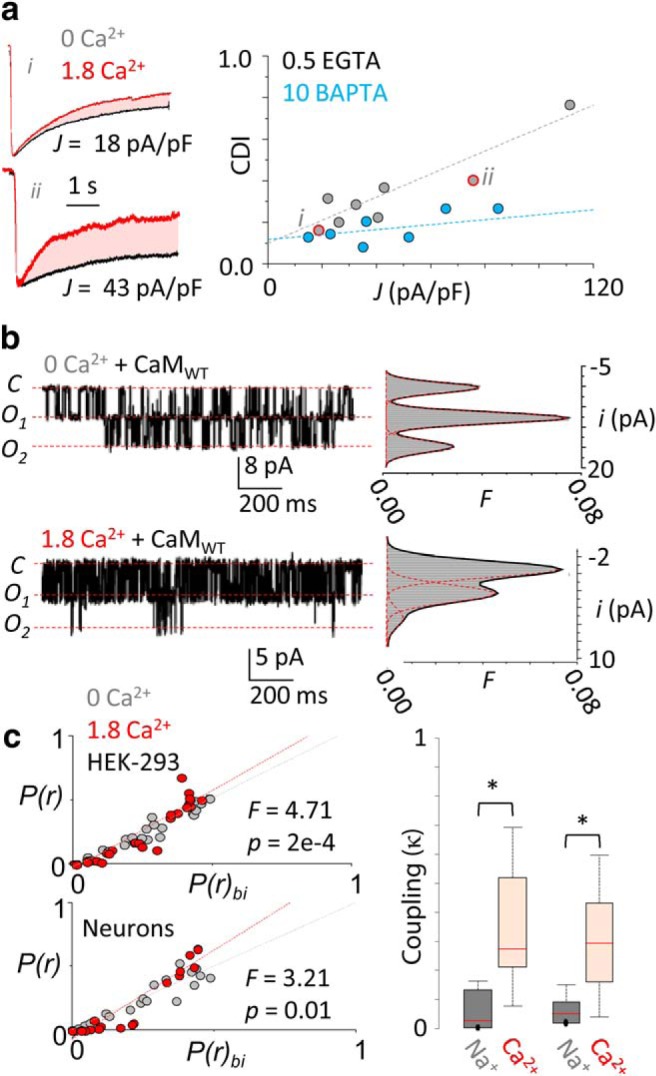
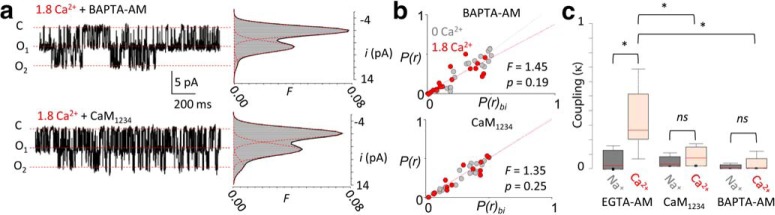
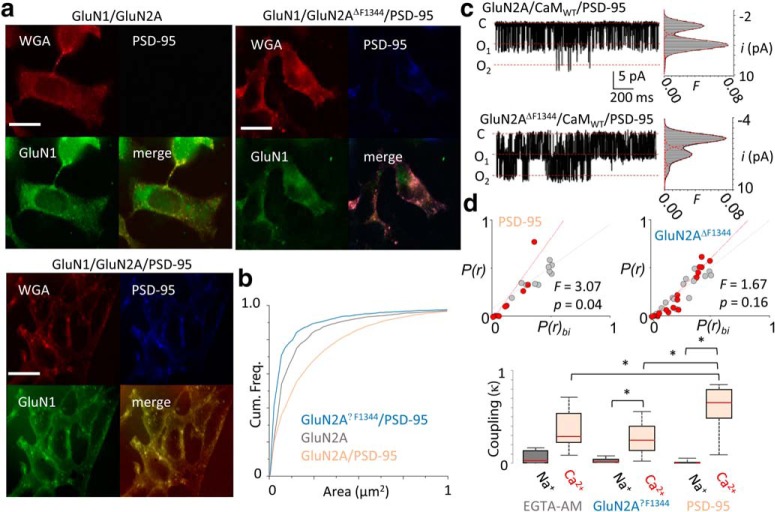
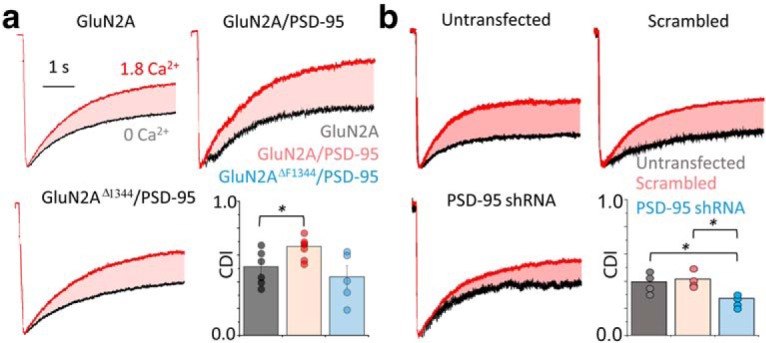
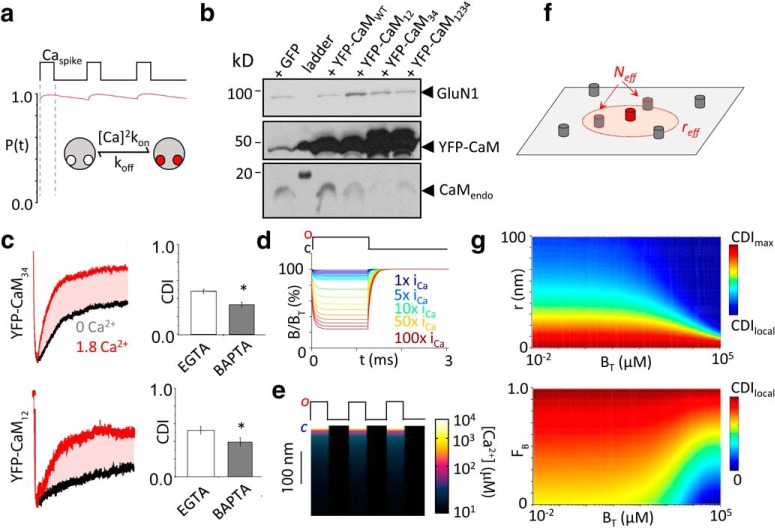
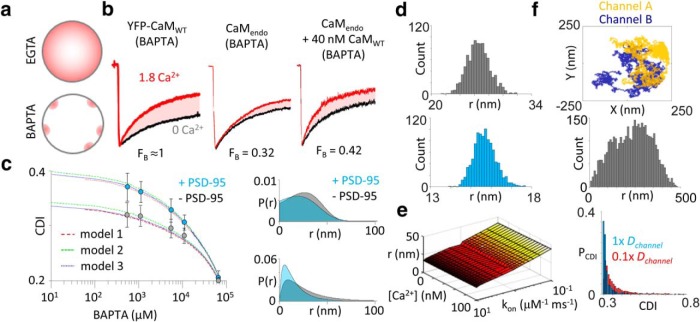
In the CNS, NMDA receptors generate large and highly regulated Ca2+ signals, which are critical for synaptic development and plasticity. They are highly clustered at postsynaptic sites and along dendritic arbors, but whether this spatial arrangement affects their output is unknown. Synaptic NMDA receptor currents are subject to Ca2+-dependent inactivation (CDI), a type of activity-dependent inhibition that requires intracellular Ca2+ and calmodulin (CaM). We asked whether Ca2+ influx through a single NMDA receptor influences the activity of nearby NMDA receptors, as a possible coupling mechanism. Using cell-attached unitary current recordings from GluN1-2a/GluN2A receptors expressed in human HEK293 cells and from NMDA receptors native to hippocampal neurons from male and female rats, we recorded unitary currents from multichannel patches and used a coupled Markov model to determine the extent of signal coupling (κ). In the absence of extracellular Ca2+, we observed no cooperativity (κ < 0.1), whereas in 1.8 mm external Ca2+, both recombinant and native channels showed substantial negative cooperativity (κ = 0.27). Intracellular Ca2+ chelation or overexpression of a Ca2+-insensitive CaM mutant, reduced coupling, which is consistent with CDI representing the coupling mechanism. In contrast, cooperativity increased substantially (κ = 0.68) when overexpressing the postsynaptic scaffolding protein PSD-95, which increased receptor clustering. Together, these new results demonstrate that NMDA receptor currents are negatively coupled through CDI, and the degree of coupling can be tuned by the distance between receptors. Therefore, channel clustering can influence the activity-dependent reduction in NMDA receptor currents.SIGNIFICANCE STATEMENT At central synapses, NMDA receptors are a major class of excitatory glutamate-gated channels and a source of activity-dependent Ca2+ influx. In turn, fluxed Ca2+ ions bind to calmodulin-primed receptors and reduce further entry, through an autoinhibitory mechanism known as Ca2+ -dependent inactivation (CDI). Here, we show that the diffusion of fluxed Ca2+ between active channels situated within submicroscopic distances amplified receptor inactivation. Thus, calmodulin-mediated gating modulation, an evolutionarily conserved regulatory mechanism, endows synapses with sensitivity to both the temporal sequence and spatial distribution of Ca2+ signals. Perturbations in this mechanism, which coordinates the activity of NMDA receptors within a cluster, may cause signaling alterations that contribute to neuropsychiatric conditions.

Keywords: NMDA receptor; PSD-95; calmodulin; clustering; cooperative gating; patch-clamp.


Figures

Figure 1.
Figure 1.
NMDA receptor currents display negative cooperativity. a, Left, Glutamate-elicited currents from two cells (i and ii, red data points in graph at right) expressing GluN1-2a/GluN2A receptors in the absence (black) and presence (red) of 1.8 mm extracellular Ca2+ (superimposed and normalized to peak). For each cell, the calculated CDI (shaded area) and the measured current densities (J) are indicated. Right, Linear regressions for CDI-J data. Intracellular Ca2+ buffering strongly influenced the correlation between CDI and charge density are as follows: EGTA, R2 = 0.92; vs BAPTA, R2 = 0.19. b, Left, Representative current traces (3 s) recorded from a cell-attached patch containing two active receptors pretreated with EGTA-AM (20 μm) in the absence (top) and presence (bottom) of external Ca2+. Right, Corresponding unitary amplitude (i) frequency (F) histograms with superimposed Gaussian fits (red dotted) and the overall probability density function (solid black). c, Left, Correlations between predicted conductance class occupancies from binomial distribution [P(r)bi] and measured class occupancies [P(r)] for each record show deviations from independence in the presence of Ca2+ for both recombinant GluN1-2a/GluN2A receptors (top) and native receptors (bottom). c, Right, External Ca2+ increased κ values and variabilities in both recombinant (gray) and native receptors native (red). *p < 0.05, Mann–Whitney U test.
Figure 2.
Figure 2.
Negative cooperativity of NMDA receptor currents is Ca2+ and CaM dependent. a, Representative unitary currents from cell-attached patches containing two GluN1-2a/GluN2A receptors in the presence of 1.8 mm Ca2+, in HEK293 cells pretreated with BAPTA-AM (20 μm, top) or coexpressing YFP-CaM1234 (bottom), and corresponding amplitude histograms superimposed by fitted Gaussian components (red dashed) and probability density function (black). b, Correlations between predicted conductance class occupancies from binomial distribution for each recorded file [P(r)bi] and measured class occupancies [P(r)] show that intracellular buffering and CaM1234 reduce deviations from independence produced by Ca2+ (p determined by F test). c, Distributions of coupling coefficients, *p < 0.05, Mann–Whitney U test.
Figure 3.
Figure 3.
PSD-95 overexpression enhances negative cooperativity of NMDA receptor currents. a, Top, Representative immunofluorescence images of HEK293 cells expressing GluN1–2a, GluN2A, and PSD-95, as indicated, and stained for GluN1 (green), PSD-95 (blue), and WGA (red). Scale bar, 25 μm. b, Cumulative probability of GluN1-positive punctae area for the indicated constructs. c, Representative current traces recorded from a two-channel patch with 0 or 1.8 mm external Ca2+ in cells coexpressing CaMWT and PSD-95, with corresponding amplitude histogram superimposed with fitted Gaussian components (red dashed) and probability density function (black). d, Top, Correlation of conductance class occupancies for GluN1-2a/GluN2A receptors (left) and GluN1-2a/GluN2AΔF1344 (right) coexpressed with PSD-95 showed substantial deviations from the predicted open conductance occupancies predicted from binomial distribution for independent gating (red dashed curves); *p < 0.05, Mann–Whitney U test compared with simulated datasets. Bottom, Distributions of κ values in the conditions indicated; *p < 0.05, Mann–Whitney U test.
Figure 4.
Figure 4.
PSD-95 enhances CDI in recombinant and native receptors. a, Whole-cell current recordings from cells expressing GluN1–2a and the indicated GluN2A and PSD-95 constructs in 0 (black) and 1.8 mm Ca2+ (red), overlaid and normalized to peak; shaded area highlights CDI, and bar graph summary of data; *p < 0.05, Mann–Whitney U test. b, Whole-cell current recordings from dissociated hippocampal neurons (15–20 d in vitro) transfected with the indicated shRNA constructs. Glutamate elicited currents recorded in the continuous presence of CNQX and ifenprodil, and the bar graph summary of data; *p < 0.05, Mann–Whitney U test.
Figure 5.
Figure 5.
Independence of CDI on Ca2+-binding kinetics of CaM lobe. a, Simulation of Ca2+/CaM C-lobe binding dynamics during a train of local Ca2+spikes at rCaM (Caspike = 90 μm) demonstrate that C-lobe occupancy remains saturated during normal channel gating. b, Western blot confirms substantial overexpression of recombinant YFP-CaM constructs relative to CaMendo and expressed channels (GluN1). c, Left, Whole-cell macroscopic currents from GluN1-2a/GluN2A receptors coexpressed with YFP-CaM34 (top) or YFP-CaM12 (bottom). Right, Each condition did not alter channel CDI or sensitivity to BAPTA. *p < 0.05 with Mann–Whitney U test. d, Simulation of free buffer concentration at r = 10 nm from channel pore during channel opening. Unitary iCa was progressively increased. e, Spatiotemporal simulation of Ca2+ diffusion in the presence of 10 mm BAPTA during channel gating. o, Open; c, closed. f, Schematic of a 2D membrane element with channels (cylinders) randomly distributed. For any given channel (red), an reff surrounding the channel sets the spatial limit that a neighboring channel must reside for Ca2+ influx to inactivate the primary channel (red dashed circle). g, Top, Evaluation of Equation 22 at fixed fractional channels preassociated with CaM (FB = 0.4) predicts a broad CDI range across varying coupling distances, r, and BT values. Bottom, Evaluation of Equation 22 at fixed coupling distance (r = 50 nm) at varying levels of channels preassociated with apoCaM.
Figure 6.
Figure 6.
PSD-95 decreases the effective coupling distance between NMDA receptors. a, Schematic of intracellular Ca2+ concentration gradients (pink) during whole-cell recordings in weak buffering (EGTA) and strong buffering (BAPTA) conditions. Restricting Ca2+ elevations within local nanodomains of the source reveals the fraction of channels preassociated with CaM. b, Representative whole-cell current from GluN1-2a/GluN2A and with YFP-CaMWT (left), with CaMendo or with 40 nm purified CaMWT (right). c, Left, CDI measurements in cells either lacking (gray) or coexpressing (blue) PSD-95 and with increasing concentrations of intracellular BAPTA. Three variants of Equation 22 were fit to the data: model 1, r is constant; model 2, r is a skewed Gaussian distribution; and model 3, r is a weighted exponential distribution. Right, Hypothetical distributions of effective channel coupling distance predicted by models 2 (top) and 3 (bottom) using the parameter values determined from the fit. d, The statistical error of coupling distance parameter (r) estimation from the fits was determined by generating 1000 artificial datasets using a bootstrap procedure and analyzing these sets as the original by fit with generalized model. Histogram of coupling distances, r, of bootstrap analysis from cells not expressing (top) and expressing (bottom) PSD-95. e, Systematic error of the model was evaluated by systematically changing model parameter (BAPTA kinetics, kon, and free basal Ca2+) values over two orders of magnitude. f, Monte Carlo simulation of lateral diffusion of channels within patch pipette. Top, Trajectories of two channels explored by lateral diffusion during a cell-attached patch-clamp experiment. Middle, Distribution of interchannel distances during patch-clamp recording. Bottom, Distribution of predicted CDI values calculated with Equation 22. The probability of CDI [P(CDI)] during single-channel recordings follows an exponential distribution as a result of lateral diffusion. Reduction of the diffusion coefficient (Dchannel) shifts the distribution toward stronger CDI magnitudes.

References

    1. Aarts M, Liu Y, Liu L, Besshoh S, Arundine M, Gurd JW, Wang YT, Salter MW, Tymianski M (2002) Treatment of ischemic brain damage by perturbing NMDA receptor- PSD-95 protein interactions. Science 298:846–850. 10.1126/science.1072873 - DOI - PubMed
    1. Adams PJ, Ben-Johny M, Dick IE, Inoue T, Yue DT (2014) Apocalmodulin itself promotes ion channel opening and Ca(2+) regulation. Cell 159:608–622. 10.1016/j.cell.2014.09.047 - DOI - PMC - PubMed
    1. Akyol Z, Bartos JA, Merrill MA, Faga LA, Jaren OR, Shea MA, Hell JW (2004) Apo-calmodulin binds with its C-terminal domain to the N-methyl-D-aspartate receptor NR1 C0 region. J Biol Chem 279:2166–2175. 10.1074/jbc.M302542200 - DOI - PubMed
    1. Ataman ZA, Gakhar L, Sorensen BR, Hell JW, Shea MA (2007) The NMDA receptor NR1 C1 region bound to calmodulin: structural insights into functional differences between homologous domains. Structure 15:1603–1617. 10.1016/j.str.2007.10.012 - DOI - PMC - PubMed
    1. Beal MF, Kowall NW, Ellison DW, Mazurek MF, Swartz KJ, Martin JB (1986) Replication of the neurochemical characteristics of Huntington's disease by quinolinic acid. Nature 321:168–171. 10.1038/321168a0 - DOI - PubMed

Publication types

LinkOut - more resources