. 2019 Sep 13;10(1):4174.
doi: 10.1038/s41467-019-12058-z.

Layer 4 of mouse neocortex differs in cell types and circuit organization between sensory areas

Affiliations

Layer 4 of mouse neocortex differs in cell types and circuit organization between sensory areas

Federico Scala et al. Nat Commun. .

Erratum in

Abstract

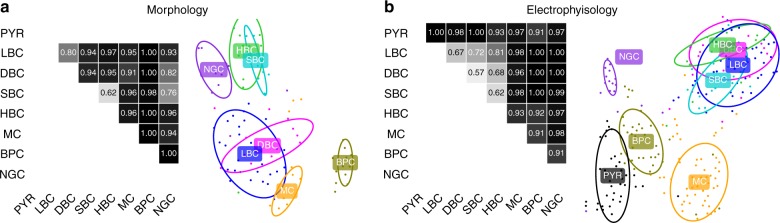
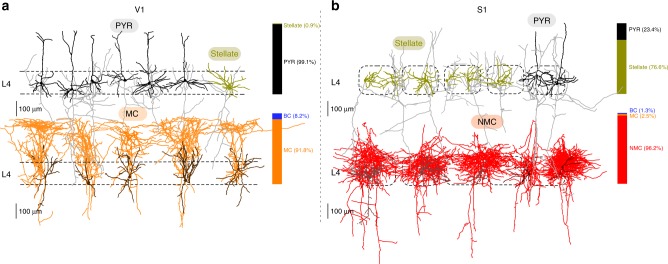
Layer 4 (L4) of mammalian neocortex plays a crucial role in cortical information processing, yet a complete census of its cell types and connectivity remains elusive. Using whole-cell recordings with morphological recovery, we identified one major excitatory and seven inhibitory types of neurons in L4 of adult mouse visual cortex (V1). Nearly all excitatory neurons were pyramidal and all somatostatin-positive (SOM+) non-fast-spiking interneurons were Martinotti cells. In contrast, in somatosensory cortex (S1), excitatory neurons were mostly stellate and SOM+ interneurons were non-Martinotti. These morphologically distinct SOM+ interneurons corresponded to different transcriptomic cell types and were differentially integrated into the local circuit with only S1 neurons receiving local excitatory input. We propose that cell type specific circuit motifs, such as the Martinotti/pyramidal and non-Martinotti/stellate pairs, are used across the cortex as building blocks to assemble cortical circuits.


Conflict of interest statement

The authors declare no competing interests.

Figures

Fig. 1
Fig. 1
Morphological cell types in V1 L4. a Representative morphologies for each cell type. The dendrites are shown in a darker shade of color and axons in a lighter shade. Types are sorted by abundance from high to low. Fractions indicate the proportions among the neurons labeled in Viaat-Cre mice. PYR: pyramidal cells, LBC: large basket cells, MC: Martinotti cells, BPC: bipolar cells, NGC: neurogliaform cells, SBC: small basket cells, DBC: double-bouquet basket cells, HBC: horizontally elongated basket cells. b Spiking responses to step currents for two exemplary cells from each of the eight morphologically defined cell types
Fig. 2
Fig. 2
Discriminability of cell types in V1 L4. a Cross-validated pairwise classification accuracy for each pair of inhibitory cell types, using regularized logistic regression on a diverse set of morphological features. Total sample size n = 92. Right: 2D visualization of the same n = 92 cells in the space of morphological features using t-SNE. Ellipses show 80% coverage assuming 2D Gaussian distributions and using robust estimates of the mean and the covariance (i.e., ellipses do not include outliers). b Cross-validated pairwise classification accuracy for each pair of cell types, using electrophysiological features. Total sample size n = 235. Right: 2D visualization of the same n = 235 cells in the space of electrophysiological features using t-SNE
Fig. 3
Fig. 3
V1 differs from S1 in excitatory cells and SOM+ interneurons in L4. a Representative morphologies of excitatory and SOM+ neurons in V1 L4. Bar graphs indicate the fractions of each cell type among all morphologically recovered excitatory neurons (top) and all morphologically recovered neurons labeled in the SOM-Cre line (bottom). b The same in S1 L4. Dashed rectangles represent individual cortical barrels
Fig. 4
Fig. 4
Transcriptomic and electrophysiological differences between L4 SOM+ interneurons in V1 and S1. a Morphologies and firing patterns of two exemplary cells, from V1 (orange) and S1 (red), respectively. b Mapping of the Patch-seq cells (n = 110) to the t-SNE visualization of the transcriptomic diversity among Sst types from Tasic et al. t-SNE was done on all cells from Sst types except for Sst Chodl that is very well separated from the rest (20 clusters; n = 2701 cells), using 500 most variable genes (see Methods). Two ellipses show 90% coverage areas of the two types where the most Patch-seq cells land. Mapping to t-SNE was performed as we described elsewhere, see Methods. “Sst” was omitted from type names for brevity. c Four electrophysiological features that differed most strongly (Cohen’s d > 1) between V1 L4 and S1 L4 cells. Only cells assigned to Sst Calb2 Pdlim5 and Sst Hpse Cbln4 types are shown. Note that the values are not directly comparable to those shown in Supplementary Fig. 5 because Patch-seq experiments used a different internal solution compared to regular patch-clamp experiments without RNA extraction. d Sparse reduced-rank regression analysis: the left biplot shows two-dimensional projection in the transcriptomic space that is optimized to reconstruct the electrophysiological features. The right biplot shows the corresponding two-dimensional projection in the electrophysiological space; it should match to the left plot if the model is accurate. Color denotes brain area (orange for V1, red for S1), marker shape denotes transcriptomic type that each cell was assigned to (circles: Hpse Cbln4 type; diamonds: Calb2 Pdlim type; open diamonds: three Tac1/Mme types and the neighbouring Calb2 Necab1 type; open squares: all other types). Individual electrophysiological features and genes selected by the model are depicted with lines showing their correlations to the two components. Circles show maximal possible correlation. Cross-validated estimate of the overall R-squared was 0.14, and cross-validated estimates of the correlations between the horizontal and vertical components were 0.69 and 0.49, respectively. e Type assignments of the Patch-seq cells from L4
Fig. 5
Fig. 5
Connectivity between excitatory and SOM+ cells in L4 of V1 and S1. a Examples of simultaneous recordings from excitatory and SOM+ neurons in V1 L4. Recorded neurons were close to each other (generally less than 150 μm). Vertical scale bar indicates: amplitudes of injected currents in nA, amplitude of APs in mV and amplitude of uEPSPs or uIPSPs in mV. b Color-coded connectivity matrix shows the connection probability between cell types as a percentage of tested potential connections. Averages of uEPSPs and uIPSPs as well as PPRs are reported in Supplementary Fig. 9. For the connectivity involving LBCs, see also Supplementary Fig. 10. c Schematic of the local circuitry in L4 V1. For gap junctions, see Supplementary Fig. 8. Line thickness corresponds to connection probability. df The same for L4 S1. In the schematic (f), the connectivity rate involving PV+ interneurons (mostly LBCs) is taken from Ma et al.. All the PV+ connections are shown with the same strength as that study used juvenile (P15) mice and so connection strengths are not directly comparable to the values obtained in our experiments. Regarding gap junctions between FS interneurons see also Galaretta et al. and Gibson et al.,

References

    1. Harris KD, Shepherd GMG. The neocortical circuit: themes and variations. Nat. Neurosci. 2015;18:170–181. - PMC - PubMed
    1. Simons DJ, Woolsey TA. Morphology of Golgi-Cox-impregnated barrel neurons in rat SmI cortex. J. Comp. Neurol. 1984;230:119–132. - PubMed
    1. Feldmeyer D, Egger V, Lübke J, Sakmann B. Reliable synaptic connections between pairs of excitatory layer 4 neurones within a single ‘barrel’ of developing rat somatosensory cortex. J. Physiol. 1999;521:169–190. - PMC - PubMed
    1. Petersen CCH, Sakmann B. The excitatory neuronal network of rat layer 4 barrel cortex. J. Neurosci. 2000;20:7579–7586. - PMC - PubMed
    1. Schubert D, Kötter R, Zilles K, Luhmann HJ, Staiger JF. Cell type-specific circuits of cortical layer IV spiny neurons. J. Neurosci. 2003;23:2961–2970. - PMC - PubMed

Publication types