. 2019 Sep 13;10(1):4179.
doi: 10.1038/s41467-019-12081-0.

Dynamic changes of muscle insulin sensitivity after metabolic surgery

Affiliations

Dynamic changes of muscle insulin sensitivity after metabolic surgery

Sofiya Gancheva et al. Nat Commun. .

Erratum in

  • Author Correction: Dynamic changes of muscle insulin sensitivity after metabolic surgery.
    Gancheva S, Ouni M, Jelenik T, Koliaki C, Szendroedi J, Toledo FGS, Markgraf DF, Pesta DH, Mastrototaro L, De Filippo E, Herder C, Jähnert M, Weiss J, Strassburger K, Schlensak M, Schürmann A, Roden M. Gancheva S, et al. Nat Commun. 2022 Jun 10;13(1):3353. doi: 10.1038/s41467-022-29350-0. Nat Commun. 2022. PMID: 35688803 Free PMC article. No abstract available.

Abstract

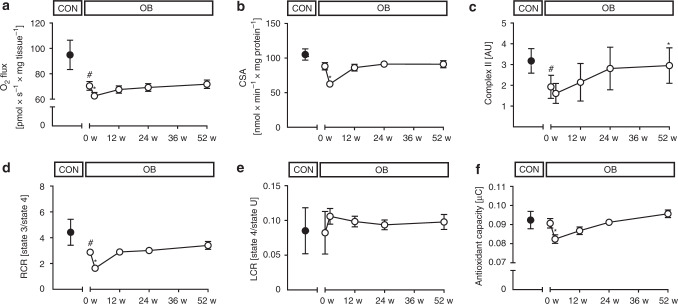
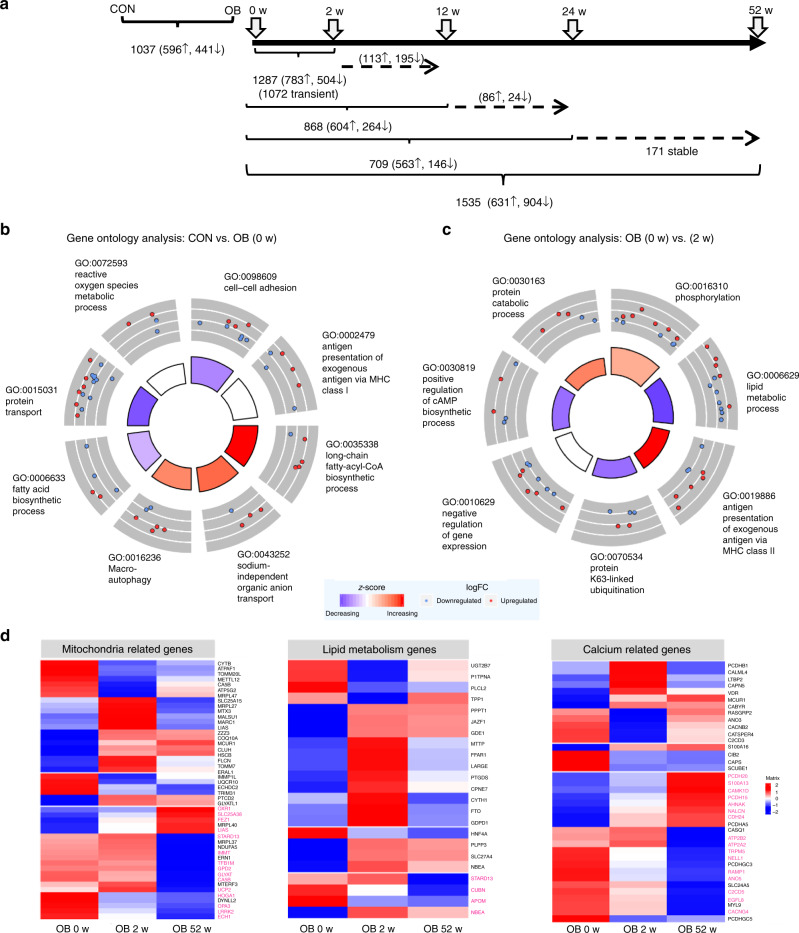
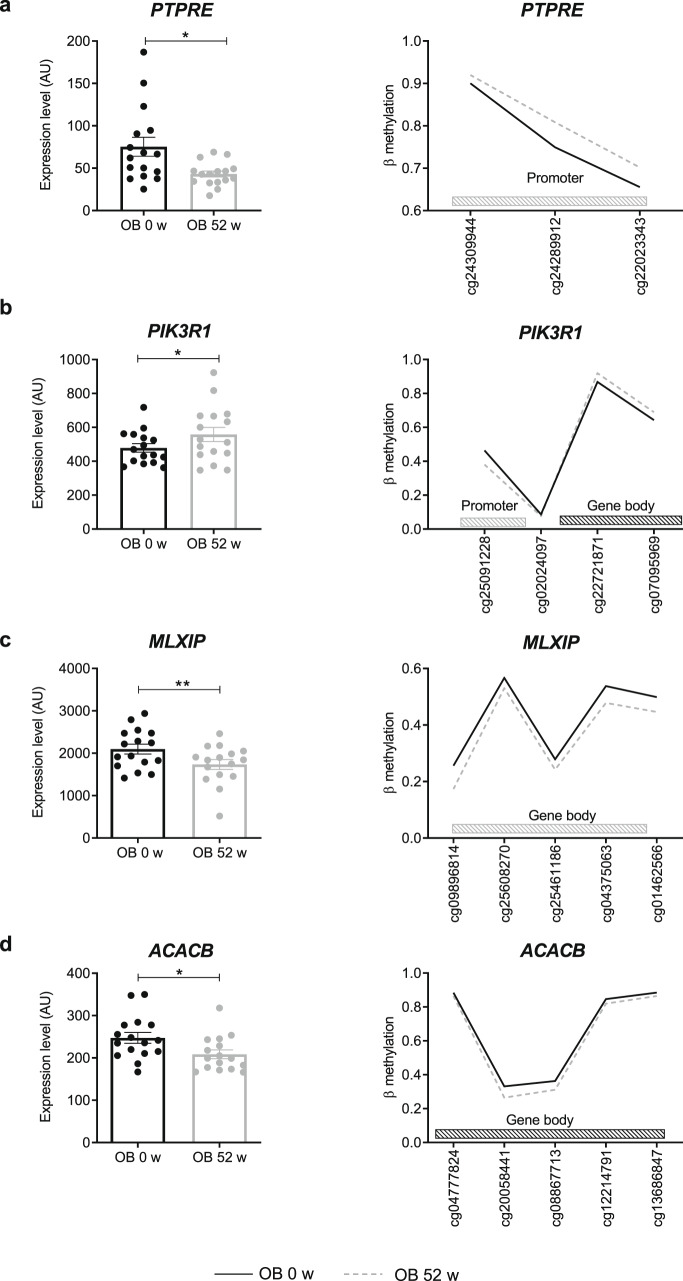
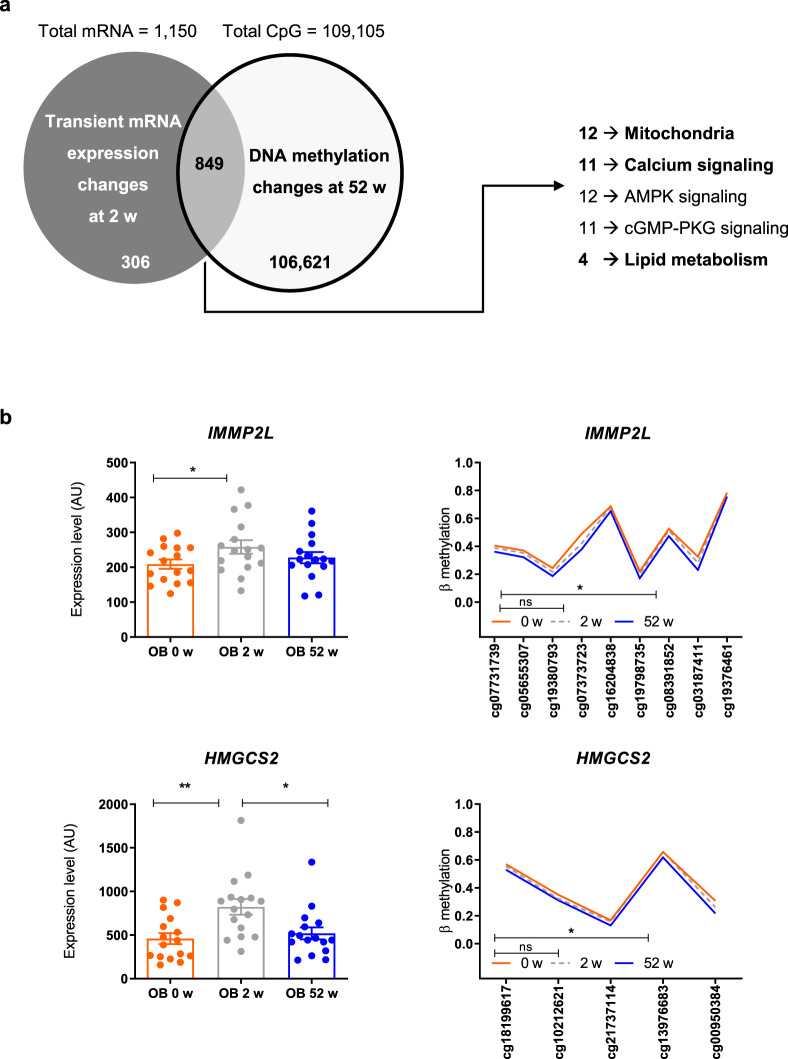
The mechanisms underlying improved insulin sensitivity after surgically-induced weight loss are still unclear. We monitored skeletal muscle metabolism in obese individuals before and over 52 weeks after metabolic surgery. Initial weight loss occurs in parallel with a decrease in muscle oxidative capacity and respiratory control ratio. Persistent elevation of intramyocellular lipid intermediates, likely resulting from unrestrained adipose tissue lipolysis, accompanies the lack of rapid changes in insulin sensitivity. Simultaneously, alterations in skeletal muscle expression of genes involved in calcium/lipid metabolism and mitochondrial function associate with subsequent distinct DNA methylation patterns at 52 weeks after surgery. Thus, initial unfavorable metabolic changes including insulin resistance of adipose tissue and skeletal muscle precede epigenetic modifications of genes involved in muscle energy metabolism and the long-term improvement of insulin sensitivity.


Conflict of interest statement

The authors declare no competing interests.

Figures

Fig. 1
Fig. 1
Time course of metabolic changes. Time course of changes in adipose tissue insulin sensitivity given as Adipo-IR (fasting free fatty acids*fasting insulin) (CON n = 14, OB n = 47) (a), muscle insulin sensitivity (CON n = 7, OB n = 43) (b), muscle membrane DAG 18:1 18:1 (CON n = 4, OB n = 10) (c), muscle protein kinase C (PKC) θ activation (CON n = 4, OB n = 9) (d), muscle lipid droplet ceramide 18:0 (CON n = 4, OB n = 10) (e) and muscle pJNK/tJNK ratio (CON n = 4, OB n = 8) (f) in obese (empty circles) and in nonobese humans at baseline (black circles). Mean ± SEM, *p < 0.05 vs OB at baseline (0 w) using CPM for repeated measures analysis, #p < 0.05 vs CON using unpaired two-tailed t-test, CON nonobese humans, OB obese participants, BSA body surface area, LD lipid droplet, DAG diacylglycerol, pJNK phosphorylated c-Jun N-terminal kinase, tJNK total c-Jun N-terminal kinase
Fig. 2
Fig. 2
Time course of muscle changes. Time course of changes in muscle maximum uncoupled respiration (CON n = 14, OB n = 45) (a), citrate synthase activity (CSA) (CON n = 13, OB n = 45) (b), electron transport chain complex II succinate dehydrogenase complex iron sulfur subunit B protein content (CON n = 10, OB n = 15) (c), respiratory control ratio (RCR) (CON n = 13, OB n = 43) (d), leak control ratio (LCR) (CON n = 13, OB n = 44) (e) and serum antioxidant capacity (CON n = 6, OB n = 28) (f) in obese (empty circles) and nonobese humans at baseline (black circles). Mean ± SEM, *p < 0.05 vs OB at baseline (0 w) using CPM for repeated measures analysis, #p < 0.05 vs CON using unpaired two-tailed t-test. CON nonobese humans, OB obese participants
Fig. 3
Fig. 3
Differences in skeletal muscle transcriptome. Transcriptome analysis of skeletal muscle before (0 weeks), at 2, 12, 24 and 52 weeks after metabolic surgery. Data are given as number of differentially expressed transcripts between indicated groups and time points (a). Gene ontology analysis of genes differentially expressed between lean (CON) and obese (OB) participants. The inner circle depicts the main processes to be increased (blue) or decreased (red) in OB. The outer circle shows scaled scatter plots for affected genes and their regulation within the most-enriched biological pathway in OB at baseline (OB, 0 w) (b) and 2 weeks after the surgery (OB, 2 w) (c). Changes in mRNA expression of genes related to mitochondrial function, lipid metabolism and calcium signaling in skeletal muscle (d). Heat maps indicate expression levels of listed genes at 0 (baseline), 2 and 52 weeks after metabolic surgery. Each column represents the average expression level of 16 individuals and each row shows the expression profile of one single transcript with significant differences. Up- and downregulated genes are indicated by red and blue signals, respectively; the signal intensity corresponds to the log-transformed magnitude of the average of expression per group. All genes printed in bold magenta show differentially methylated CpGs at 52 weeks. For gene expression unadjusted p-value and DNA methylation data are adjusted for multiple testing with Benjamini Hochberg correction *p < 0.05 (unpaired (CON vs OB) and paired (OB 0 vs 2 weeks/52 weeks two-tailed t-test; CON: n = 6, OB: n = 16)
Fig. 4
Fig. 4
Genome wide DNA methylation analysis in skeletal muscle. The number of differentially methylated CpG sites between the indicated groups (a). A total of 2956 CpG sites are located in/or in close proximity of 921 genes exhibiting different expression between baseline and 52 weeks. Gene ontology analysis of 921 differentially expressed genes with altered levels of DNA methylation at 52 weeks (b). Up- and downregulated genes are indicated by red and blue signals, respectively. *p < 0.05 (unadjusted p-value paired t test for gene expression, n = 16, methylation data with Benjamini Hochberg correction)
Fig. 5
Fig. 5
Gene candidates showing differences in expression and DNA methylation. Expression is shown in left panels and levels of DNA methylation in right panels. Differentially methylated CpGs are located at different positions of the genes, either in the promoter as shown for PTPRE (a), in the gene body as shown for MLXIP (c) and ACACB (d), or in both as depicted in PIK3R1 (b). Mean ± SEM (left panels). Obese humans given as black circles/lines at baseline and as gray circles/lines at 52 weeks. Only significantly differentially methylated CpGs are represented; *p < 0.05 (Gene expression unadjusted p-value paired t test, n = 16, methylation data with Benjamini Hochberg correction)
Fig. 6
Fig. 6
Reprogramming of gene transcripts by DNA methylation at 52 weeks. Seventy-five percent of genes exhibiting transient differences in expression at baseline show changes in DNA methylation at 52 weeks. Chi-square test p < 10−255. Gene ontology analysis identified the indicated number of genes to be altered in the listed cellular processes (right panel) (a). Examples of changes in DNA methylation in IMMP2L (upper panel) and HMGCS2 genes (lower panel). Both genes are only differentially expressed 2 weeks after the surgery (b). Mean ± SEM, obese humans are shown as red circles/lines at baseline, as gray circles/lines at 2 weeks and as blue circles/lines at 52 weeks after surgery. *p < 0.05 (Gene expression unadjusted p-value 2-tailed paired t test, n = 16, methylation data with Benjamini Hochberg correction)

References

    1. Koliaki C, Roden M. Alterations of mitochondrial function and insulin sensitivity in human obesity and diabetes mellitus. Annu. Rev. Nutr. 2016;36:337–367. doi: 10.1146/annurev-nutr-071715-050656. - DOI - PubMed
    1. Cusi K. The role of adipose tissue and lipotoxicity in the pathogenesis of type 2 diabetes. Curr. Diabetes Rep. 2010;10:306–315. doi: 10.1007/s11892-010-0122-6. - DOI - PubMed
    1. Mingrone G, Cummings DE. Changes of insulin sensitivity and secretion after bariatric/metabolic surgery. Surg. Obes. Relat. Dis. 2016;12:1199–1205. doi: 10.1016/j.soard.2016.05.013. - DOI - PubMed
    1. Gastaldelli A, et al. Short-term effects of laparoscopic adjustable gastric banding versus roux-en-Y gastric bypass. Diabetes Care. 2016;39:1925–1931. doi: 10.2337/dc15-2823. - DOI - PubMed
    1. Astiarraga B, et al. Biliopancreatic diversion in nonobese patients with type 2 diabetes: impact and mechanisms. J. Clin. Endocrinol. Metab. 2013;98:2765–2773. doi: 10.1210/jc.2013-1476. - DOI - PubMed

Publication types