. 2019 Sep 13;10(1):4181.
doi: 10.1038/s41467-019-12123-7.

UPF1/SMG7-dependent microRNA-mediated gene regulation

Affiliations

UPF1/SMG7-dependent microRNA-mediated gene regulation

Jungyun Park et al. Nat Commun. .

Abstract

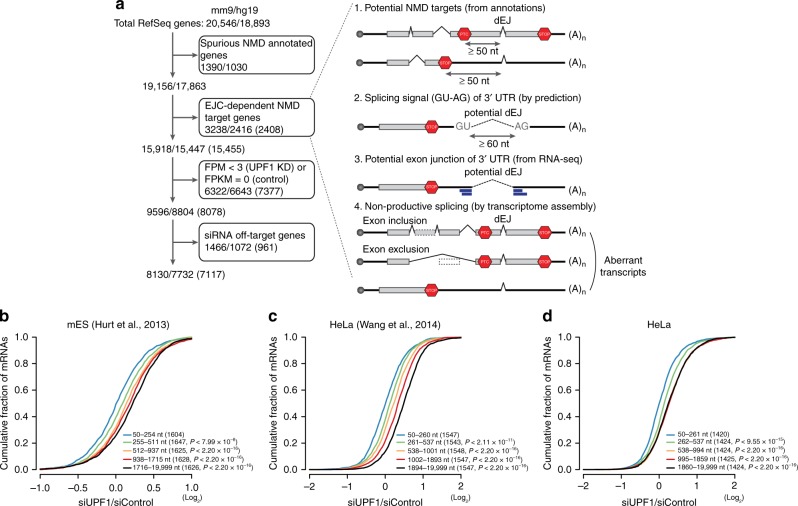
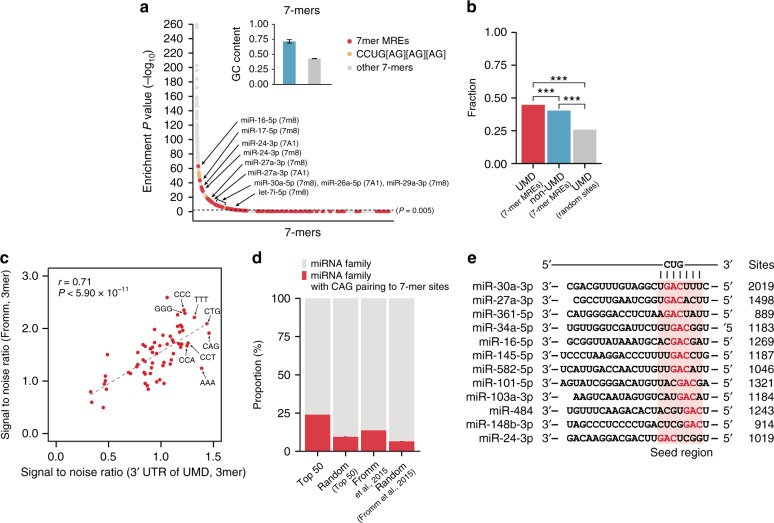
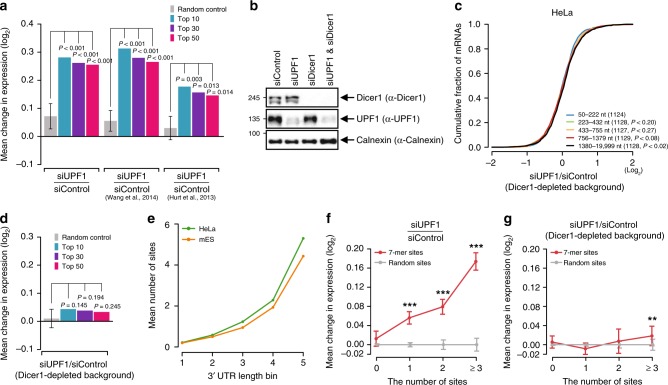
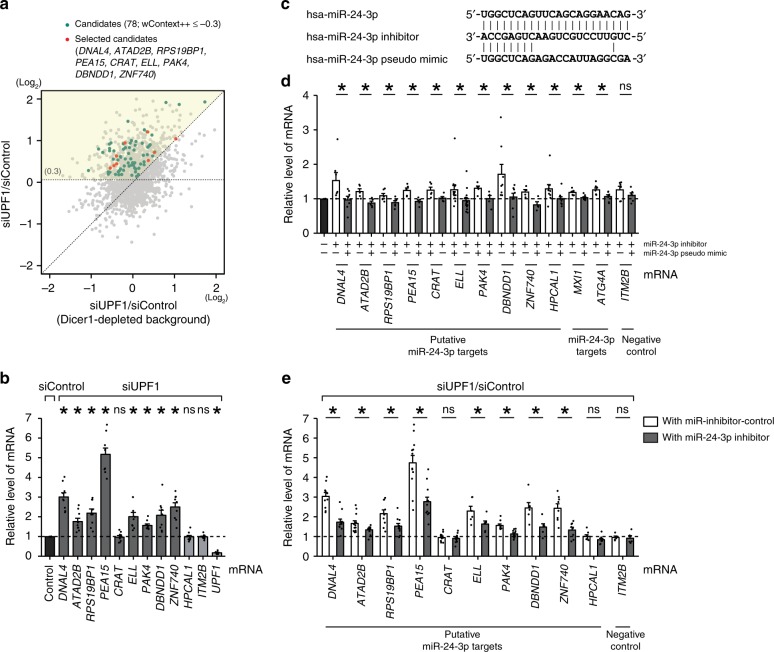
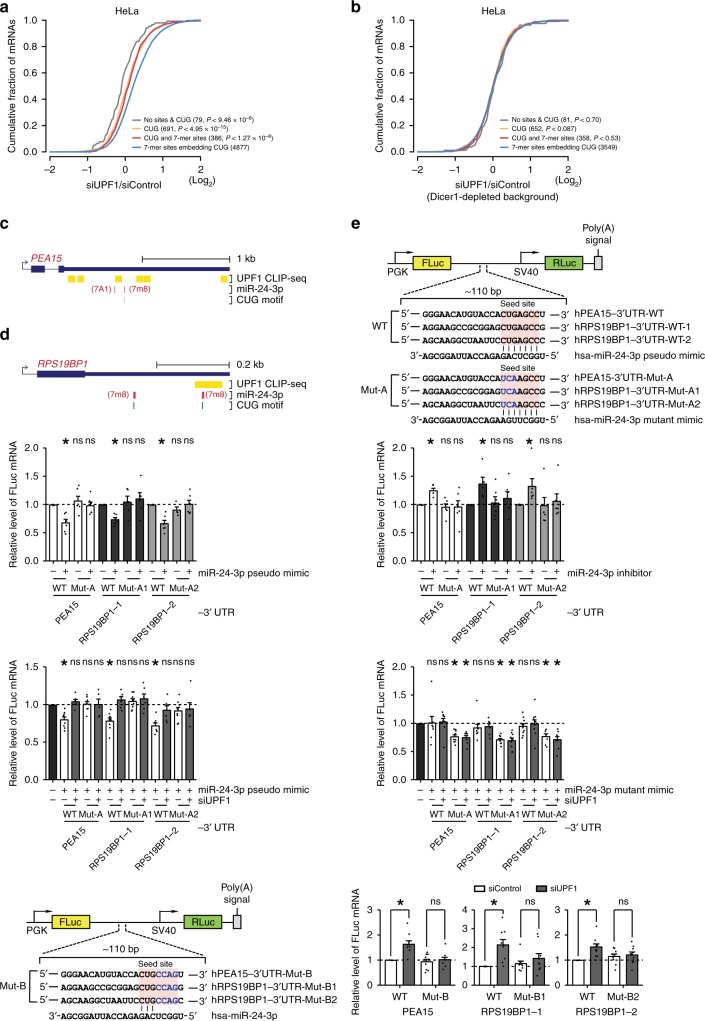
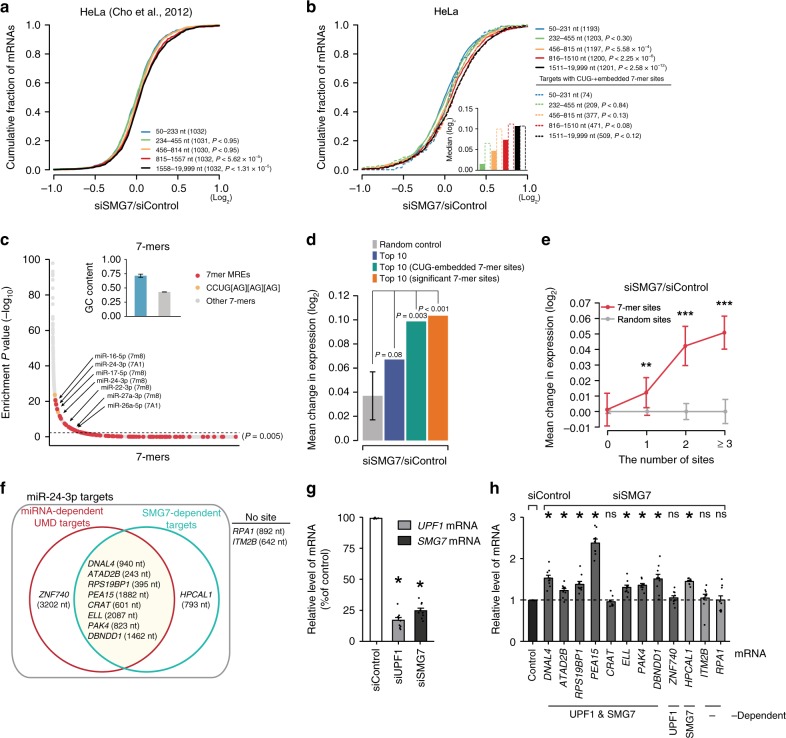
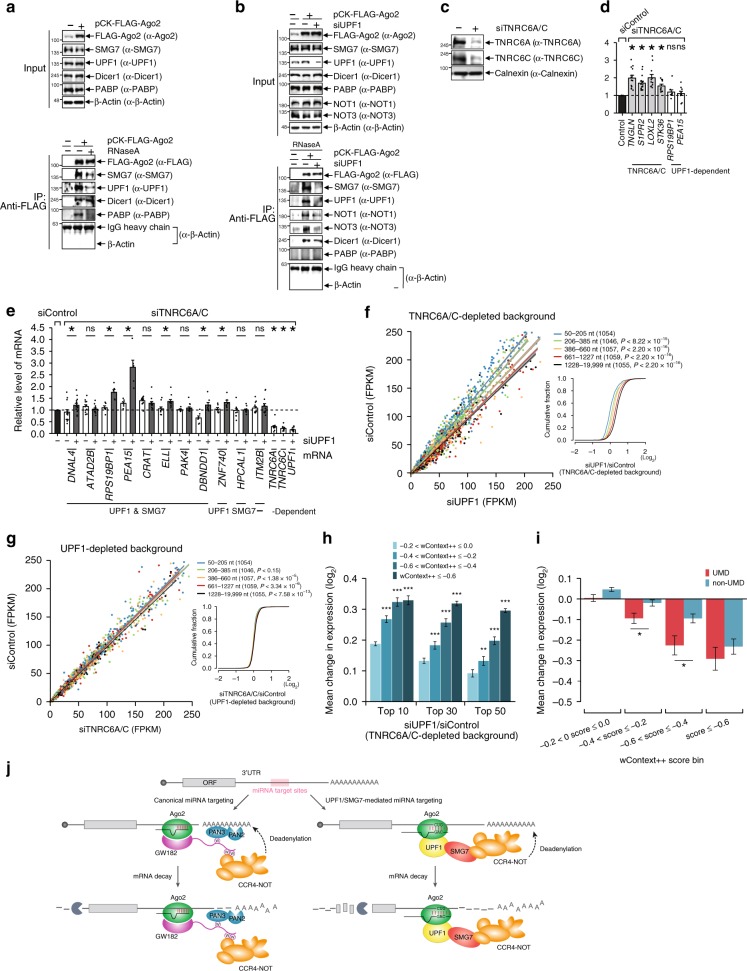
The stability and quality of metazoan mRNAs are under microRNA (miRNA)-mediated and nonsense-mediated control. Although UPF1, a core mediator of nonsense-mediated mRNA decay (NMD), mediates the decay of target mRNA in a 3'UTR-length-dependent manner, the detailed mechanism remains unclear. Here, we suggest that 3'UTR-length-dependent mRNA decay is not mediated by nonsense mRNAs but rather by miRNAs that downregulate target mRNAs via Ago-associated UPF1/SMG7. Global analyses of mRNAs in response to UPF1 RNA interference in miRNA-deficient cells reveal that 3'UTR-length-dependent mRNA decay by UPF1 requires canonical miRNA targeting. The destabilization of miRNA targets is accomplished by the combination of Ago2 and UPF1/SMG7, which may recruit the CCR4-NOT deadenylase complex. Indeed, loss of the SMG7-deadenylase complex interaction increases the levels of transcripts regulated by UPF1-SMG7. This UPF1/SMG7-dependent miRNA-mediated mRNA decay pathway may enable miRNA targeting to become more predictable and expand the miRNA-mRNA regulatory network.


Conflict of interest statement

The authors declare no competing interests.

Figures

Fig. 1
Fig. 1
UPF1-responded genes. a Shown is the schematic flow for selecting dEJ-free genes, comprising four filtering steps (see “dEJ-free genes” in the Methods section for additional details). The top slash-delimited numbers indicate the RefSeq genes for humans (hg19) and mice (mm9). The following slash-delimited numbers indicate genes remaining from each indicated step, and the numbers in boxes indicate genes excluded at each indicated step. From the third step, only expressed genes were considered by quantifying their expression values (FPMs and FPKMs) with mES RNA-seq data, with HeLa RNA-seq data and our experiment (parenthesis), in order. Red stop sign, stop codon in potential NMD targets; paired thick blue line, RNA-seq-supported exon junction read; dotted line, potential exon junction; dotted box, exon exclusion; dark-gray solid box, exon inclusion. bd Cumulative fractions of log2 changes in the expression of genes in siUPF1-treated cells against siControl-treated cells are shown as cumulative distribution function (CDF) graphs of Hurt et al.’s mES cell data (b), Wang et al.’s HeLa cell data (c), and our HeLa cell data (d). The numbers in parentheses are dEJ-free genes without off-target sites of siRNAs belonging to each 3′UTR length bin. The P values were estimated by the Kolmogorov–Smirnov (K–S) test
Fig. 2
Fig. 2
Co-occurrence of the CUG motif and MREs in UMD targets. a Analysis of all possible 7-mers enriched in the 3′UTR of UMD targets. 7-mer MREs of the 50 most abundant miRNA families (red dot), eight CCUG[AG][AG][AG] motifs (orange dot), and other 7-mers (gray dot) are shown with enrichment P values (nominal). The black dotted line is a threshold for significant enrichment (nominal P value < 0.005). The indicated 7-mer MREs are the sites of the 10 most abundant miRNA families. The site in the parentheses indicates the type of miRNA 7-mer sites. The inset bar graphs show the GC contents of other significant 7-mers (cyan box; more significant 7-mers than the 7-mer site for miR-16-5p) and less or nonsignificant others (gray box; less significant 7-mers than the 7-mer site for miR-16-5p). The error bars indicate the standard errors of the mean (s.e.m.) of the GC contents. b The counts of CUG motifs within a ±5-nt window of a thousand 7-mer MREs in the 3′UTRs of UMD targets (red) were compared to those within the ±5-nt window of a thousand 7-mer MREs in the 3′UTRs of non-UMD targets (cyan) and those within the ±5-nt window of a thousand 7-mer random sites in the 3′UTR of UMD targets (gray). Asterisks denote the statistical significance of the differences (***P< 2.20 × 10−16). c The signal-to-noise ratios of 3-mers from sequences reverse complementary to annotated human miRNAs (x-axis) and from the 3′UTR of UMD targets (y-axis) are shown in an xy plot. The dashed line is fitted to the data with Pearson’s correlation coefficient (r = 0.71). d The proportion of the 50 most abundant miRNA families (in HeLa) and their dinucleotide-shuffled random sequences (100 cohorts) and all human miRNA families and their dinucleotide-shuffled random sequences (100 cohorts) that embed CAG pairing to their 7-mer sites. The error bars indicate the s.e.m. of the proportions for random miRNAs. e Of the 50 most abundant miRNA families, 12 embedded CAG motifs in their seed regions (pink box). Sites are the number of miRNA 7-mer sites in the 3′UTRs of UMD targets
Fig. 3
Fig. 3
UMD regulation requires miRNAs. a The mean changes in expression (log2 scale) of dEJ-free mRNAs embedding 7-mer target sites of random controls (gray), the 10 (blue), 30 (purple), and 50 (red) most abundant miRNA families under siUPF1-treated conditions are shown. The P value was calculated by comparing the mean change in the expression of the targets to those in the 1000 random control cohorts (see “Generation of random controls and statistical tests”) using a one sample t test. The same analyses were performed for our data (left), Wang et al. 2014’s data (middle), and Hurt et al.’s data (right). The error bars indicate the s.e.m. in the changes for the targets. b HeLa cells were transfected with siUPF1, siDicer1, or both siUPF1 and siDicer1. The downregulation of endogenous UPF1 and/or Dicer1 was confirmed by western blotting. Calnexin served as a loading control. c CDF graphs of changes in the expression of dEJ-free mRNAs between siUPF-treated and siControl-treated cells under Dicer1-depleted conditions are shown across different 3′UTR length bins. Otherwise, as in Fig. 1b–d. d Mean changes in the expression of dEJ-free mRNAs with 7-mer target sites between siUPF-treated and siControl-treated cells under Dicer1-depleted conditions. Otherwise, as in a. e Mean numbers of 7-mer miRNA target sites in the 3′UTRs of dEJ-free mRNAs are shown across different 3′UTR length bins. The sites were detected in the major 3′UTR isoform, as evident by our previous 3P-seq data profiled from HeLa (green) and mES (orange) cells. f Mean changes in expression of dEJ-free mRNAs in siUPF1-treated cells against siControl-treated cells are shown across the different 7-mer site numbers of the ten most abundant miRNA families (red) and different random 7-mer sites (gray). Asterisks denote groups whose number of sites is significantly different from that of the controls (***P< 0.001; K–S test). g Mean changes in expression between dEJ-free mRNAs of siUPF-treated and siControl-treated cells under Dicer1-depleted conditions are shown for the different 7-mer site numbers. Otherwise, as in f
Fig. 4
Fig. 4
Experimental validation of miRNA-dependent UMD targets. a Comparisons of changes in the expression (log2 scale) of mRNAs with 7-mer sites in response to UPF1 depletion in siDicer1-treated and WT backgrounds. The yellow-shaded area indicates miRNA-dependent UMD targets. Candidates with a wContext + + score of less than −0.3 were selected (green, red dots), nine of which were chosen for experimental validation (red dot). b The increased level of the selected candidates obtained from a was confirmed by RT-qPCR. The level of mRNA was normalized to that of GAPDH mRNA. c Sequences of human miR-24-3p, the miR-24-3p antisense inhibitor, and the miR-24-3p pseudo-mimic used in this study, where the sequence of the pseudo-mimic was identical to that of the miR-24-3p seed sequence but with different sequences beginning at the ninth nucleotide. A pseudo-mimic was used because pseudo-mimics can form base pairs with the 7-mer sites of targets but avoid inhibition by miRNA inhibitors. d HeLa cells were transfected with the inhibitor and/or pseudo-mimic, and RT-qPCR was performed to quantify the level of putative and known miR-24-3p targets. ITM2B mRNA, which does not contain any miRNA-binding sites, served as a negative control. The level of mRNA was normalized to that of GAPDH mRNA. e HeLa cells transfected with siUPF1 or siControl under miR-24-3p-depleted or control conditions. RT-qPCR was performed to quantify the level of transcripts. Mean values and s.e.m. were calculated from independent experiments. An asterisk denotes statistically significant differences (*P< 0.05; unpaired Student’s t test); ns not significant. The minimum number of independent biological replicate experiments was b n = 9, d n ≥ 4, and e n ≥ 5
Fig. 5
Fig. 5
miRNA-dependent UMD is activated via CUG motifs. a, b CDF graphs of changes in the expression of UMD target mRNAs, including CUG alone in the 3′UTR (orange), both CUG and 7-mer sites not overlapping with each other within the ±15 nt window (red), and CUG-embedded 7-mer sites (blue), were compared to those embedding neither 7-mer sites nor the CUG in 3′UTRs (gray) in siUPF1-treated versus siControl-treated HeLa cells (a) and siUPF1-treated versus siControl-treated HeLa cells under Dicer1-depleted conditions (b). Otherwise, as in Fig. 1b–d. c, d (3′UTRs of PEA15 (c) and RPS19BP1 (d) that include UPF1-binding sites, miR-24-3p 7-mer sites, and CUG motifs. e Schematic representation of bicistronic Firefly(FLuc)/Renilla(RLuc) luciferase plasmid (reporter constructs) containing the putative miR-24-3p-binding sequence (red box, seed site) from PEA15 or RPS19BP1 3’UTR. The CUG motif (black bold) in the seed site was mutated to UCA (blue bold). The hsa-miR-24-3p mutant mimic sequence has a complementary sequence to the mutated sequence in the seed region. fi HeLa cells were cotransfected with reporter constructs and the miR-24-3p pseudo-mimic (f), miR-24-3p inhibitor (g), miR-24-3p pseudo-mimic and siUPF1 (h), miR-24-3p mutant mimic and siUPF1 (i), and siUPF1 (j). Control siRNA was transfected rather than siUPF1 as a control in h and i. RT-qPCR was performed to measure the relative amount of FLuc mRNA. Mean values and s.e.m. were calculated from independent experiments. (*P< 0.05; unpaired Student’s t test); ns not significant. The minimum number of independent biological replicate experiments was f n ≥ 4, g, h n ≥ 5, i n ≥ 7, and j n = 9
Fig. 6
Fig. 6
Subset of miRNA-dependent UMD targets depends on SMG7. a CDFs for changes in the expression of dEJ-free mRNAs in microarray data prepared from siSMG7-treated and siControl-treated cells are shown. Otherwise, as in Fig. 1b–d. b as in (a), CDF graphs of changes in the expression of dEJ-free mRNAs (solid lines) and targets with CUG-embedded 7-mer sites of the 50 most abundant miRNA families (dotted lines) in siSMG7-treated and siControl-treated cells. Median expression fold-changes are depicted by box plots (inset). Blank boxes with a dotted line denote the median fold-changes of targets with CUG-embedded 7-mer sites. c Analysis of all possible 7-mers enriched in the 3′UTR of SMG7-dependent mRNAs. Otherwise, as in Fig. 2a. d Mean changes in expression of a random control (gray), dEJ-free mRNAs with 7-mer sites (blue), targets with CUG-embedded 7-mer sites (green), or targets with significant 7-mer sites (orange) of the ten most abundant miRNA families in siSMG7-treated versus siControl-treated cells. Otherwise, as in Fig. 3a. e Mean changes in expression of dEJ-free mRNAs in SMG7-knockdown versus control cells are shown over different numbers of miRNA sites (red) or random sites. Asterisks denote statistically significant differences (**P< 0.01; ***P< 0.001; K–S test). Otherwise, as in Fig. 3f. f Venn diagram of nine selected miRNA-dependent UMD target candidates in Fig. 4a and nine SMG7-dependent targets. The values in parentheses are the lengths of the 3′UTR in each transcript. “No site” indicates that the mRNAs did not contain any putative miRNA sites of the 50 most abundant miRNAs. g Endogenous UPF1 and SMG7 in HeLa cells were depleted by siRNA-mediated downregulation. RT-qPCR was performed to examine the efficiency of downregulation. The level of mRNA was normalized to that of GAPDH mRNA. h As in g; however, the levels of transcripts listed in f were examined by RT-qPCR. Mean values and s.e.m. were calculated from independent experiments. (*P< 0.05; unpaired Student’s t test); ns not significant. The minimum number of independent biological replicate experiments was n = 9 in g, h
Fig. 7
Fig. 7
Alternative miRNA-mediated regulation through the UPF1-SMG7 complex. a The lysates of HeLa cells that were transiently transfected with pCK-FLAG-Ago2 or empty vector were subjected to IP using anti-FLAG antibodies in the presence (+) or absence (−) of RNaseA. Western blotting was performed to detect proteins in IP inputs and eluates. b Similar to a; however, HeLa cells were cotransfected with pCK-FLAG-Ago2 or an empty vector and siRNA specific for UPF1 or siControl. IP was performed in the presence of RNase A. c, d The downregulated level of TNRC6A/C was confirmed by western blotting (c). The relative levels of transcripts, which were UPF1-independent but TNRC6A/C-dependent (TNGLN, S1PR2, LOXL2, and STK36), were quantified by RT-qPCR (d). e Changes in the expression of mRNAs with respect to siUPF1 treatment are shown in the siTNRC6A/C background. Transcript levels were quantified by RT-qPCR. The level of mRNA was normalized to that of GAPDH mRNA. Mean values and s.e.m. were calculated from independent experiments. Asterisks denote statistically significant differences (*P< 0.05; unpaired Student’s t test); ns not significant. f, g Endogenous TNRC6A/C, UPF1 or both were depleted by siRNA transfection. Expression levels of dEJ-free mRNAs were compared between siControl and siUPF1-treated cells under TNRC6A/C-depleted conditions (f) and between siControl and siTNRC6A/C-treated cells under UPF1-depleted conditions (g). The cumulative fractions of the dEJ-free mRNAs are shown over the log2 fold-change compared to the initial values (f, g). Otherwise, as in Fig. 1b. h Mean changes in expression of dEJ-free mRNAs with 7-mer sites of the 10, 30, and 50 most abundant miRNA families in response to UPF1 depletion in the TNRC6A/C-depleted background are shown across different wContext + + score bins. Error bars are the s.e.m. of the changes in expression. i Mean changes in the expression of UMD (red) and non-UMD targets (blue) with miR-124 and miR-155 7-mer sites are shown over the different wContext + + bins. j Proposed miRNA-mediated UMD model and canonical miRNA-mediated gene silencing pathway. The minimum number of independent biological replicate experiments was n ≥ 9 in d and n ≥ 6 in e

Similar articles

Cited by

References

    1. Jackson RJ. Cytoplasmic regulation of mRNA function: the importance of the 3’ untranslated region. Cell. 1993;74:9–14. doi: 10.1016/0092-8674(93)90290-7. - DOI - PubMed
    1. Kuersten S, Goodwin EB. The power of the 3’ UTR: translational control and development. Nat. Rev. Genet. 2003;4:626–637. doi: 10.1038/nrg1125. - DOI - PubMed
    1. Zhang H, Lee JY, Tian B. Biased alternative polyadenylation in human tissues. Genome Biol. 2005;6:R100. doi: 10.1186/gb-2005-6-12-r100. - DOI - PMC - PubMed
    1. Sood P, Krek A, Zavolan M, Macino G, Rajewsky N. Cell-type-specific signatures of microRNAs on target mRNA expression. Proc. Natl Acad. Sci. USA. 2006;103:2746–2751. doi: 10.1073/pnas.0511045103. - DOI - PMC - PubMed
    1. Wang ET, et al. Alternative isoform regulation in human tissue transcriptomes. Nature. 2008;456:470–476. doi: 10.1038/nature07509. - DOI - PMC - PubMed

Publication types

MeSH terms