. 2019 Sep 13;10(1):4176.
doi: 10.1038/s41467-019-12094-9.

Selective autophagy maintains centrosome integrity and accurate mitosis by turnover of centriolar satellites

Affiliations

Selective autophagy maintains centrosome integrity and accurate mitosis by turnover of centriolar satellites

Søs Grønbæk Holdgaard et al. Nat Commun. .

Abstract

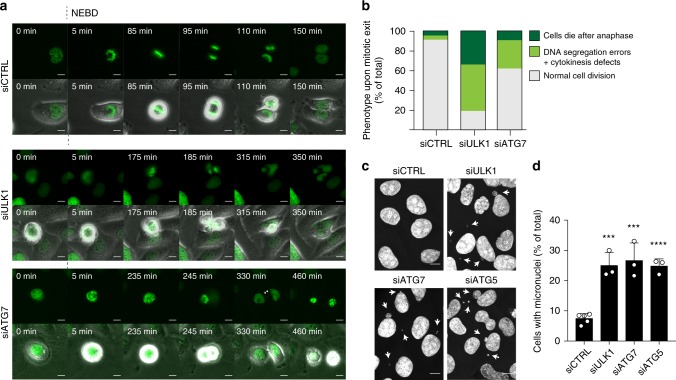
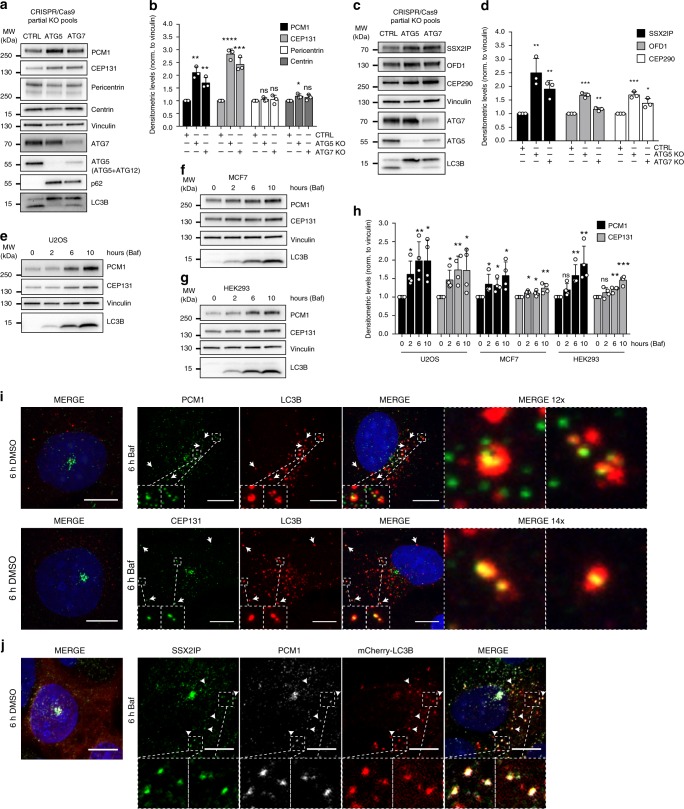
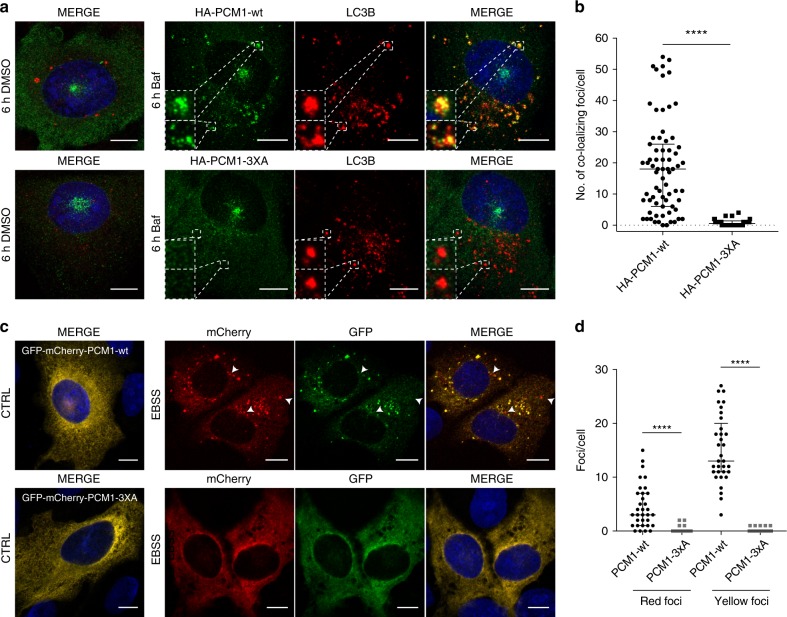
The centrosome is the master orchestrator of mitotic spindle formation and chromosome segregation in animal cells. Centrosome abnormalities are frequently observed in cancer, but little is known of their origin and about pathways affecting centrosome homeostasis. Here we show that autophagy preserves centrosome organization and stability through selective turnover of centriolar satellite components, a process we termed doryphagy. Autophagy targets the satellite organizer PCM1 by interacting with GABARAPs via a C-terminal LIR motif. Accordingly, autophagy deficiency results in accumulation of large abnormal centriolar satellites and a resultant dysregulation of centrosome composition. These alterations have critical impact on centrosome stability and lead to mitotic centrosome fragmentation and unbalanced chromosome segregation. Our findings identify doryphagy as an important centrosome-regulating pathway and bring mechanistic insights to the link between autophagy dysfunction and chromosomal instability. In addition, we highlight the vital role of centriolar satellites in maintaining centrosome integrity.


Conflict of interest statement

The authors declare no competing interests.

Figures

Fig. 1
Fig. 1
Depletion of key autophagy factors results in mitotic centrosome fragmentation. a Abnormal mitoses in U2OS cells treated with control, ULK1 or ATG7 siRNA stained for γ-tubulin, β-tubulin, and Hoechst33342. b Time-lapse imaging of stable U2OS mRFP-α-tubulin H2B-GFP cells treated with control or ATG7 siRNA. Images were acquired every 5 min for 10 h. Time after NEBD is indicated. c Quantification of experiments represented in (b) and Supplementary Fig. 1B. Time in mitosis was measured from NEBD to anaphase or until the end of the experiment. Results are pooled from three independent experiments. siSCR, n = 89; siULK1, n = 108; siATG7, n = 119. Bars represent medians and interquartile range. *P ≤ 0.05, ****P ≤ 0.0001. Two-tailed Mann–Whitney test. d Examples of phenotype categories; bipolar, multipolar and diffuse bipolar spindles. U2OS cells are stained for γ-tubulin, β-tubulin, and Hoechst33342. e Quantification of phenotype distribution in (d). Columns represent the mean ± SD, n = 3 of ≥20 cells, ns P > 0.05, **P ≤ 0.01, ***P ≤ 0.001. Unpaired Student’s t-test, two-tailed. f Multipolar mitoses in U2OS cells depleted of ULK1 or ATG7 analyzed by β-tubulin, centrin, and Hoechst33342 staining. Numbers refer to phenotype categories in (g). White arrow, spindle pole with two centrioles; green arrow, spindle pole without centrin (PCM fragmentation); red arrow, spindle pole with abnormal centrin g. Quantification of (f). Columns represent phenotype distribution of 3 pooled experiments. siSCR, n = 7; ULK1, n = 36; ATG7 n = 37. Scale bars, 10 µm. Source data are provided as a Source Data file
Fig. 2
Fig. 2
Autophagy deficiency leads to chromosome segregation defects and postmitotic cell death. a Time-lapse imaging experiments of stable U2OS mRFP-α-tubulin H2B-GFP cells transfected with control, ULK1 or ATG7 siRNAs. GFP and DIC channels were recorded. Time-points after NEBD are indicated. b Quantification of phenotype distribution shown in (a). SCR, n = 169; ULK1, n = 47; ATG7 n = 179. c Representative immunofluorescence images of Hoechst33342-stained U2OS cells treated with control, ULK1, ATG7 or ATG5 siRNA for micronuclei quantification. Arrows indicate micronuclei. d Quantification of experiments shown in (c). Columns represent the mean ± SD, n = 3 ≥ 100 cells, **P ≤ 0.01, ***P ≤ 0.001. Unpaired Student’s t-test, two-tailed. Scale bars, 10 µm. Source data are provided as a Source Data file
Fig. 3
Fig. 3
Interphase centrosomes display compositional changes and accumulation of abnormal CS upon autophagy deficiency. a U2OS cells transfected with control, ULK1, ATG7 or ATG5 siRNAs, stained for Pericentrin and Hoechst33342. b, c Quantification of (a). Columns represent mean fluorescence intensity (b) or mean centrosome area (c) ±SD, n = 3 of >60 cells. *P ≤ 0.05, **P ≤ 0.01, ****P ≤ 0.0001. Unpaired Student’s t-test, two-tailed. d Centrin distribution related to NEDD1-stained centrosomes in U2OS cells treated with control, ULK1 or ATG7 siRNAs. Arrows indicate examples of extra-centrosomal centrin foci. e Quantification of (d). Columns represent the mean frequency of acentrosomal centrin foci ±SD, n = 3 of > 100 cells. *P ≤ 0.05. Unpaired Student’s t-test, two-tailed. f Colocalization between centrin and PCM1 in U2OS cells transfected with control or ATG7 siRNAs. g PCM1 distribution in U2OS cells treated with control, ULK1 or ATG7 siRNAs. Arrows indicate string-like PCM1. h String-like distribution of PCM1 in ATG7-depleted cells. i Quantification of integrated density of experiments represented in (g). Columns represent the mean ± SD, n = 3 of >50 cells. *P ≤ 0.05, **P ≤ 0.01. Unpaired Student’s t-test, two-tailed. j Quantification of CS characteristics of experiments represented in (g). Columns represent the mean ± SD, n = 3 of >50 cells. ns P > 0.05, *P ≤ 0.05, **P ≤ 0.01, ***P ≤ 0.001. Unpaired Student’s t-test, two-tailed. Scale bars, 10 µm. Source data are provided as a Source Data file
Fig. 4
Fig. 4
Centriolar satellite components interact with GABARAPs but not LC3B. ac Scatter plots showing enrichment values (x-axis) and corresponding significance levels (y-axis) for proteins co-purifying with GFP-tagged GABARAP, GABARAPL2 or LC3B, n = 4. Centrosomal proteins are indicated in green, horizontal line indicates significance with threshold P-value < 0.05. d Heat map representing abundance of centrosomal proteins across co-IPs from A-C with p < 0.05 for at least one bait. Data are bait normalized to correct for differences in expression levels of bait proteins. e GFP-precipitation of lysates from inducible GFP-3xFLAG or GFP-tagged LC3B, GABARAP or GABARAPL2 MCF7 cells analyzed for co-precipitation of endogenous CEP131 and PCM1, n = 3. f GFP precipitation of GFP-3xFLAG, GFP-GABARAP or GFP-GABARAPL2 in U2OS cells treated with control, PCM1 or CEP131 siRNAs and blotted for co-precipitation of endogenous PCM1 and CEP131, n = 3. g GFP-precipitation of HEK293 lysates following co-transfection of GFP-3xFLAG or GFP-tagged GABARAP or GABARAPL2 with HA-PCM1-wt or HA-PCM1-3XA analyzed for co-precipitation of HA-tagged PCM1 variants, n = 3. h GFP-precipitation of GFP-3xFLAG or GFP-tagged LC3B, GABARAP or GABARAPL2 in HEK293 cells analyzed for co-precipitation of endogenous SSX2IP, OFD1 and CEP290, n = 3
Fig. 5
Fig. 5
Structural analysis of GABARAP-PCM1 peptide complex. a Density plot for the conformations of PCM1 LIR in the GABARAP binding pocket, sampled during simulations starting from the bent (in yellow) and extended (in orange) conformations. The plot illustrates the similarity of the PCM1 LIR (light blue cartoon) conformations (measured as all-atom RMSD) with respect to each of the two initial structures for the simulations in complex with GABARAP (i.e., the bent and the extended conformation in yellow and orange cartoons, respectively). Starting from different conformations, the simulations of the PCM1 LIR into the GABARAP pocket converge on a similar ensemble of bent structures. b The common ensemble of bent structures of the PCM1 LIR peptide and ten representative conformations were isolated and are shown as a light blue cartoon. As a comparison, ten structures of the PCM1 LIR peptide from the simulations in complex with LC3B were reported and are indicated as dark blue cartoon. c Pairwise intermolecular contacts between residues of GABARAP and PCM1 LIR peptide were estimated in the selected ensemble. Contacts are represented as red cylinders connecting the Cα atoms of the pair of residues involved in the interaction. The radius of each cylinder is proportional to the occurrence of the contact, e.g. a contact presents in all structures of the selected ensemble has a radius of 0.5 Å. We here report the most important residues of GABARAP (yellow cartoon, E8, H9, K20, K46, K47, K48, and Y25) for the interaction between the 1959-DEED-1962 and K1965 of PCM1-LIR (light blue cartoon). The residues selected for experimental mutagenesis are circled and their Cα atoms are shown as spheres. d GFP-precipitation of GFP-3xFLAG or GFP-tagged GABARAP-wt or the indicated mutants in HEK293 cells analyzed for co-precipitation of endogenous PCM1, n = 2. e GST pull-down of GST, GST-GABARAP-wt or the indicated mutant analyzed for co-precipitation of endogenous PCM1, in HEK293 cells, n = 2. f GST pull-down of GST, GST-LC3B-wt or the indicated mutants analyzed for co-precipitation of endogenous PCM1, in HEK293 cells, n = 2
Fig. 6
Fig. 6
The CS are autophagy substrates. a MCF7 cell extracts of stable CRISPR/Cas9 non-targeting control (CTRL), ATG5- or ATG7-transfected partial knock-out pools immunoblotted for CS and centrosome proteins. Vinculin is used as loading control. b Densitometric quantification of CS and centrosome protein levels relative to vinculin, represented in (a). Columns represent the mean ± SD, n = 3, ns P > 0.05 *P ≤ 0.05, **P ≤ 0.01, ***P ≤ 0.001, ****P ≤ 0.0001. Unpaired Student’s t-test, two-tailed. c Stable CRISPR/Cas9 non-targeting control (CTRL), ATG5- or ATG7 partial knock-out MCF7 pools immunoblotted for CS proteins. Vinculin is used as loading control. d Densitometric quantification of CS protein levels relative to vinculin, represented in (c). Columns represent the mean ± SD, n = 3, *P ≤ 0.05, **P ≤ 0.01, ***P ≤ 0.001. Unpaired Student’s t-test, two-tailed. eg Immunoblot of U2OS (e), MCF7 (f) or HEK293 (g) cells treated with Baf for the indicated times and immunoblotted for PCM1, CEP131, and vinculin as loading control. h Densitometric quantification of PCM1 and CEP131 immunoblots represented in (eg). Columns represent the mean ± SD, n = 4, ns P > 0.05, *P ≤ 0.05, **P ≤ 0.01, ***P ≤ 0.001. Unpaired Student’s t-test, two-tailed. i Colocalization of LC3B with PCM1 or CEP131 in U2OS cells after 6 h of Baf treatment. Arrows indicate examples of colocalization. j Colocalization between SSX2IP, PCM1, and mCherry-LC3B in U2OS cells treated for 6 h with 200 nM Baf. Arrows indicate examples of colocalization. Scale bars, 10 µm. Source data are provided as a Source Data file
Fig. 7
Fig. 7
The PCM1 LIR domain is required for its autophagosomal engulfment. a Colocalization of LC3B with HA-PCM1-wt or HA-PCM1-3XA constructs in U2OS cells treated for 6 h with 200 nM Baf and stained for HA, LC3B and Hoechst33342. b Quantification of (a). The number of co-localizing foci per cell were quantified, n = 3 of each >20 cells. Bars represent medians and interquartile range. ****P ≤ 0.0001. Two-tailed Mann–Whitney test. c Traffic-light-assay of GFP-mCherry-PCM1 or GFP-mCherry-PCM1-3XA in U2OS cells following 2 h of EBSS treatment showing formation of yellow and red foci for PCM1, the latter indicating lysosomal localization. Arrows indicate examples of red foci. d Quantification of (c). The number of yellow and red foci per cell were quantified, n = 3 of each ≥10 cells. Bars represent medians and interquartile range. ****P ≤ 0.0001. Two-tailed Mann–Whitney test. Scale bars, 10 µm. Source data are provided as a Source Data file
Fig. 8
Fig. 8
PCM1 accumulation and mitotic abnormalities show GABARAP selectivity. a Immunoblot of U2OS cell extracts following depletion of LC3B, GABARAP and GABARAPL2 individually or in combination as indicated showing levels of PCM1. GAPDH is used as loading control. b Densitometric quantification of PCM1 levels relative to GAPDH, represented in (a). Columns represent the mean ± SD, n = 3, ns > 0.05, **P ≤ 0.01, ***P ≤ 0.001. Unpaired Student’s t-test, two-tailed. c Representative images of PCM1-stained CS in U2OS cells depleted of the denoted ATG8 proteins. d Representative images of mitotic abnormalities in U2OS cells stained for γ-tubulin, β-tubulin and Hoechst33342 following depletion of the denoted ATG8 proteins. e Quantification of phenotype distribution in (d). Columns represent the mean ± SD, n = 3 of ≥20 cells, ns P > 0.05, **P ≤ 0.01. Unpaired Student’s t-test, two-tailed. Abnormal refers to cells exhibiting multipolar, diffuse bipolar or monopolar mitoses. Scale bars, 10 µm. Source data are provided as a Source Data file

Similar articles

Cited by

References

    1. Abada A, Elazar Z. Getting ready for building: signaling and autophagosome biogenesis. EMBO Rep. 2014;15:839–852. doi: 10.15252/embr.201439076. - DOI - PMC - PubMed
    1. Khaminets A, Behl C, Dikic I. Ubiquitin-dependent and independent signals in selective autophagy. Trends Cell Biol. 2016;26:6–16. doi: 10.1016/j.tcb.2015.08.010. - DOI - PubMed
    1. Levine B, Kroemer G. Autophagy in the pathogenesis of disease. Cell. 2008;132:27–42. doi: 10.1016/j.cell.2007.12.018. - DOI - PMC - PubMed
    1. Jiang P, Mizushima N. Autophagy and human diseases. Cell Res. 2014;24:69–79. doi: 10.1038/cr.2013.161. - DOI - PMC - PubMed
    1. Conduit PT, Wainman A, Raff JW. Centrosome function and assembly in animal cells. Nat. Rev. Mol. Cell Biol. 2015;16:611–624. doi: 10.1038/nrm4062. - DOI - PubMed

Publication types