. 2019 Sep 13;10(1):4162.
doi: 10.1038/s41467-019-12101-z.

The mutational landscape of a prion-like domain

Affiliations

The mutational landscape of a prion-like domain

Benedetta Bolognesi et al. Nat Commun. .

Abstract

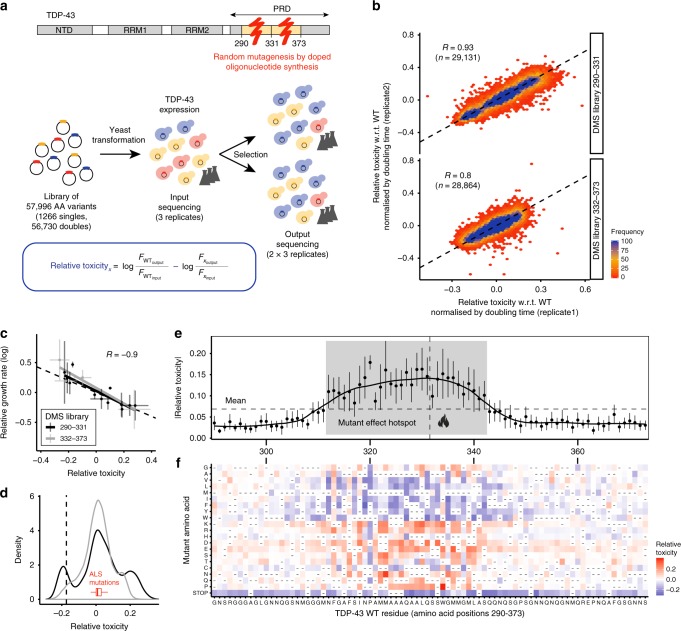
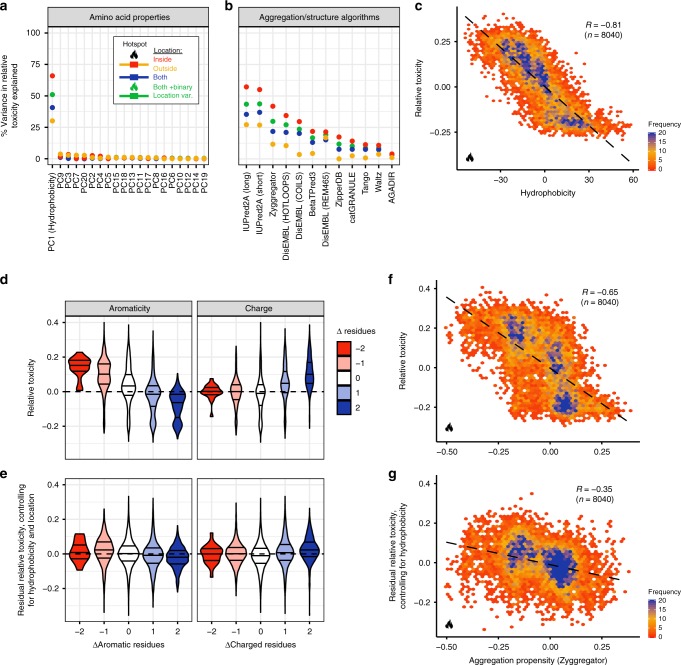
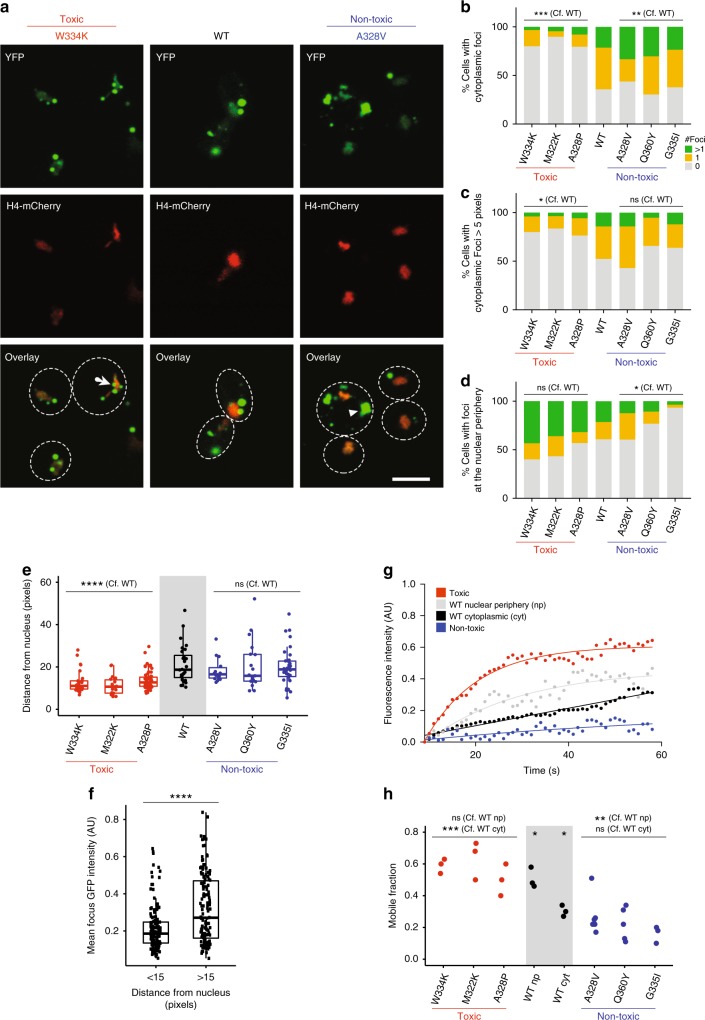
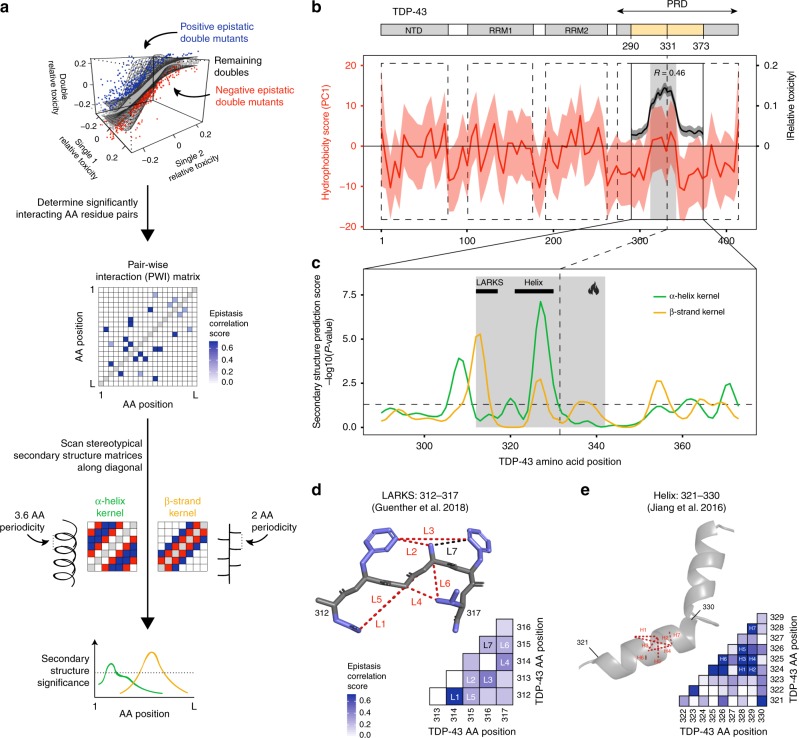
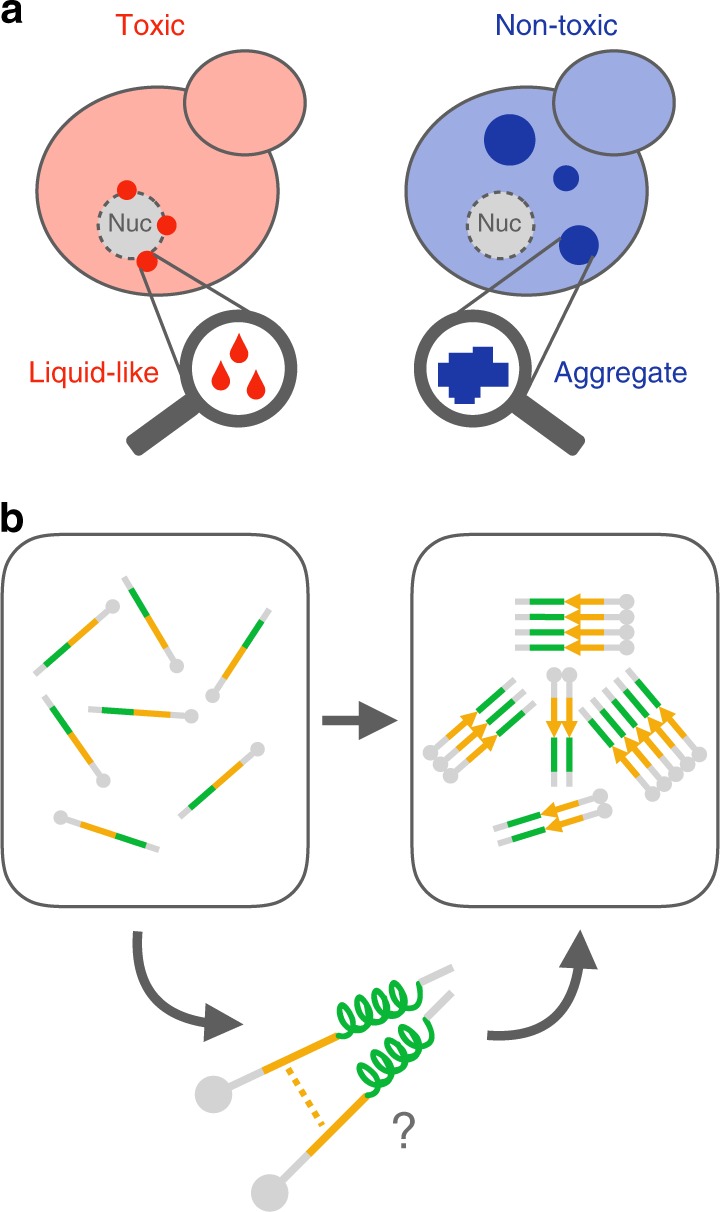
Insoluble protein aggregates are the hallmarks of many neurodegenerative diseases. For example, aggregates of TDP-43 occur in nearly all cases of amyotrophic lateral sclerosis (ALS). However, whether aggregates cause cellular toxicity is still not clear, even in simpler cellular systems. We reasoned that deep mutagenesis might be a powerful approach to disentangle the relationship between aggregation and toxicity. We generated >50,000 mutations in the prion-like domain (PRD) of TDP-43 and quantified their toxicity in yeast cells. Surprisingly, mutations that increase hydrophobicity and aggregation strongly decrease toxicity. In contrast, toxic variants promote the formation of dynamic liquid-like condensates. Mutations have their strongest effects in a hotspot that genetic interactions reveal to be structured in vivo, illustrating how mutagenesis can probe the in vivo structures of unstructured proteins. Our results show that aggregation of TDP-43 is not harmful but protects cells, most likely by titrating the protein away from a toxic liquid-like phase.


Conflict of interest statement

The authors declare no competing interests.

Figures

Fig. 1
Fig. 1
Deep mutational scanning (DMS) of the prion-like domain (PRD) of TDP-43. a Domain structure of TDP-43 and DMS experimental protocol: For each library, three independent selection experiments were performed. In each experiment one input culture was split into two cultures for selection upon induction of TDP-43 expression (6 outputs total). Relative toxicity of variants was calculated from changes of output to input frequencies relative to WT. b Correlation of toxicity estimates between replicates 1 and 2 for single and double amino acid (AA) mutants shown separately for each library (290–332; 332–373). The Pearson correlation coefficients (R) are indicated. Toxicity correlations between all replicates are shown in Supplementary Fig. 1d, e. c Comparison of toxicity from pooled selections and individually measured growth rates for selected variants. Vertical and horizontal error bars indicate 95% confidence intervals of mean growth rates and toxicity estimates respectively. Linear fits of the data are shown separately for each library and Pearson correlation (R) after pooling data from both libraries is indicated. d Toxicity distribution of single and double mutants, shown separately for each library (colour key as in panel (c)). WT variant has toxicity of zero, mean toxicity of variants with single STOP codon mutation is indicated by dashed vertical line. The red boxplot depicts the distribution of toxicity estimates for all human disease mutations (including sporadic and familial ALS mutations). Outliers are not depicted but are reported in Supplementary Fig. 2d, e. e Absolute toxicity of single mutants stratified by position. Error bars indicate 95% confidence intervals of mean (per-position) toxicity estimates. A local polynomial regression (loess) over toxicity estimates of all single mutants is shown. The vertical dashed line indicates the boundary between the two DMS libraries. The horizontal dashed line indicates the mean absolute toxicity of all single mutants. The mutant effect “hotspot” (mean per-position |toxicity| > mean |toxicity|) is highlighted in grey. f Heatmap showing single mutant toxicity estimates. The vertical axis indicates the identity of the substituted (mutant) AA. Heatmap cells of variants not present in the library are denoted by “-“
Fig. 2
Fig. 2
Changes in hydrophobicity are highly predictive of TDP-43 cellular toxicity. a Percentage variance of toxicity explained by linear regression models predicting single and double mutant variant toxicity from changes in AA properties upon mutation (PCs, principal components of a collection of AA physico-chemical properties). Different regression models were built for different subsets of the data. Simple linear regression models for all variants (blue) or only variants inside (red) or outside (yellow) the hotspot region. And a regression model using all variants and including a binary location variable (inside/outside hotspot) as well as an interaction term between binary location variable and the indicated AA property feature (green). b Percentage variance of toxicity explained by linear regression models predicting variant toxicity using scores from aggregation/structure algorithms (see Methods). Colour key shown in panel (a). See also Supplementary Fig. 4. c Toxicity of variants with single or double mutations within the hotspot region as a function of hydrophobicity changes (PC1) induced by mutation. The Pearson correlation (R) before binning is indicated. See also Supplementary Fig. 9a. d Toxicity distributions of single and double mutants stratified by the change in the number of aromatic (H,F,W,Y,V) or charged residues (R,D,E,K) relative to the WT sequence. Horizontal axis as in panel (e). e Distribution of residual toxicity after controlling for the effect of hydrophobicity and location on toxicity (green regression model in panel a) stratified by the number of aromatic (H,F,W,Y,V) or charged (R,D,E,K) AAs. f Single and double mutant variant toxicity as a function of changes in aggregation propensity (Zyggregator). Only variants occurring within the toxicity hotspot are depicted. The Pearson correlation (R) before binning is indicated. g Toxicity as a function of aggregation propensity after controlling for hydrophobicity (red regression model in panel a). Only variants occurring within the toxicity hotspot are depicted. The Pearson correlation (R) before binning is indicated. See also Supplementary Fig. 9b
Fig. 3
Fig. 3
Mutations leading to formation of solid-like aggregates rescue toxicity. a Representative fluorescence microscopy images of yeast cells expressing indicated YFP-tagged TDP-43 variants (W334K TDP-43 = toxic, A328V TDP-43 = non-toxic). H4-mCherry marks nuclei (red). Contrast was enhanced equally for the green and red channels in all images. b Percentage of cells with cytoplasmic foci (Cells scored: n[toxic] = 219, n[WT] = 30, n[non-toxic] = 213). Fisher’s Exact test. c Percentage of cells with cytoplasmic foci with size over 5 pixels automatically detected by CellProfiler. Fisher’s Exact test. (Cells scored: n[toxic] = 167, n[WT] = 23, n[non-toxic] = 167). d Percentage of cells with foci at the nuclear periphery (Cells scored: n[toxic] = 219, n[WT] = 30, n[non-toxic] = 213). Fisher’s exact test. e Distance of foci from nucleus center for toxic (red), non-toxic (blue), and WT (black) TDP-43. Boxplots represent median values, interquartile ranges and Tukey whiskers with individual data points superimposed. Kruskal Wallis with Dunn’s multiple comparisons test (n = >20 foci/variant). f Average fluorescence intensity of foci localized closer (<15 pixels, n=147) or further (>15 pixels, n = 138) from the nucleus. Boxplots represent median values, interquartile ranges and Tukey whiskers with individual data points superimposed. Mann–Whitney test. g Representative individual fluorescence recovery traces for variants reported in panel (e). Lines are the result of a single exponential fitting. h Mobile Fraction as calculated by fitting FRAP traces for toxic (red), non-toxic (blue) and WT (black) TDP-43. Each point results from fitting an individual trace. One-way ANOVA with Tukey’s multiple comparisons test. Images were taken on cells growing from at least 3 independent starting colonies. *P < 0.05, **P < 0.01, ***P < 0.001, ****P < 0.0001. Scale bar = 5 μM. Source data are provided as a Source Data file
Fig. 4
Fig. 4
Correlated patterns of epistasis predict secondary structural elements within the PRD of TDP-43. a Schematic representation of the computational strategy to identify in vivo secondary structures. Double mutant variants are classified as epistatic if they are more (95th percentile) or less (5th percentile) toxic than other variants with similar single mutant toxicities (top). A pair-wise interaction (PWI) matrix of epistasis correlation scores is then constructed by quantifying the similarity of a pair of positionsʼ interactions with all other mutated positions in the protein. The epistasis correlation scores along the diagonal of the PWI matrix are then tested for agreement with the stereotypical periodicity of α-helix and β-strand, using two-dimensional kernels (bottom), to calculate the likelihood of adjacent positions forming secondary structures. b Local polynomial regression (loess) of hydrophobicity (PC1) of the WT TDP-43 sequence with 95% confidence interval. For reference, smoothed toxicity estimates in the mutated positions within the PRD are shown. The Pearson correlation coefficient (R) between hydrophobicity and mean toxicity effects of single mutants at each position before smoothing is indicated. c Secondary structure predictions from epistasis correlation scores for α-helix and β-strand kernels based on the strategy described in panel a. Black bars annotate previously described structural features: LARKS, low-complexity aromatic-rich kinked segment (312–317); Helix (321–330). The dashed horizontal line indicates the nominal significance threshold P = 0.05. d Epistatic interactions in region 312–317 are consistent with positions of similar side-chain orientations interacting in a previously reported in vitro LARKS structure. Epistasis correlation matrix and top seven epistasis correlation score interactions annotated on the LARKS reference structure (monomer from PDB entry 5whn, https://www.rcsb.org/structure/5WHN). Dashed lines on structure connect interacting residues at minimal distance between side chain heavy atoms. Side chain atoms are depicted in blue. e Epistatic interactions in region 321–330 are consistent with positions of similar side-chain orientations interacting in an α-helix. Epistasis correlation matrix and top seven epistasis correlation score interactions annotated on the Helix reference structure (monomer from PDB entry 5whn, https://www.rcsb.org/structure/5WHN)
Fig. 5
Fig. 5
Model of how AA changes determine toxicity of TDP-43. a Mutations that promote formation of insoluble cytoplasmic aggregates decrease TDP-43 toxicity, while mutations that cause the protein to stall in a liquid de-mixed phase increase its toxicity to the cell. b Secondary structure elements, within the toxicity hotspot 312–342, promote the aggregation process of TDP-43, with a transient helix forming on pathway to β-rich aggregates

References

    1. Buratti, E. Functional Significance of TDP-43 Mutations in Disease. Adv. Genet. 91, 1–53 (2015). - PubMed
    1. Ling S-C, Polymenidou M, Cleveland DW. Converging mechanisms in ALS and FTD: disrupted RNA and protein homeostasis. Neuron. 2013;79:416–438. - PMC - PubMed
    1. Chiti F, Stefani M, Taddei N, Ramponi G, Dobson CM. Rationalization of the effects of mutations on peptide and protein aggregation rates. Nature. 2003;424:805–808. - PubMed
    1. Eisenberg D, Jucker M. The amyloid state of proteins in human diseases. Cell. 2012;148:1188–1203. - PMC - PubMed
    1. Chiti F, Dobson CM. Protein misfolding, functional amyloid, and human disease. Annu. Rev. Biochem. 2006;75:333–366. - PubMed

Publication types

MeSH terms