. 2019 Sep 13;10(1):4186.
doi: 10.1038/s41467-019-12160-2.

B cells sustain inflammation and predict response to immune checkpoint blockade in human melanoma

Affiliations

B cells sustain inflammation and predict response to immune checkpoint blockade in human melanoma

Johannes Griss et al. Nat Commun. .

Abstract

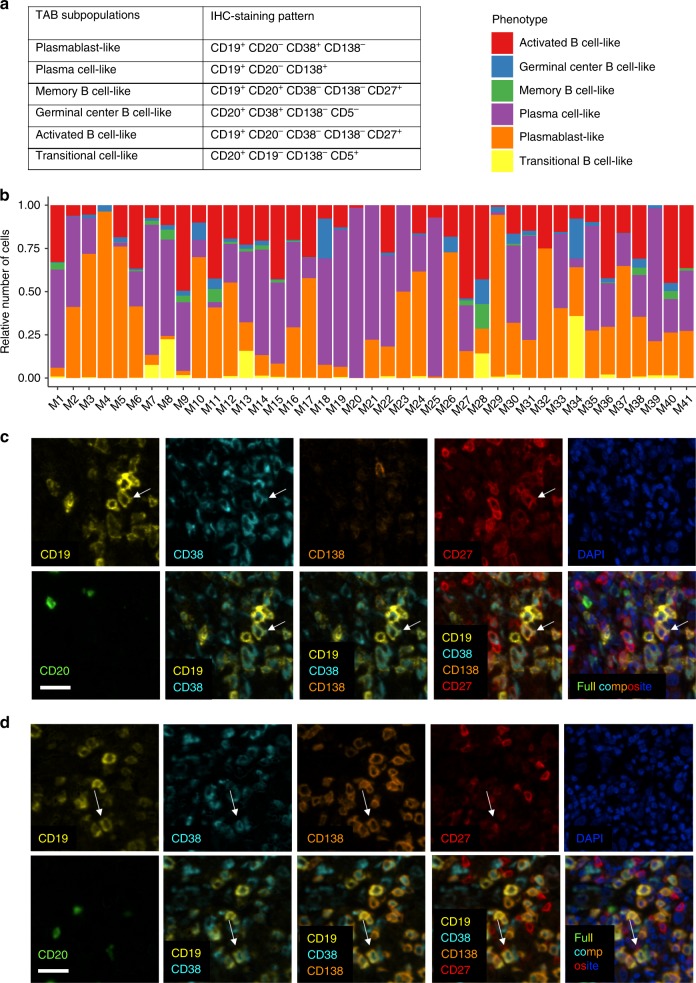
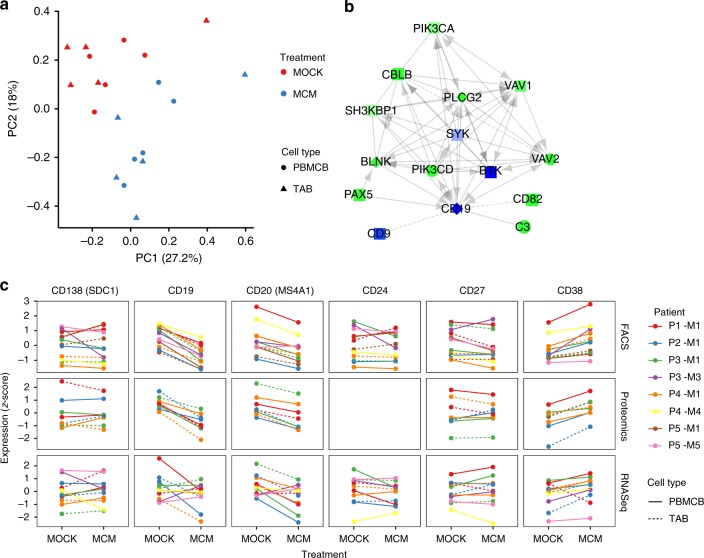
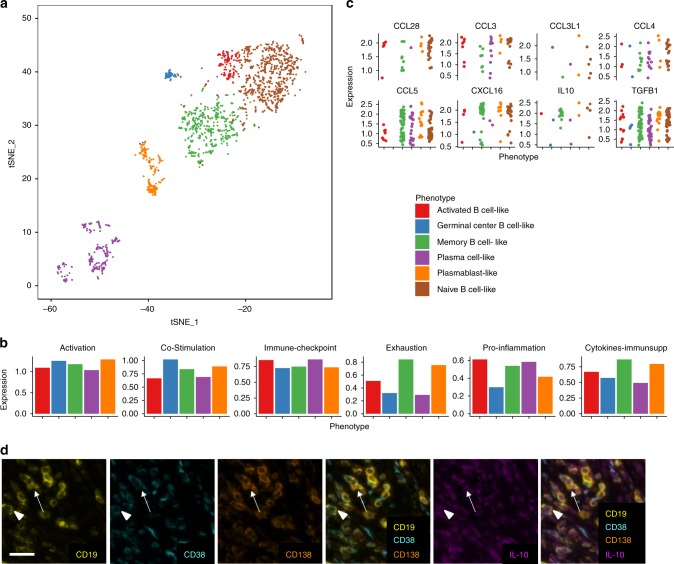
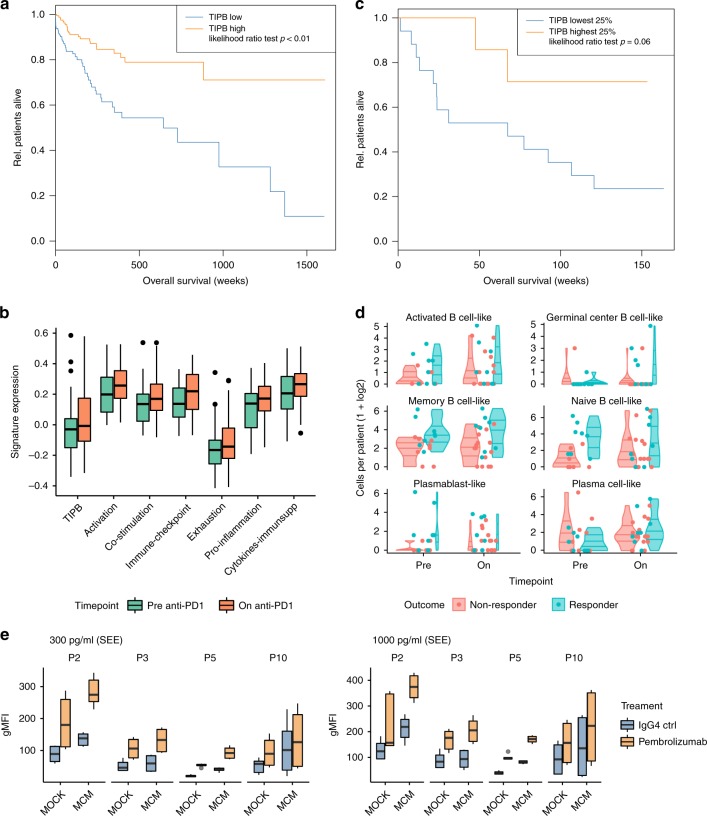
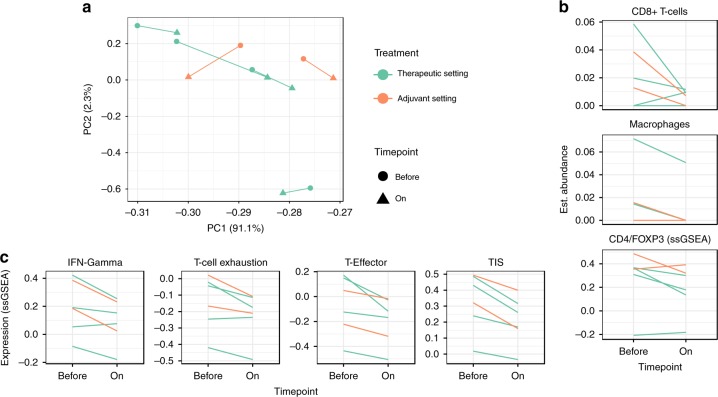
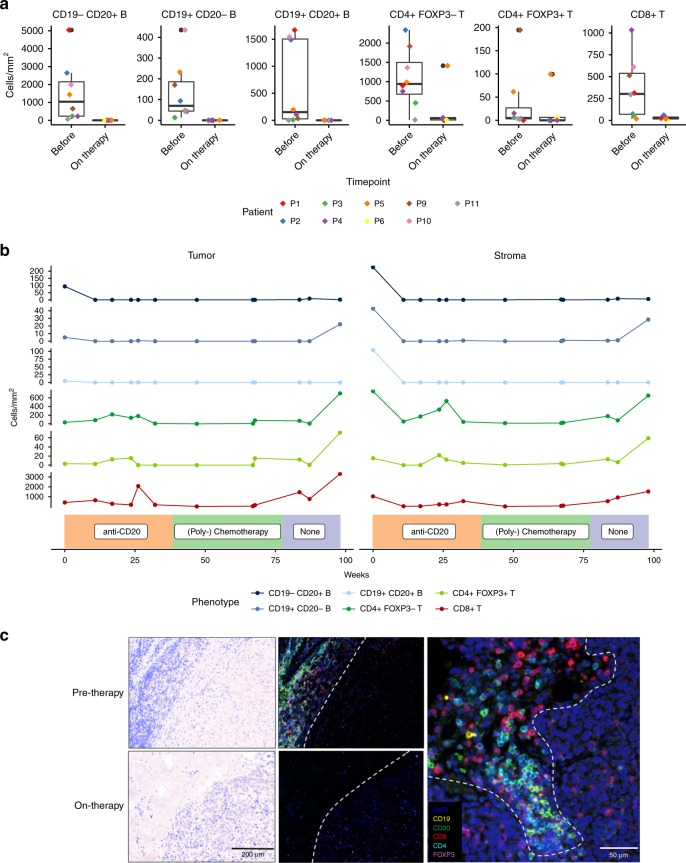
Tumor associated inflammation predicts response to immune checkpoint blockade in human melanoma. Current theories on regulation of inflammation center on anti-tumor T cell responses. Here we show that tumor associated B cells are vital to melanoma associated inflammation. Human B cells express pro- and anti-inflammatory factors and differentiate into plasmablast-like cells when exposed to autologous melanoma secretomes in vitro. This plasmablast-like phenotype can be reconciled in human melanomas where plasmablast-like cells also express T cell-recruiting chemokines CCL3, CCL4, CCL5. Depletion of B cells in melanoma patients by anti-CD20 immunotherapy decreases tumor associated inflammation and CD8+ T cell numbers. Plasmablast-like cells also increase PD-1+ T cell activation through anti-PD-1 blockade in vitro and their frequency in pretherapy melanomas predicts response and survival to immune checkpoint blockade. Tumor associated B cells therefore orchestrate and sustain melanoma inflammation and may represent a predictor for survival and response to immune checkpoint blockade therapy.


Conflict of interest statement

The authors declare no competing interests.

Figures

Fig. 1
Fig. 1
Melanoma TAB are enriched for plasmablast- and plasma cell-like phenotypes. a Marker combinations used to identify TAB subpopulations by seven-color multiplex immunostaining. b Relative frequency of different TAB phenotypes in whole tissue sections of 41 metastatic melanomas c, d Multiplex immunostaining identifies CD19+CD20CD38+CD138CD27+ plasmablast-like (c) TAB and CD19+CD20CD38+CD138+CD27+ plasma cell-like (d) TAB. Here, serial images display the same cells from a stromal area at the invasive tumor margin. A full composite image together with DAPI nuclear staining (bottom right) and images for each of the individual markers and different combinations from the composite image are shown. Arrow depicts one of several plasmablast-like (c) and plasma cell-like (d) TAB. Scale bars represent 20 µm
Fig. 2
Fig. 2
Melanoma secretomes induce distinct phenotypic changes in TAB. a Principal component analysis of all samples based on the proteomics data comparing samples treated with melanoma-conditioned medium (MCM, blue) against control treated ones (MOCK, red). Peripheral-blood-derived B cells (PBMCB, circles) and TAB (triangles) are shown separately. The percentage in the axis labels represents the variation explained by the component. Points represent one sample per patient and one sample where individual patient samples were pooled together. b Interaction network of CD19 with the nearest neighbors depicting the gene abundance estimated by RNA-seq and proteomics. Green represents upregulation, blue downregulation, light colors indicate no relevant difference. Diamonds are genes only detected in proteomics, rectangles genes only detected in RNA-seq, circles genes identified by both methods. For the actual data analysis, the network was constructed using the two nearest neighbors. c Expression of key differentiation markers estimated by FACS (geo mean fluoresence-based expression), proteomics, and RNA-seq for melanoma-conditioned medium (MCM) and control (MOCK) treated immortalized peripheral-blood-derived B cells (PBMCB, solid lines) and TAB (dashed lines). All values are shown as z-scores
Fig. 3
Fig. 3
Human melanoma scRNA-seq data verify observed functional phenotypes. a T-distributed stochastic neighbor embedding representation of all B cells with their respective phenotype annotations from the Sade-Feldman et al. dataset. b ssGSEA estimated expression of the functional signatures based on the average gene expression per B cell phenotype. c Expression of specific chemokines and immunosuppressive cytokines per B cell phenotype and individual cell. d Confirmation of IL-10 expression in plasma cell-like (arrow) and plasmablast-like (arrowhead) TAB by quadruple marker immunostaining. Scale bar represents 20 µm
Fig. 4
Fig. 4
TIPB predict improved survival of melanoma patients. a Survival analysis of patients expressing high (orange line) or low levels (blue line) of the TIPB signature separated by the median expression in the TCGA melanoma cohort. b Expression of the TIPB signature and all functional signatures before (green boxes) and on (orange boxes) anti-PD-1 therapy as estimated in the Riaz et al. dataset. c Survival analysis based on the TIPB signature in the pre-treatment samples comparing top 25% expressing samples (organe line) against the lower 25% samples (blue line) in the Riaz et al. dataset. d Frequencies of B cell phenotypes (logarithmic scale) before (red) and on (blue) ICB therapy in the scRNA-seq dataset from Sade-Feldman et al. separated by response. Plots represent the relative frequencies, lines represent the 25%, 50%, and 75% quantiles. e NF-ĸB activity of PD-1-expressing Jurkat T cells co-cultured with control (MOCK) and MCM-conditioned B cells (MCM). Values are shown for control (blue boxes) and Pembrolizumab (orange boxes) treatment. Activation was measured by geo mean fluorescence intensity (gMFI) after stimulation with 300 pg/ml (left panel) and 1 ng/ml (right panel) Staphylococcus Enterotoxin E (SEE). In all boxplots, lower and upper hinges correspond to the first and third quartiles, center line to the median. Upper whisker extends from the hinge to the largest value no further than 1.5 times the interquartile range
Fig. 5
Fig. 5
Depletion of TIPB reduces tumor inflammation and CD8+ T cell numbers. a Principal component analysis of RNA-seq data from melanoma samples before (circles) and on (triangles) anti-CD20 therapy. On-therapy samples consist of metastases affected by anti-CD20 therapy (therapeutic setting, green lines) and of metastases that developed de novo in B cell-depleted patients (adjuvant setting, orange lines). Percentage numbers in axis labels represent the explained variation by each component. Lines link a patient’s samples. b xCell estimated abundance of cell types in tissue samples before and on anti-CD20 therapy. Abundance of CD4+FOXP3+ was estimated using ssGSEA since no comparable xCell signature exists. c Expression of established inflammation (interferon (IFN) gamma, tumor inflammatory score (TIS), and T cell gene signatures before and on anti-CD20 therapy
Fig. 6
Fig. 6
Multiplex IHC confirms reduction of CD8+ and CD4+ T cells through B cell depletion. a B- and T cell numbers at the invasive tumor-stroma margin quantified using six-color multiplex immunostaining in tumor samples from nine patients obtained before and on therapy (at week 9 ± 2). Lower and upper hinges correspond to the first and third quartiles, center line to the median. Upper whisker extends from the hinge to the largest value no further than 1.5 times the interquartile range. Other data points are shown as outliers (black circles). Individual patient values are shown through differently colored diamonds. b Longitudinal analysis of tumor samples obtained over nearly 2 years from patient 4. Sample regions were classified as invasive tumor-stroma margin (Stroma) and intratumoral (Tumor). The lowest panel depicts the respective therapy at the given timepoints. Line colors represent the respective cell types. c Multiplex immunostaining for indicated antigens (right) of a representative patient-matched pair of melanoma samples before (top) and on (down) anti-CD20 therapy. Images were taken at the invasive tumor-stroma margin (left: pathology overviews), separated by a dashed line (middle: corresponding immunostaining overviews). Close-up showing a dense B- and T cell infiltrate at the invasive tumor-stroma margin (right). Note loss of B and T cell infiltrates, but not tumor cellularity on therapy (left and middle, down)

References

    1. Ascierto Paolo A., Long Georgina V., Robert Caroline, Brady Benjamin, Dutriaux Caroline, Di Giacomo Anna Maria, Mortier Laurent, Hassel Jessica C., Rutkowski Piotr, McNeil Catriona, Kalinka-Warzocha Ewa, Savage Kerry J., Hernberg Micaela M., Lebbé Celeste, Charles Julie, Mihalcioiu Catalin, Chiarion-Sileni Vanna, Mauch Cornelia, Cognetti Francesco, Ny Lars, Arance Ana, Svane Inge Marie, Schadendorf Dirk, Gogas Helen, Saci Abdel, Jiang Joel, Rizzo Jasmine, Atkinson Victoria. Survival Outcomes in Patients With Previously Untreated BRAF Wild-Type Advanced Melanoma Treated With Nivolumab Therapy. JAMA Oncology. 2019;5(2):187. doi: 10.1001/jamaoncol.2018.4514. - DOI - PMC - PubMed
    1. de Visser KE, Korets LV, Coussens LM. De novo carcinogenesis promoted by chronic inflammation is B lymphocyte dependent. Cancer Cell. 2005;7:411–423. doi: 10.1016/j.ccr.2005.04.014. - DOI - PubMed
    1. Ammirante M, Luo J-L, Grivennikov S, Nedospasov S, Karin M. B-cell-derived lymphotoxin promotes castration-resistant prostate cancer. Nature. 2010;464:302–305. doi: 10.1038/nature08782. - DOI - PMC - PubMed
    1. Shalapour S, et al. Immunosuppressive plasma cells impede T-cell-dependent immunogenic chemotherapy. Nature. 2015;521:94–98. doi: 10.1038/nature14395. - DOI - PMC - PubMed
    1. Affara NI, et al. B cells regulate macrophage phenotype and response to chemotherapy in squamous carcinomas. Cancer Cell. 2014;25:809–821. doi: 10.1016/j.ccr.2014.04.026. - DOI - PMC - PubMed

Publication types