

Bayesian Random Effect Modeling for analyzing spatial clustering of differential time trends of diarrhea incidences
- PMID: 31519962
- PMCID: PMC6744449
- DOI: 10.1038/s41598-019-49549-4
Bayesian Random Effect Modeling for analyzing spatial clustering of differential time trends of diarrhea incidences
Abstract
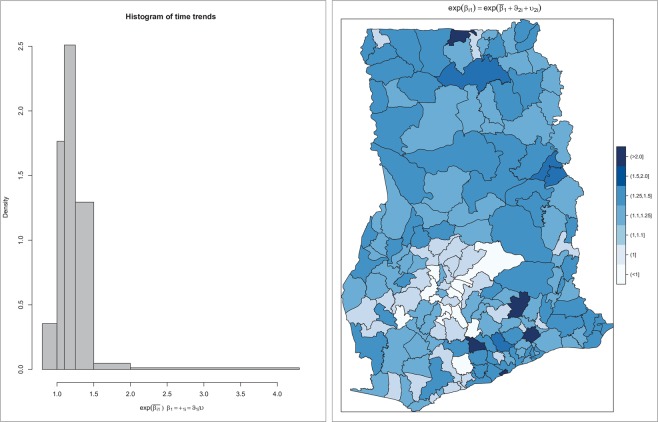
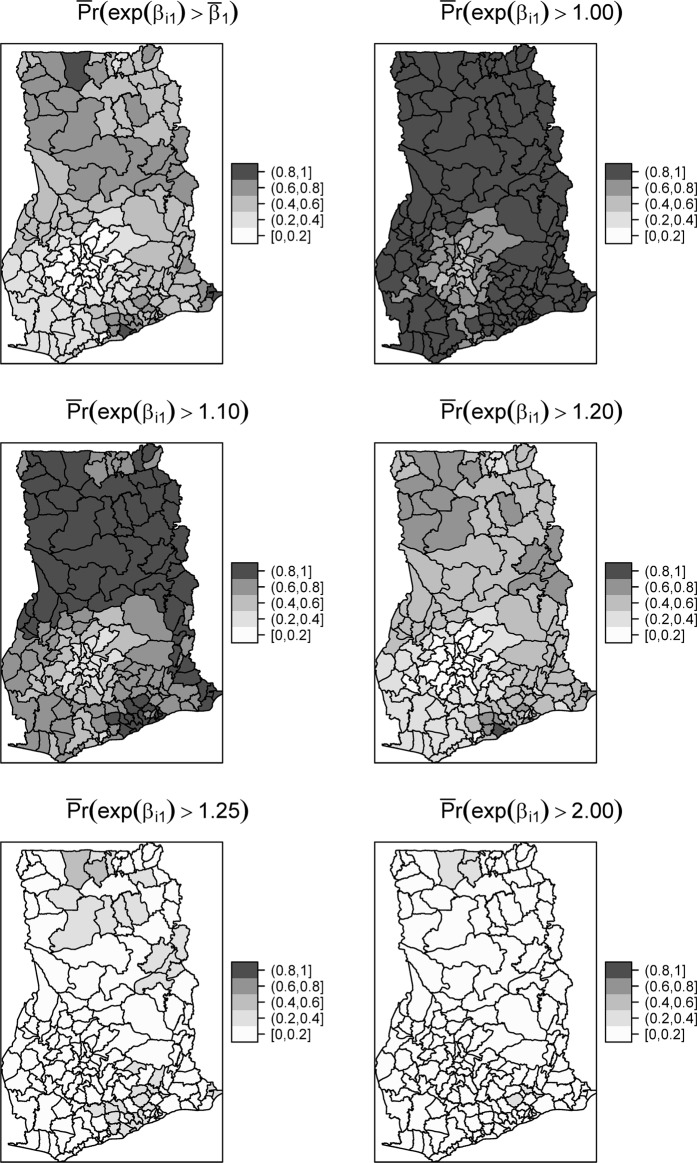
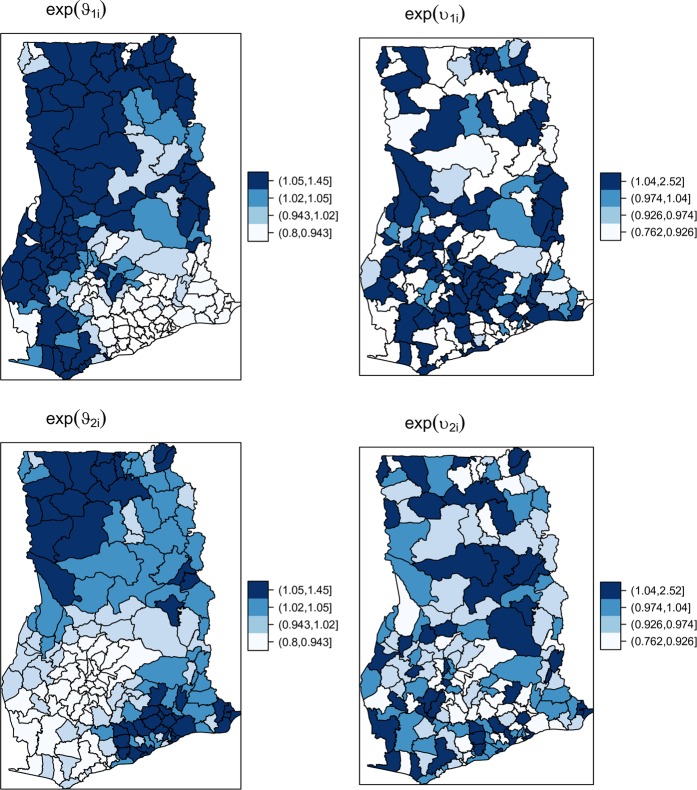
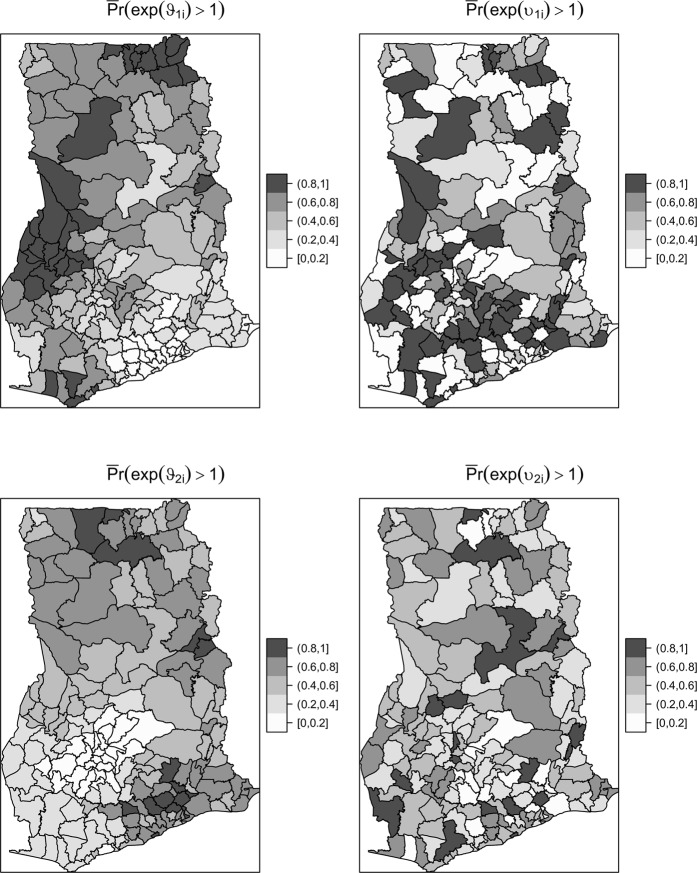
In 2012, nearly 644,000 people died from diarrhea in sub-Saharan Africa. This is a significant obstacle towards the achievement of the Sustainable Development Goal 3 of ensuring a healthy life and promoting the wellbeing at all ages. To enhance evidence-based site-specific intervention and mitigation strategies, especially in resource-poor countries, we focused on developing differential time trend models for diarrhea. We modeled the logarithm of the unknown risk for each district as a linear function of time with spatially varying effects. We induced correlation between the random intercepts and slopes either by linear functions or bivariate conditional autoregressive (BiCAR) priors. In comparison, models which included correlation between the varying intercepts and slopes outperformed those without. The convolution model with the BiCAR correlation prior was more competitive than the others. The inclusion of correlation between the intercepts and slopes provided an epidemiological value regarding the response of diarrhea infection dynamics to environmental factors in the past and present. We found diarrhea risk to increase by 23% yearly, a rate far exceeding Ghana's population growth rate of 2.3%. The varying time trends widely varied and clustered, with the majority of districts with at least 80% chance of their rates exceeding the previous years. These findings can be useful for active site-specific evidence-based planning and interventions for diarrhea.
Conflict of interest statement
The authors declare no competing interests.
Figures
References
-
- Black, R. E., Cousens, S., Johnson, H. L., Lawn, J. E. & Rudan, I. Global, regional, and national causes of child mortality in 2008: a systematic analysis. Lancet375, (2010). - PubMed
MeSH terms
LinkOut - more resources
Full Text Sources
Medical
Miscellaneous
