. 2019 Sep 13;9(1):13236.
doi: 10.1038/s41598-019-49766-x.

The redox metabolic pathways function to limit Anaplasma phagocytophilum infection and multiplication while preserving fitness in tick vector cells

Affiliations

The redox metabolic pathways function to limit Anaplasma phagocytophilum infection and multiplication while preserving fitness in tick vector cells

Pilar Alberdi et al. Sci Rep. .

Abstract

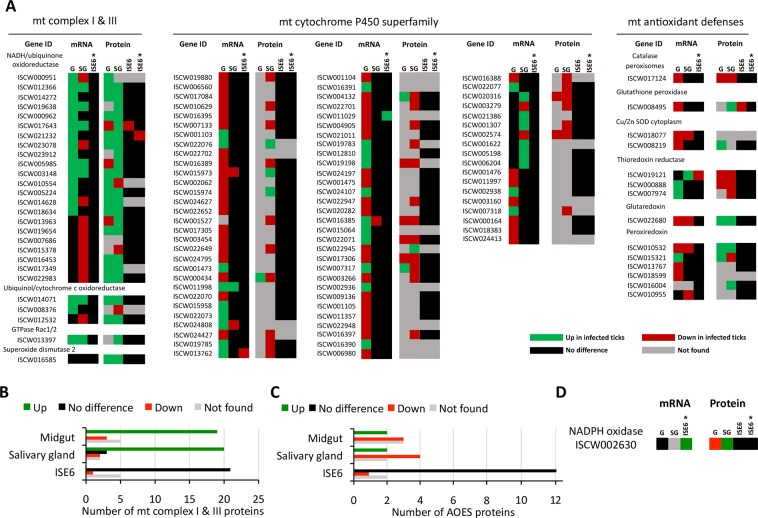
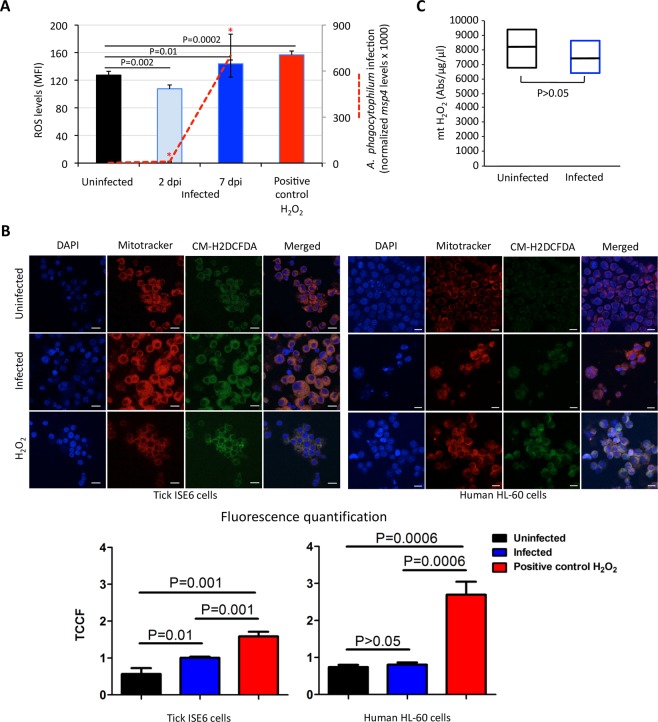
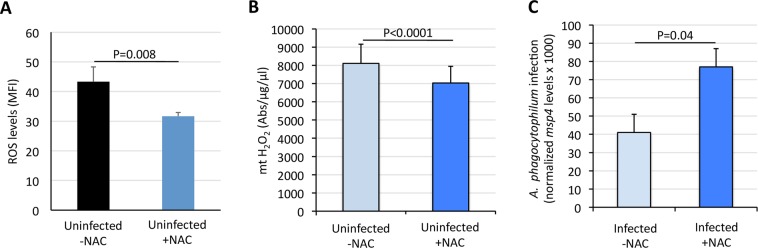
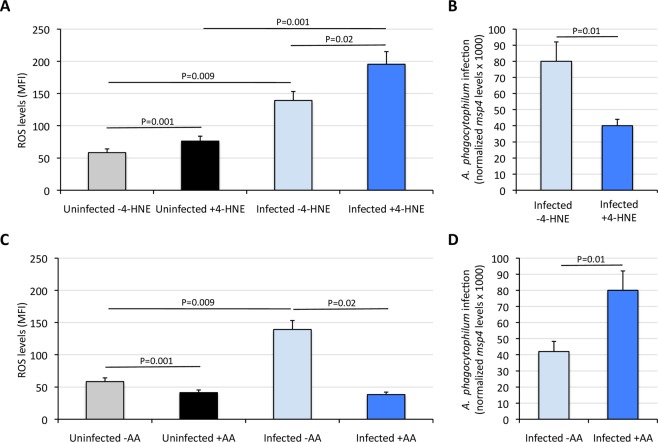
Aerobic organisms evolved conserved mechanisms controlling the generation of reactive oxygen species (ROS) to maintain redox homeostasis signaling and modulate signal transduction, gene expression and cellular functional responses under physiological conditions. The production of ROS by mitochondria is essential in the oxidative stress associated with different pathologies and in response to pathogen infection. Anaplasma phagocytophilum is an intracellular pathogen transmitted by Ixodes scapularis ticks and causing human granulocytic anaplasmosis. Bacteria multiply in vertebrate neutrophils and infect first tick midgut cells and subsequently hemocytes and salivary glands from where transmission occurs. Previous results demonstrated that A. phagocytophilum does not induce the production of ROS as part of its survival strategy in human neutrophils. However, little is known about the role of ROS during pathogen infection in ticks. In this study, the role of tick oxidative stress during A. phagocytophilum infection was characterized through the function of different pathways involved in ROS production. The results showed that tick cells increase mitochondrial ROS production to limit A. phagocytophilum infection, while pathogen inhibits alternative ROS production pathways and apoptosis to preserve cell fitness and facilitate infection. The inhibition of NADPH oxidase-mediated ROS production by pathogen infection appears to occur in both neutrophils and tick cells, thus supporting that A. phagocytophilum uses common mechanisms for infection of ticks and vertebrate hosts. However, differences in ROS response to A. phagocytophilum infection between human and tick cells may reflect host-specific cell tropism that evolved during pathogen life cycle.


Conflict of interest statement

The authors declare no competing interests.

Figures

Figure 1
Figure 1
Profile of I. scapularis mt ROS metabolic enzymes mRNA and protein levels and tick mt oxidative stress in response to A. phagocytophilum infection. Transcriptomics and proteomics data were obtained from previously published datasets in analyses conducted in I. scapularis female midguts (G) and female salivary glands (SG) in response to A. phagocytophilum infection,. ISE6 cells proteomics data was generated de novo after 2 dpi (ISE6) and 7 dpi (ISE6*). Up and Down refer to mRNA/protein levels in infected samples when compared to uninfected controls (P < 0.05). (A) Comparison of mt ROS metabolic enzymes mRNA and protein levels. (B) mt complex I and III enzymes and (C) antioxidant enzymes (AOES) protein levels in tick midgut, salivary gland and ISE6 cells were considered to provide an indicator of the effect of A. phagocytophilum infection on tick mt ROS metabolic pathways. (D) mRNA and protein levels for the putative tick NADPH oxidase (ISCW002630, B7PDQ2).
Figure 2
Figure 2
Validation of transcriptomics data by RT-PCR in A. phagocytophilum-infected and uninfected I. scapularis ISE6 cells. (A) Infected/Uninfected ratio differential expression (P < 0.05) for selected genes involved in mt ROS pathways in I. scapularis female midguts, salivary glands and ISE6 cells 7 dpi. (B) The expression of selected genes was characterized by real-time RT-PCR using total RNA extracted from infected and uninfected ISE6 cells 7dpi. The mRNA levels were normalized against tick 16S rRNA and cyclophilin using the genNorm method. Normalized Ct values were compared between infected and uninfected samples by Student’s t-test with unequal variance (P < 0.05; N = 4 biological replicates). The infected to uninfected ratio was calculated by dividing the mean normalized Ct values between infected and uninfected ISE6 cells and compared to transcriptomics data. (C) Immunofluorescence assays in A. phagocytophilum-infected and uninfected I. scapularis tick midgut digestive cells showed that ubiquinol/cytochrome c oxidoreductase levels (red arrows) were higher in infected ticks. Adult female tick slides showing midgut cells were incubated with anti-ubiquinol-cytochrome c reductase core protein I antibodies (ab96333) and developed with either (a) goat anti-rabbit IgG conjugated with FITC (green) or (b) goat anti-rabbit IgG conjugated with PE (red). Sections of uninfected ticks obtained under similar conditions as infected ticks were used as controls. Nuclei were stained with DAPI (blue). The slides were examined using a Zeiss LSM 800 laser scanning confocal microscope with x40 oil immersion objectives. Bars, 20 µm.
Figure 3
Figure 3
Oxidative stress increases in A. phagocytophilum-infected tick cells. (A) The effect of A. phagocytophilum infection on ROS generation in ISE6 tick cells was determined using CM-H2DCFDA that offers derivatives of reduced fluorescein as cell-permeant indicators for ROS. The ISE6 tick cells were infected with cell-free A. phagocytophilum (NY18 isolate) and analyzed at 2 and 7 days post-infection (dpi). As a positive control, uninfected cells were treated with 50 µM hydrogen peroxide (H2O2) for 30 min at 31 °C before ROS detection. The level of ROS in the viable cells was determined as the geometric median fluorescence intensity (MFI). The A. phagocytophilum infection (red line) was determined by msp4 PCR normalizing against tick 16S rRNA. The MFI and normalized Ct values (Ave + S.D) were compared between groups by Student’s t-test with unequal variance (P < 0.05; N = 4 biological replicates). (B) Fluorescence microscopy detection of mitochondria (mitotracker, red) and intracellular ROS (CM-H2DCFDA, green) in human and tick cells uninfected, A. phagocytophilum-infected at 7 dpi and treated with 50 µM H2O2 as a positive control. Nuclei were stained with DAPI (blue). Bars, 10 µm. Using ImageJ, an outline was drawn around each cell and area, mean fluorescence and integrated density were measured, along with several adjacent background readings. The total corrected cellular fluorescence (TCCF) = integrated density – (area of selected cell × mean fluorescence of background readings), was calculated. (C) The mt H2O2 generation was measured using a spectrofluorometer in mitochondria isolated from tick cells uninfected and A. phagocytophilum-infected at 7 dpi. Data was normalized by protein concentration and compared between groups by Student’s t-test with unequal variance (P < 0.05; N = 3 biological replicates).
Figure 4
Figure 4
Oxidative stress increases with A. phagocytophilum infection of ISE6 tick cells to limit pathogen infection. (A) The ROS production was determined after 7 days treatment with NAC of uninfected ISE6 tick cells. The level of ROS in the viable cells was determined as the geometric median fluorescence intensity (MFI) using CM-H2DCFDA. The MFI values (Ave + S.D) were compared between groups by Student’s t-test with unequal variance (P < 0.05; N = 4 biological replicates). (B) The mt H2O2 generation was measured using a spectrofluorometer in mitochondria isolated from uninfected tick cells untreated and treated with NAC for 7 days. Data was normalized by protein concentration and compared between groups by Student’s t-test with unequal variance (P < 0.05; N = 3 biological replicates). (C) The protective effect of ROS in infected tick cells was determined using N-acetyl cysteine (NAC) to inhibit ROS production and evaluate the effect on A. phagocytophilum infection at 7 dpi. The A. phagocytophilum infection was determined by msp4 PCR normalizing against tick 16S rRNA. Normalized Ct values (Ave + S.D) were compared between groups by Student’s t-test with unequal variance (P < 0.05; N = 4 biological replicates).
Figure 5
Figure 5
Effect of Antymicin A and 4-Hydroxy-2-nonenal on A. phagocytophilum infection and ROS levels in ISE6 tick cells. ISE6 tick cells were uninfected or infected with cell-free A. phagocytophilum (NY18 isolate), treated with AA, 4-HNE or left untreated and analyzed at 7 days post-infection (dpi). (A,C) The effect of A. phagocytophilum infection on ROS generation in ISE6 tick cells was determined using CM-H2DCFDA. The level of ROS in the cells was determined as the median fluorescence intensity (MFI). (B,D) The A. phagocytophilum infection levels were determined by msp4 PCR normalizing against tick 16 S rDNA. Four replicates were done for each assay and MFI and normalized Ct values (Ave + S.D) were compared between groups by Student’s t-test with unequal variance (P < 0.05). Abbreviations: AA, Antymicin A; 4-HNE, 4-Hydroxy-2-nonenal.
Figure 6
Figure 6
Biosensor redox state. The roGFP2-Orp1 probe redox state was monitored for 60 min in I. scapularis ISE6 tick cells treated for 2 days with either 100 μM 4-Hydroxy-2-nonenal (A) or 2 μM Antimycin A (B).
Figure 7
Figure 7
Effect of treatment with Antymicin A and 4-Hydroxy-2-nonenal on the viability of ISE6 tick cells. The percentage of apoptotic, dead/late apoptotic, necrotic and viable cells was determined in AA- (2 µ M) and 4-HNE (100 µM)-treated and untreated infected and uninfected cells by flow cytometry after Annexin V-FITC and PI labeling, and the average of 4 replicated represented. Abbreviations: AA, Antymicin A; 4-HNE, 4-Hydroxy-2-nonenal.
Figure 8
Figure 8
Model of the function of tick mt ROS production pathways during A. phagocytophilum infection. Taking together the results of the tick transcriptome and proteome in response to A. phagocytophilum infection and the functional studies conducted here, we proposed a model for the role of ROS production during pathogen infection and multiplication in ticks. (A) The increase in protein levels of mt enzymes of the NADH-ubiquinone oxidoreductase (complex I) and ubiquinol cytochrome C reductase (complex III) together with the down-regulation at the mRNA and/or protein levels of AOES in response to A. phagocytophilum infection probably resulted in the generation of ROS and induced apoptosis as protective mechanisms against infection. However, the decrease in the levels of certain mt complex I and III enzymes and/or the increase in some AOES probably reflected a compensatory mechanism to reduce ROS production/accumulation and preserve cell function and tick fitness while limiting pathogen infection. ROS induction of the intrinsic apoptosis pathways was inhibited by A. phagocytophilum through Porin down-regulation, favoring bacterial infection (B) Other non-mt AOES may also function to control redox homeostasis, antioxidant defense and ROS detoxification. (C) The effect of A. phagocytophilum infection on the under-representation of tick HRG1 suggested a mechanism activated by the pathogen in the endosomal digestive vesicle to reduce the antimicrobial oxidative burden caused by ROS generated after heme release. (D) In tick midgut and ISE6 cells but not in salivary glands, NADPH oxidase protein levels decreased in response to infection, with a possible impact on reduced ROS production and apoptosis, which may favor pathogen infection.

References

    1. Novo E, Parola M. Redox mechanisms in hepatic chronic wound healing and fibrogenesis. Fibrogenesis Tissue Repair. 2008;1:5. doi: 10.1186/1755-1536-1-5. - DOI - PMC - PubMed
    1. Marchi S, et al. Mitochondria-ros crosstalk in the control of cell death and aging. J Signal Transduct. 2012;2012:329635. doi: 10.1155/2012/329635. - DOI - PMC - PubMed
    1. Holzerová E, Prokisch H. Mitochondria: Much ado about nothing? How dangerous is reactive oxygen species production? Int J Biochem Cell Biol. 2015;63:16–20. doi: 10.1016/j.biocel.2015.01.021. - DOI - PMC - PubMed
    1. Murphy MP. How mitochondria produce reactive oxygen species. Biochem J. 2009;417:1–13. doi: 10.1042/BJ20081386. - DOI - PMC - PubMed
    1. Sena LA, Chandel NS. Physiological roles of mitochondrial reactive oxygen species. Mol Cell. 2012;48:158–167. doi: 10.1016/j.molcel.2012.09.025. - DOI - PMC - PubMed

Publication types

MeSH terms