. 2019 Nov;29(11):927-941.
doi: 10.1038/s41422-019-0230-z. Epub 2019 Sep 13.

Dynamic methylome of internal mRNA N7-methylguanosine and its regulatory role in translation

Affiliations

Dynamic methylome of internal mRNA N7-methylguanosine and its regulatory role in translation

Lionel Malbec et al. Cell Res. 2019 Nov.

Abstract

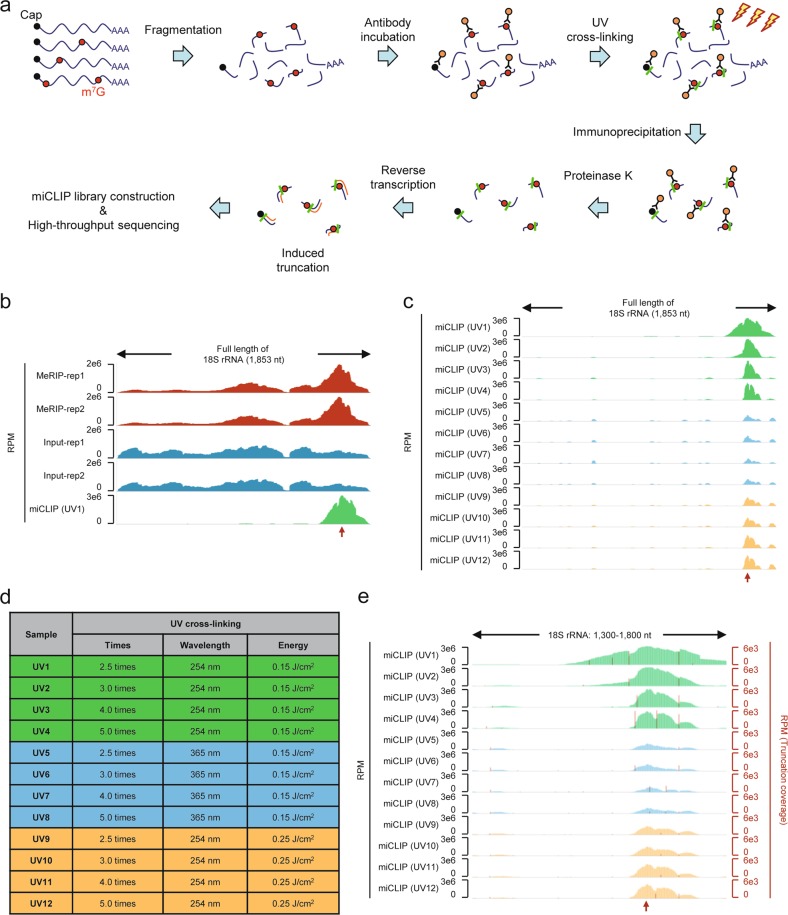
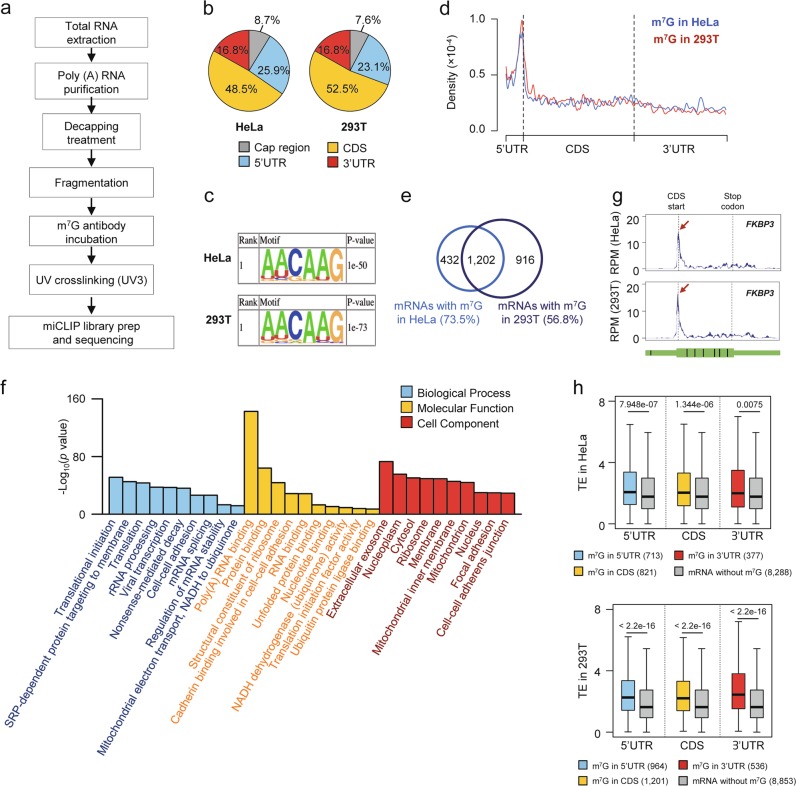
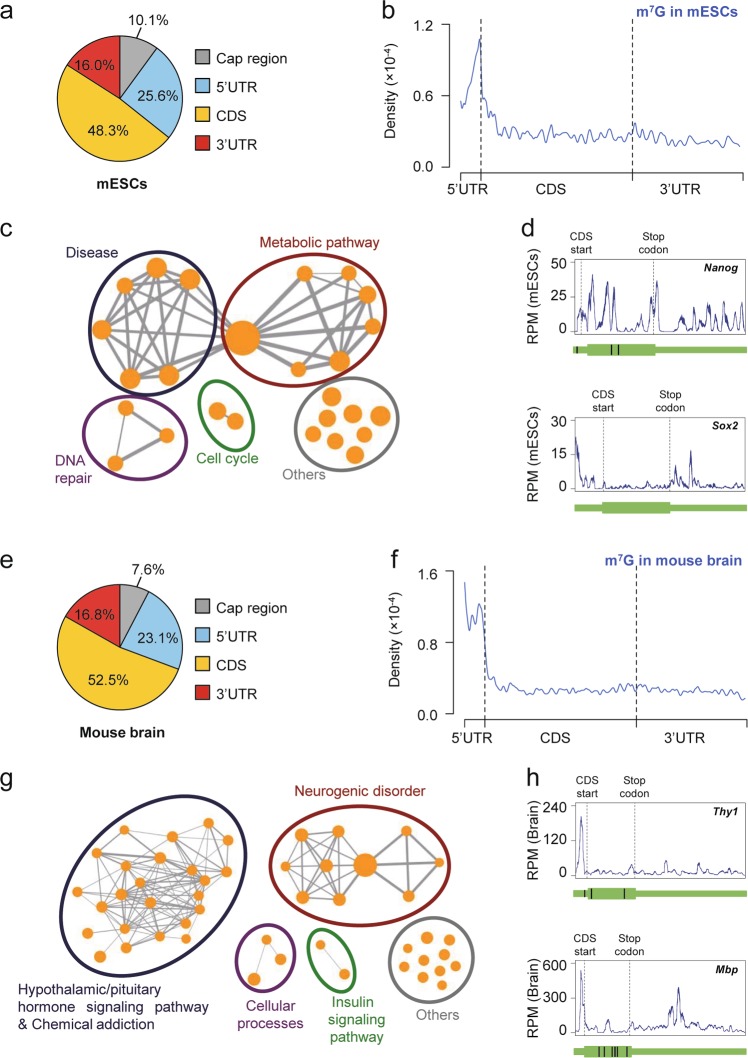
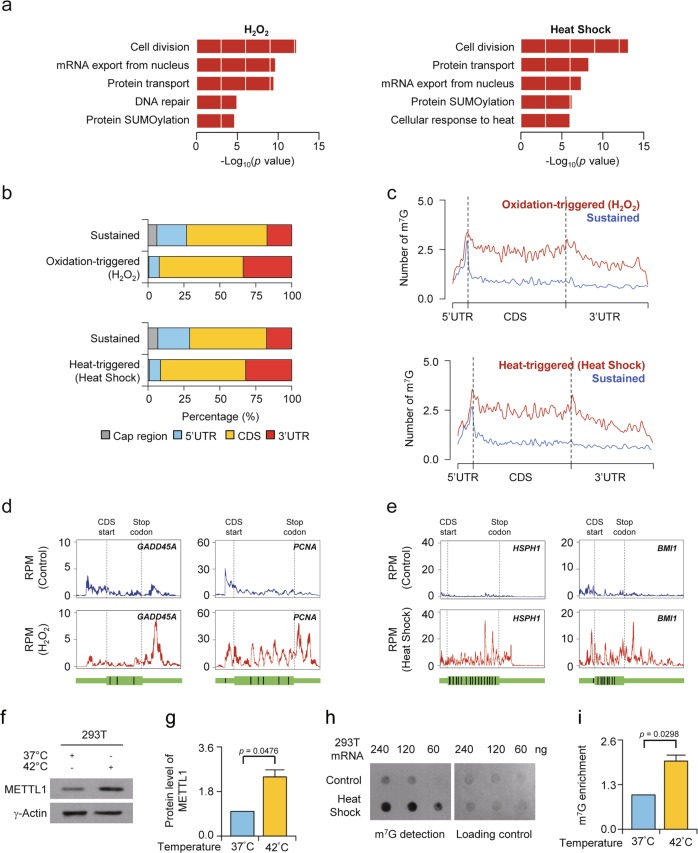
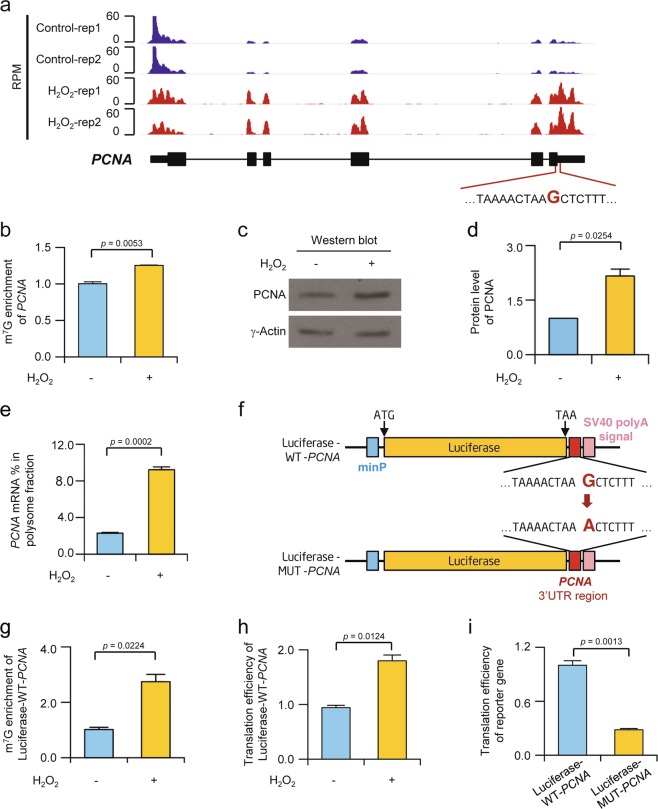
Over 150 types of RNA modifications are identified in RNA molecules. Transcriptome profiling is one of the key steps in decoding the epitranscriptomic panorama of these chemical modifications and their potential functions. N7-methylguanosine (m7G) is one of the most abundant modifications present in tRNA, rRNA and mRNA 5'cap, and has critical roles in regulating RNA processing, metabolism and function. Besides its presence at the cap position in mRNAs, m7G is also identified in internal mRNA regions. However, its transcriptome-wide distribution and dynamic regulation within internal mRNA regions remain unknown. Here, we have established m7G individual-nucleotide-resolution cross-linking and immunoprecipitation with sequencing (m7G miCLIP-seq) to specifically detect internal mRNA m7G modification. Using this approach, we revealed that m7G is enriched at the 5'UTR region and AG-rich contexts, a feature that is well-conserved across different human/mouse cell lines and mouse tissues. Strikingly, the internal m7G modification is dynamically regulated under both H2O2 and heat shock treatments, with remarkable accumulations in the CDS and 3'UTR regions, and functions in promoting mRNA translation efficiency. Consistently, a PCNA 3'UTR minigene reporter harboring the native m7G modification site displays both enriched m7G modification and increased mRNA translation upon H2O2 treatment compared to the m7G site-mutated minigene reporter (G to A). Taken together, our findings unravel the dynamic profiles of internal mRNA m7G methylome and highlight m7G as a novel epitranscriptomic marker with regulatory roles in translation.


Conflict of interest statement

The authors declare no competing interests.

Figures

Fig. 1
Fig. 1
miCLIP-seq provides higher resolution than conventional MeRIP-seq. a Illustration of m7G miCLIP-seq. Fragmented RNAs are incubated with anti-m7G antibody. After UV cross-linking, covalently bound antibody-RNA complexes are recovered by protein A affinity purification. RNAs are then released by proteinase K digestion and reverse transcribed. During this step, peptide fragments that remain on RNAs lead to cDNA truncations or mutations. The cDNA library is then amplified by PCR and subjected to deep sequencing. b Integrative Genomics Viewer (IGV) tracks showing reads from three different libraries along 18S rRNA. The red arrow represents m7G residue at position 1639 of 18S rRNA. c IGV tracks showing reads from miCLIP libraries under 12 different UV conditions along 18S rRNA. d Parameter settings of cross-linking times, wave length and energy input for each UV condition. e IGV tracks showing reads from miCLIP libraries under 12 different UV conditions around m7G1639. The red bar along each track represents the truncation reads number at each position
Fig. 2
Fig. 2
The transcriptome landscape of m7G reveals the enrichment of internal m7G near start codon in human mRNAs. a Workflow for mRNA m7G miCLIP-seq. b Pie chart showing percentage of mRNA m7G clusters in each non overlapping segment in HeLa (left panel) and 293T (right panel). Segments are annotated by Ensembl database (hg38, release 86) and the cap region is defined as 50 nt downstream from the 5′ terminus. c Motif analysis of internal mRNA m7G in HeLa (upper panel) and 293T (lower panel) mRNAs by HOMER. d Distribution of internal m7G across HeLa (blue) and 293T (red) mRNA segments. Each segment is normalized according to its average length from Ensembl database. e Venn plot showing the numbers of mRNAs displaying internal m7G in HeLa and 293T cells. f Bar plot chart showing the significant GO terms for HeLa mRNAs containing internal m7G. g Representative mRNAs displaying m7G clusters in both HeLa (upper panel) and 293T (lower panel) cells. m7G clusters are highlighted with red arrows along the transcripts. Transcript architecture is shown beneath, with thin parts corresponding to UTRs and thicker ones to CDS; exon-exon junctions are indicated by vertical black lines. h Boxplot chart showing increased translation efficiency (TE) for HeLa (upper panel) and 293T (lower panel) mRNAs displaying m7G within 5′UTR, CDS or 3′UTR compared to mRNAs without internal m7G (Mann–Whitney U test). Translation efficiency results are downloaded from GSE63591 and GSE65778
Fig. 3
Fig. 3
m7G methylome shows conservation between human and mouse. a Pie chart showing percentage of mRNA m7G in each non-overlapping segment in mESCs. Segments are annotated by Ensembl database (mm10, release 68). b Distribution of internal m7G across mRNA segments in mESCs. c KEGG pathway analysis of mRNAs displaying internal m7G. Pathways are filtered by P < 0.005 and FDR < 0.1 as default. d Two key embryonic mRNAs displaying m7G clusters in mESCs. e Pie chart showing percentage of mRNA m7G in each non overlapping segment in mouse brain. f Distribution of internal m7G across mRNA segments in mouse brain. g KEGG pathway analysis of mRNAs displaying internal m7G. Pathways are filtered by P < 0.005 and FDR < 0.1 as default. h Two brain specific mRNAs displaying m7G clusters in mouse brain
Fig. 4
Fig. 4
Stresses enhance enrichment of internal m7G in CDS and 3′UTR in 293T cells. a Barplot chart showing the GO terms for mRNAs displaying oxidative stress-enhanced internal m7G (left panel, n = 1924) and heat shock-enhanced internal m7G (right panel, n = 2009) in 293T cells. b Barplot chart showing percentage of mRNA m7G in each non-overlapping segment under oxidative stress (upper panel) and heat shock (lower panel) in 293T cells. c Numbers of sustained (blue) and heat/oxidation-triggered internal m7G (red) across mRNA segments under oxidative stress (upper panel) and heat shock (lower panel) in 293T cells. d Two mRNAs displaying oxidative stress-enhanced internal m7G modification in control (blue) and hydrogen peroxide-treated (red) 293T cells. e Two mRNAs displaying heat shock-enhanced internal m7G modification in control (blue) and heat shock-treated (red) 293T cells. f Western blot assay showing increased METTL1 protein expression after heat shock treatment. γ-actin serves as a protein loading control. g Quantification of three biological replicates of western blot assays showing increased METTL1 protein expression after heat shock treatment (n = 3). h Dot blot assay showing m7G levels of 293T mRNAs under control and heat shock conditions. Methylene blue staining indicates equal RNA loadings. i Quantification of three biological replicates of dot blot assays showing increased m7G levels of 293T mRNAs upon heat shock treatment. (n = 3). Data represent mean ± SEM. The P values were calculated by a two-tailed unpaired Student’s t test
Fig. 5
Fig. 5
Internal m7G promotes PCNA mRNA translation. a IGV tracks displaying miCLIP-seq read distribution along PCNA in control (blue) and hydrogen peroxide-treated (red) 293T cells. b qPCR assay showing m7G enrichment of endogenous PCNA mRNA upon H2O2 treatment (n = 3). c Western blot assay showing increased PCNA protein expression after H2O2 treatment. γ-actin serves as a protein loading control. d Quantification of western blot assays from five biological replicates showing increased PCNA protein expression after H2O2 treatment (n = 5). e qRT-PCR analysis of the enrichment of endogenous PCNA mRNAs from the polysome fraction upon H2O2 treatment (n = 3). f Reporter constructs of Luciferase-WT-PCNA and Luciferase-MUT-PCNA. A 100 nt fragment containing m7G site from 3′UTR of PCNA was inserted after Luciferase CDS. Luciferase-MUT-PCNA was identical to Luciferase-WT-PCNA, except that one guanine (bold red) within the m7G motif was mutated to adenosine (bold red). g m7G enrichment of exogenous Luciferase-WT-PCNA reporter RNA upon H2O2 treatment assayed by qPCR (n = 3). h Dual luciferase assay showing increased translation efficiency of Luciferase-WT-PCNA reporter upon H2O2 treatment (n = 3). i Dual luciferase assay showing decreased translation efficiency of Luciferase-MUT-PCNA reporter compared to Luciferase-WT-PCNA reporter in standard condition (n = 3). Data represent mean ± SEM. The P values were calculated by a two-tailed unpaired Student’s t test

References

    1. Yi C, Pan T. Cellular dynamics of RNA modification. Acc. Chem. Res. 2011;44:1380–1388. - PMC - PubMed
    1. Boccaletto P, et al. MODOMICS: a database of RNA modification pathways. 2017 update. Nucleic Acids Res. 2018;46:D303–D307. - PMC - PubMed
    1. Dominissini D, et al. Topology of the human and mouse m6A RNA methylomes revealed by m6A-seq. Nature. 2012;485:201–206. - PubMed
    1. Meyer KD, et al. Comprehensive analysis of mRNA methylation reveals enrichment in 3′ UTRs and near stop codons. Cell. 2012;149:1635–1646. - PMC - PubMed
    1. Liu J, et al. A METTL3-METTL14 complex mediates mammalian nuclear RNA N6-adenosine methylation. Nat. Chem. Biol. 2014;10:93–95. - PMC - PubMed