Systematic prediction of functionally linked genes in bacterial and archaeal genomes
- PMID: 31520072
- PMCID: PMC6938587
- DOI: 10.1038/s41596-019-0211-1
Systematic prediction of functionally linked genes in bacterial and archaeal genomes
Abstract
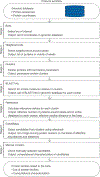
Functionally linked genes in bacterial and archaeal genomes are often organized into operons. However, the composition and architecture of operons are highly variable and frequently differ even among closely related genomes. Therefore, to efficiently extract reliable functional predictions for uncharacterized genes from comparative analyses of the rapidly growing genomic databases, dedicated computational approaches are required. We developed a protocol to systematically and automatically identify genes that are likely to be functionally associated with a 'bait' gene or locus by using relevance metrics. Given a set of bait loci and a genomic database defined by the user, this protocol compares the genomic neighborhoods of the baits to identify genes that are likely to be functionally linked to the baits by calculating the abundance of a given gene within and outside the bait neighborhoods and the distance to the bait. We exemplify the performance of the protocol with three test cases, namely, genes linked to CRISPR-Cas systems using the 'CRISPRicity' metric, genes associated with archaeal proviruses and genes linked to Argonaute genes in halobacteria. The protocol can be run by users with basic computational skills. The computational cost depends on the sizes of the genomic dataset and the list of reference loci and can vary from one CPU-hour to hundreds of hours on a supercomputer.
Conflict of interest statement
Competing interests
The authors declare no competing interests.
Figures


References
-
- Wolf YI, Rogozin IB, Kondrashov AS & Koonin EV Genome alignment, evolution of prokaryotic genome organization and prediction of gene function using genomic context. Genome Res. 11, 356–372 (2001). - PubMed
-
- Rogozin IB, Makarova KS, Wolf YI & Koonin EV Computational approaches for the analysis of gene neighbourhoods in prokaryotic genomes. Brief Bioinform. 5, 131–149 (2004). - PubMed
-
- Aravind L Guilt by association: contextual information in genome analysis. Genome Res. 10, 1074–1077 (2000). - PubMed
-
- Galperin MY & Koonin EV Who’s your neighbor? New computational approaches for functional genomics. Nat. Biotechnol 18, 609–613 (2000). - PubMed
Publication types
MeSH terms
Grants and funding
LinkOut - more resources
Full Text Sources

