. 2019 Sep 14;20(1):211.
doi: 10.1186/s12931-019-1177-9.

Determination of reliable lung function parameters in intubated mice

Affiliations

Determination of reliable lung function parameters in intubated mice

Eline Bonnardel et al. Respir Res. .

Abstract

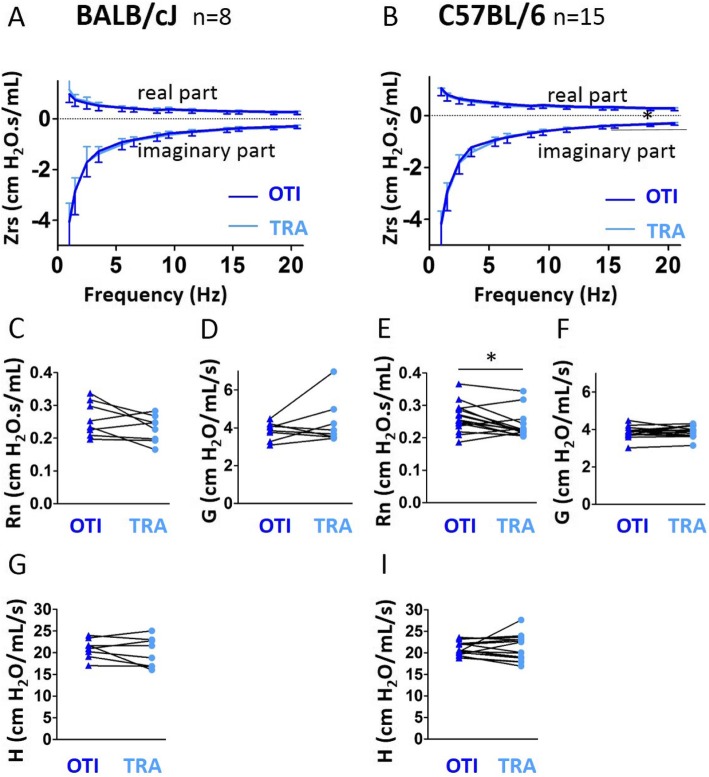
Background: Animal models and, in particular, mice models, are important tools to investigate the pathogenesis of respiratory diseases and to test potential new therapeutic drugs. Lung function measurement is a key step in such investigation. In mice, it is usually performed using forced oscillation technique (FOT), negative pressure-driven forced expiratory (NPFE) and pressure-volume (PV) curve maneuvers. However, these techniques require a tracheostomy, which therefore only allows end-point measurements. Orotracheal intubation has been reported to be feasible and to give reproducible lung function measurements, but the agreement between intubation and tracheostomy generated-data remains to be tested.

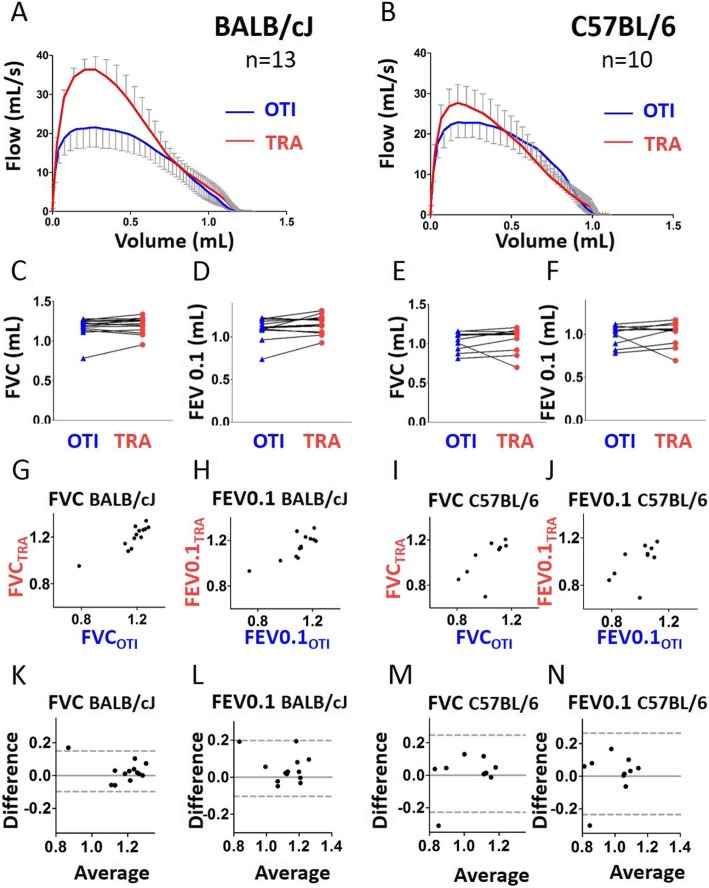
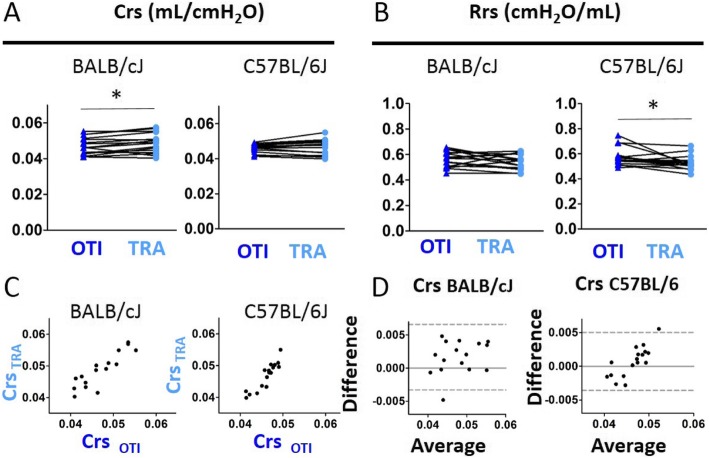
Methods: Using the Flexivent system, we measured lung function parameters (in particular, forced vital capacity (FVC), forced expiratory volume in the first 0.1 s (FEV0.1), compliance (Crs) of the respiratory system, compliance (C) measured using PV loop and an estimate of inspiratory capacity (A)) in healthy intubated BALB/cJ mice and C57BL/6 J mice and compared the results with similar measurements performed in the same mice subsequently tracheostomized after intubation, by means of paired comparison method, correlation and Bland-Altman analysis. The feasibility of repetitive lung function measurements by intubation was also tested.

Results: We identified parameters that are accurately evaluated in intubated animals (i.e., FVC, FEV0.1, Crs, C and A in BALB/cJ and FVC, FEV0.1, and A in C57BL/6 J). Repetitive lung function measurements were obtained in C57BL/6 J mice.

Conclusion: This subset of lung function parameters in orotracheally intubated mice is reliable, thereby allowing relevant longitudinal studies.

Keywords: Asthma; COPD; Lung function; Mice model; Orotracheal intubation.


Conflict of interest statement

Dr. Berger reports grants from Nycomed, grants from Takeda, grants from Fondation du Souffle–Fonds de dotation Recherche en Santé Respiratoire, during the conduct of the study; grants and personal fees from Novartis, personal fees and non-financial support from Chiesi, grants, personal fees and non-financial support from Boehringer Ingelheim, personal fees and non-financial support from AstraZeneca, personal fees and non-financial support from Sanofi, personal fees from Menarinni, personal fees from TEVA, outside the submitted work. In addition, Dr. Berger and Dr. Dupin have a patent (EP N°15152886.6 i.e. New compositions and methods of treating and/or preventing Chronic Obstructive Pulmonary Disease) pending.

Figures

Fig. 1
Fig. 1
Evaluation of lung function measurement assessed by the NPFE maneuver in mice using orotracheal intubation and tracheostomy. a, b, Average expiratory flow-volume curves of intubated (“OTI”, in blue) and tracheostomized (“TRA”, in red) mice. n = 13 BALB/cJ mice, n = 10 C57BL/6 J mice. Lower and upper error bars represent standard deviations for intubation and tracheostomy, respectively. c-f, Forced vital capacity (“FVC”, c and e), forced expired volume over 0.1 s (“FEV0.1”, d and f) in intubated and tracheostomized BALB/cJ mice (c, e) and C57BL/6 J mice (d, f). Data represent individual mice and are analyzed by the Wilcoxon signed-rank test or paired t tests. * P < 0.05. g, i, Relationships between FVC measured in intubated and tracheostomized BALB/cJ (g) and C57BL/6 J (i) mice. h, j, Relationships between FEV0.1 measured in intubated and tracheostomized BALB/cJ (h) and C57BL/6 J (j) mice. k-n, Bland-Altman plots to compare two measurements techniques for FVC in BALB/cJ (k) and C57BL/6 J (m), FEV0.1 in BALB/cJ (l) and C57BL/6 J (n). The upper and lower limits of agreement (95% confidence interval) are shown by a gray dotted line
Fig. 2
Fig. 2
Evaluation of lung function measurement assessed by single compartment model obtained in mice using orotracheal intubation and tracheostomy. a-b, Comparaison of the variables compliance (“Crs”, a) and resistance (“Rrs”, b) of the respiratory system in intubated (“OTI”) and tracheostomized (“TRA”) mice. n = 14 BALB/cJ mice, n = 10 C57BL/6 J mice. Data represent individual mice and are analyzed by the Wilcoxon signed-rank test or paired t tests. ** P < 0.01. c, Relationships between Crs measured in intubated and tracheostomized BALB/cJ and C57BL/6 J mice. d, Bland-Altman plots to compare two measurements techniques for Crs. The upper and lower limits of agreement (95% confidence interval) are shown by a gray dotted line
Fig. 3
Fig. 3
Evaluation of lung function measurement assessed by constant phase model obtained in mice using orotracheal intubation and tracheostomy. a, b, Average real (top) and imaginary (bottom) parts of respiratory system input impedance (Zrs) obtained in intubated (“OTI”, in blue) mice and tracheostomized (“TRA”, in red) mice. n = 12 BALB/cJ mice (a), n = 9 C57BL/6 J mice (b). Lower and upper error bars represent standard deviations respectively for respectively for intubation and tracheostomyintubation and tracheostomy. c-i, newtonian resistance (“Rn”, c and e), tissue damping (“G”, d, f), tissue elastance (“H”, g, i) in intubated and tracheostomized BALB/cJ mice (c, d, g) and C57BL/6 J mice (e, f, i). Data represent individual mice and are analyzed by the Wilcoxon signed-rank test or paired t tests. * P < 0.05, *** P < 0.001
Fig. 4
Fig. 4
Evaluation of lung function measurement assessed by the Pressure-Volume (PV) curve maneuver in mice using orotracheal intubation and tracheostomy. a, b, Average PV curves of intubated (“OTI”, in blue) mice and tracheostomized (“TRA”, in red) mice. n = 14 BALB/cJ mice (a), n = 10 C57BL/6 J mice (b). Lower and upper error bars represent standard deviations for intubation and tracheostomy, respectively. c-f, compliance (“C”, c and e), estimate of inspiratory capacity (“A”, d and f) in intubated and tracheostomized BALB/cJ mice (c, e) and C57BL/6 J mice (d, f). Data represent individual mice and are analyzed by the Wilcoxon signed-rank test or paired t tests. g, i, Relationships between c measured in intubated and tracheostomized BALB/cJ (g) and C57BL/6 J (i) mice. h, j, Relationships between A measured in intubated and tracheostomized BALB/cJ (h) and C57BL/6 J (j) mice. k-n, Bland-Altman plots to compare two measurements techniques for C in BALB/cJ (k) and C57BL/6 J (m), A in BALB/cJ (l) and C57BL/6 J (n). The upper and lower limits of agreement (95% confidence interval) are shown by a gray dotted line
Fig. 5
Fig. 5
Evaluation of lung function measurement assessed by the NPFE maneuver in mice using orotracheal intubation and tracheostomy, both using the intubation cannula. a, b, Average expiratory flow-volume curves of intubated (“OTI”, in blue) and tracheostomized (“TRA”, in red) mice. n = 16 BALB/cJ mice, n = 16 C57BL/6 J mice. Lower and upper error bars represent standard deviations for intubation and tracheostomy, respectively. c-f, Forced vital capacity (“FVC”, c and e), forced expired volume over 0.1 s (“FEV0.1”, d and f) in intubated and tracheostomized BALB/cJ mice (c, e) and C57BL/6 J mice (d, f). Data represent individual mice and are analyzed by the Wilcoxon signed-rank test or paired t tests. g, i, Relationships between FVC measured in intubated and tracheostomized BALB/cJ (g) and C57BL/6 J (i) mice. h, j, Relationships between FEV0.1 measured in intubated and tracheostomized BALB/cJ (h) and C57BL/6 J (j) mice. k-n, Bland-Altman plots to compare two measurements techniques for FVC in BALB/cJ (k) and C57BL/6 J (m), FEV0.1 in BALB/cJ (l) and C57BL/6 J (n). The upper and lower limits of agreement (95% confidence interval) are shown by a gray dotted line
Fig. 6
Fig. 6
Evaluation of lung function measurement assessed by single compartment model obtained in mice using orotracheal intubation and tracheostomy, both using the intubation cannula. a-b, Comparaison of the variables compliance (“Crs”, a) and resistance (“Rrs”, b) of the respiratory system in intubated (“OTI”) and tracheostomized (“TRA”) mice. n = 16 BALB/cJ mice, n = 17 C57BL/6 J mice. Data represent individual mice and are analyzed by the Wilcoxon signed-rank test or paired t tests. * P < 0.05. C, Relationships between Crs measured in intubated and tracheostomized BALB/cJ and C57BL/6 J mice. d, Bland-Altman plots to compare two measurements techniques for Crs. The upper and lower limits of agreement (95% confidence interval) are shown by a gray dotted line
Fig. 7
Fig. 7
Evaluation of lung function measurement assessed by constant phase model obtained in mice using orotracheal intubation and tracheostomy, both using the intubation cannula. a, b, Average real (top) and imaginary (bottom) parts of respiratory system input impedance (Zrs) obtained in intubated (“OTI”, in blue) mice and tracheostomized (“TRA”, in red) mice. n = 8 BALB/cJ mice (a), n = 15 C57BL/6 J mice (b). Lower and upper error bars represent standard deviations respectively for intubation and tracheostomy. c-i, newtonian resistance (“Rn”, c and e), tissue damping (“G”, d, f), tissue elastance (“H”, g, i) in intubated and tracheostomized BALB/cJ mice (c, d, g) and C57BL/6 J mice (e, f, i). Data represent individual mice and are analyzed by the Wilcoxon signed-rank test or paired t tests. * P < 0.05
Fig. 8
Fig. 8
Evaluation of lung function measurement assessed by the Pressure-Volume (PV) curve maneuver in mice using orotracheal intubation and tracheostomy, both using the intubation cannula. a, b, Average PV curves of intubated (“OTI”, in blue) mice and tracheostomized (“TRA”, in red) mice. n = 16 BALB/cJ mice (a), n = 17 C57BL/6 J mice (b). Lower and upper error bars represent standard deviations for intubation and tracheostomy, respectively. c-f, compliance (“C”, c and e), estimate of inspiratory capacity (“A”, d and f) in intubated and tracheostomized BALB/cJ mice (c, e) and C57BL/6 J mice (d, f). Data represent individual mice and are analyzed by the Wilcoxon signed-rank test or paired t tests. g, i, Relationships between C measured in intubated and tracheostomized BALB/cJ (g) and C57BL/6 J (i) mice. h, j, Relationships between A measured in intubated and tracheostomized BALB/cJ (h) and C57BL/6 J (j) mice. k-n, Bland-Altman plots to compare two measurements techniques for C in BALB/cJ (k) and C57BL/6 J (m), A in BALB/cJ (l) and C57BL/6 J (n). The upper and lower limits of agreement (95% confidence interval) are shown by a gray dotted line
Fig. 9
Fig. 9
Repeated lung function measurement in intubated C57BL/6 J mice. a, Study protocol. Lung function measurements were performed at day 0 and 19. n represents the number of surviving mice at a given time point. b, Average mice weight. c-k, Peak expiratory flow (“PEF”, c), Forced vital capacity (“FVC”, d), forced expired volume over 0.1 s (“FEV0.1”, e), FEV0.1/FVC ratio (f), newtonian resistance (“Rn”, g), tissue damping (“G”, h), tissue elastance (“H”, i), resistance (“Rrs”, j) and compliance (“Crs”, k) of the respiratory system in intubated mice at day 0 (“OTI 1”) and day 19 (“OTI 2”). Data represent individual mice and are analyzed by the Wilcoxon signed-rank test

Similar articles

Cited by

References

    1. From the Global Strategy for the Diagnosis, Management and Prevention of COPD, Global Initiative for Chronic Obstructive Lung Disease (GOLD) 2019. Available from: https://goldcopd.org
    1. Chapman RW. Canine models of asthma and COPD. Pulm Pharmacol Ther. 2008;21:731–742. doi: 10.1016/j.pupt.2008.01.003. - DOI - PubMed
    1. Zosky GR, Sly PD. Animal models of asthma. Clin Exp Allergy. 2007;37:973–988. doi: 10.1111/j.1365-2222.2007.02740.x. - DOI - PubMed
    1. Groneberg DA, Chung KF. Models of chronic obstructive pulmonary disease. Respir Res. 2004;5:18. doi: 10.1186/1465-9921-5-18. - DOI - PMC - PubMed
    1. Shapiro SD. Animal models for chronic obstructive pulmonary disease: age of klotho and marlboro mice. Am J Respir Cell Mol Biol. 2000;22:4–7. doi: 10.1165/ajrcmb.22.1.f173. - DOI - PubMed

LinkOut - more resources