. 2019 Sep 14;9(1):24.
doi: 10.1186/s13395-019-0209-y.

Immunohistochemical phenotyping of T cells, granulocytes, and phagocytes in the muscle of cancer patients: association with radiologically defined muscle mass and gene expression

Affiliations

Immunohistochemical phenotyping of T cells, granulocytes, and phagocytes in the muscle of cancer patients: association with radiologically defined muscle mass and gene expression

Ana Anoveros-Barrera et al. Skelet Muscle. .

Abstract

Background: Inflammation is a recognized contributor to muscle wasting. Research in injury and myopathy suggests that interactions between the skeletal muscle and immune cells confer a pro-inflammatory environment that influences muscle loss through several mechanisms; however, this has not been explored in the cancer setting. This study investigated the local immune environment of the muscle by identifying the phenotype of immune cell populations in the muscle and their relationship to muscle mass in cancer patients.

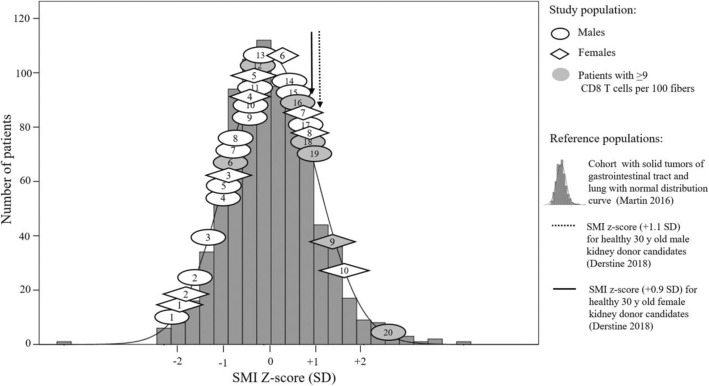
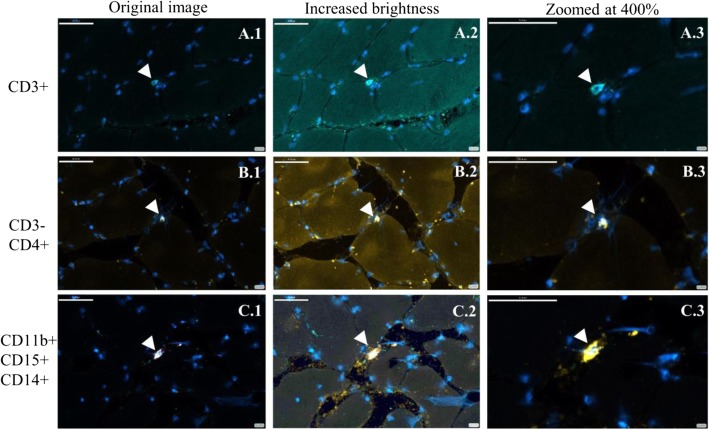
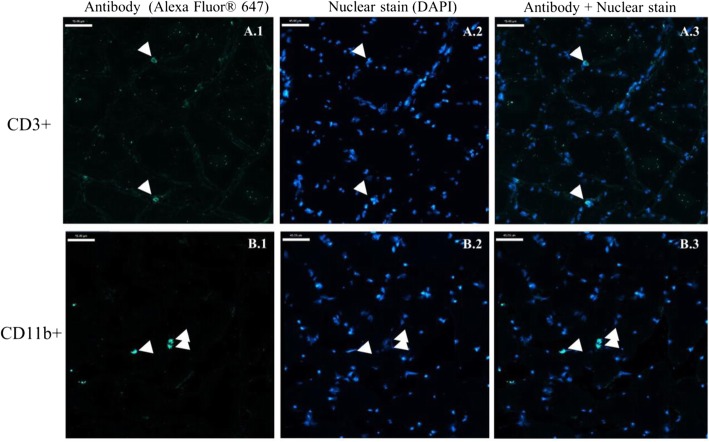
Methods: Intraoperative muscle biopsies were collected from cancer patients (n = 30, 91% gastrointestinal malignancies). Muscle mass was assessed histologically (muscle fiber cross-sectional area, CSA; μm2) and radiologically (lumbar skeletal muscle index, SMI; cm2/m2 by computed tomography, CT). T cells (CD4 and CD8) and granulocytes/phagocytes (CD11b, CD14, and CD15) were assessed by immunohistochemistry. Microarray analysis was conducted in the muscle of a second cancer patient cohort.

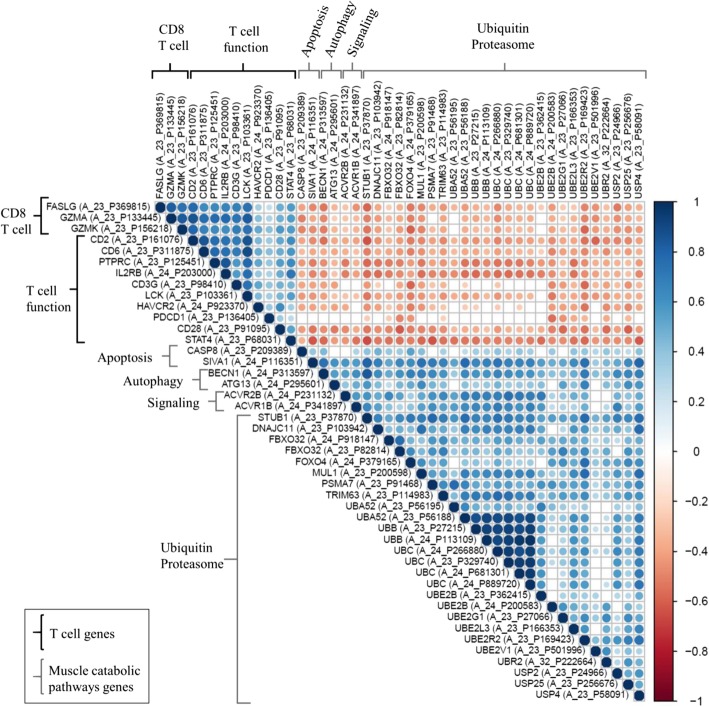
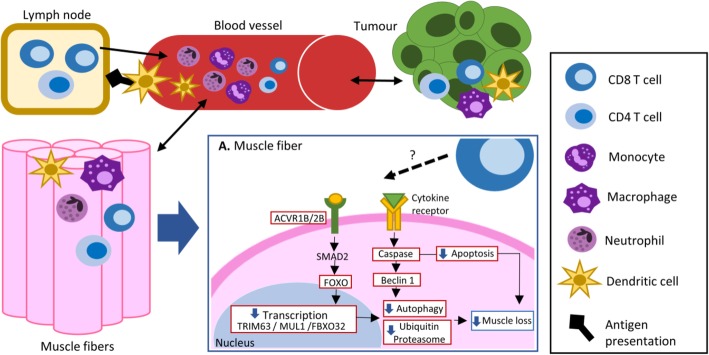
Results: T cells (CD3+), granulocytes/phagocytes (CD11b+), and CD3-CD4+ cells were identified. Muscle fiber CSA (μm2) was positively correlated (Spearman's r = > 0.45; p = < 0.05) with the total number of T cells, CD4, and CD8 T cells and granulocytes/phagocytes. In addition, patients with the smallest SMI exhibited fewer CD8 T cells within their muscle. Consistent with this, further exploration with gene correlation analyses suggests that the presence of CD8 T cells is negatively associated (Pearson's r = ≥ 0.5; p = <0.0001) with key genes within muscle catabolic pathways for signaling (ACVR2B), ubiquitin proteasome (FOXO4, TRIM63, FBXO32, MUL1, UBC, UBB, UBE2L3), and apoptosis/autophagy (CASP8, BECN1, ATG13, SIVA1).

Conclusion: The skeletal muscle immune environment of cancer patients is comprised of immune cell populations from the adaptive and innate immunity. Correlations of T cells, granulocyte/phagocytes, and CD3-CD4+ cells with muscle mass measurements indicate a positive relationship between immune cell numbers and muscle mass status in cancer patients. Further exploration with gene correlation analyses suggests that the presence of CD8 T cells is negatively correlated with components of muscle catabolism.

Keywords: Adaptive immunity; CD8 T cells; Cancer; Computed tomography; Granulocytes; Innate immunity; Muscle biopsy; Muscle catabolism; Muscle mass; Phagocytes; T cells.


Conflict of interest statement

The authors declare that they have no competing interests.

Figures

Fig. 1
Fig. 1
SMI z-scores (SD, standard deviation) for male (n = 20, circles) and female (n = 10, diamonds) patients of the current study in relation to the SMI z-score distribution (dark gray histogram) from a cancer cohort with gastrointestinal tract and lung solid tumors (n = 1473, 58% males) from the same regional cancer center [13]. SMI z-scores were calculated based on sex and age [15]. Circle and diamonds in light gray are patients with highest values of CD8 T cells per 100 fibers. Vertical arrows representing SMI z-scores (SD) for healthy 30-year-old kidney donor candidates were placed to highlight cancer patient with SMI z-score values that are similar to the healthy population [61]. Notes: Only one SMI distribution is shown indistinctively of sex, as male (n = 828) and female (n = 645) SMI distribution shapes were the same in the Martin et al. cohort [13]. SMI z-scores for healthy kidney donor candidates were calculated by subtracting Martin et al. oncological cohort mean SMI values (males: 51.5 cm2/m2/females: 41.3 cm2/m2) from Derstine et al. healthy 30-year-old mean SMI values (males: 60.9 cm2/m2/females: 47.5 cm2/m2) and divided by the SD of Martin et al. oncological cohort (males: ± 8.9/females: ± 7)
Fig. 2
Fig. 2
Immunostaining of CD3+ (A.1–A.3), CD3−CD4+ (B.1–B.3), and CD11b+CD14+CD15+ (C.1–C.3) cells pointed by the white arrows in the muscle tissue of cancer patients. Stained nuclei in blue. A.1, B.1, and C.1 are the original images with no brightness manipulation. As for images A.2, B.2, and C.2, brightness was increased to visually appreciate the location of the immune cells on the periphery of muscle fibers. A.3, B.3, and C.3 were zoomed to a 400% from the original image. Scale bar 45 μm
Fig. 3
Fig. 3
Representation of the distribution of more than one immune cell localized on a muscle cross section. Immunostaining of CD3+ (A.1–A.3) and CD11b+ (B.1–B.3). A.1 and B.1 antibody detected by Alexa Fluor® 647. A.2 and B.2 nuclear stain (DAPI). A.3 and B.3 antibody and nuclear stain. Scale bar 45 μm
Fig. 4
Fig. 4
Correlation matrix of T cells genes and muscle catabolic pathway genes. The strength of the correlation is represented by the size and color intensity of each spot, positive in blue and negative in red. Pearson’s correlation analysis. Gene arrays from the rectus abdominis muscle from the secondary male cohort (n = 69)
Fig. 5
Fig. 5
The presence of immune cells in the skeletal muscle tissue during cancer and the potential role of CD8 T cells in the muscle mass preservation. During cancer, changes in immune cell populations occur. Inflammatory mediators secreted by the tumor are capable of activating and mobilizing circulating and tissue-resident immune cells. The presence of T cells (CD8 and CD4) within the muscle tissue occurs in collaboration of antigen-presenting cells (i.e., dendritic cells) that travel from the tissues into the bloodstream and lymph nodes. Once in the muscle, cytokine secretion by T cells, granulocytes (i.e., neutrophils), and phagocytes (i.e., macrophages and dendritic cells) promote further recruitment and phenotype polarization (inflammatory or anti-inflammatory) of immune cells. A. Close-up of the muscle fiber and nucleus. Gene correlation analysis suggests an inverse relationship of CD8 T cells with diverse components (in red boxes) of muscle catabolic pathways which might impact muscle mass

Similar articles

Cited by

References

    1. Baracos VE, Martin L, Korc M, Guttridge DC, Fearon KCH. Cancer-associated cachexia. Nat Rev Dis Prim. 2018;4:17105. - PubMed
    1. Egerman MA, Glass DJ. Signaling pathways controlling skeletal muscle mass. Crit Rev Biochem Mol Biol. 2014;49:59–68. doi: 10.3109/10409238.2013.857291. - DOI - PMC - PubMed
    1. De Alvaro C, Teruel T, Hernandez R, Lorenzo M. Tumor necrosis factor α produces insulin resistance in skeletal muscle by activation of inhibitor κB kinase in a p38 MAPK-dependent manner. J Biol Chem. 2004;279:17070–17078. doi: 10.1074/jbc.M312021200. - DOI - PubMed
    1. Hohlfeld R, Engel AG. Coculture with autologous myotubes of cytotoxic T cells isolated from muscle in inflammatory myopathies. Ann Neurol. 1991;29:498–507. doi: 10.1002/ana.410290509. - DOI - PubMed
    1. Pandya JM, Venalis P, Al-Khalili L, Shahadat Hossain M, Stache V, Lundberg IE, et al. CD4+ and CD8+ CD28nullT cells are cytotoxic to autologous muscle cells in patients with polymyositis. Arthritis Rheumatol. 2016;68:2016–2026. doi: 10.1002/art.39650. - DOI - PubMed

Publication types

MeSH terms