. 2019 Dec 3;117(11):2217-2227.
doi: 10.1016/j.bpj.2019.07.055. Epub 2019 Aug 21.

DNA Sequence Is a Major Determinant of Tetrasome Dynamics

Affiliations

DNA Sequence Is a Major Determinant of Tetrasome Dynamics

Orkide Ordu et al. Biophys J. .

Abstract

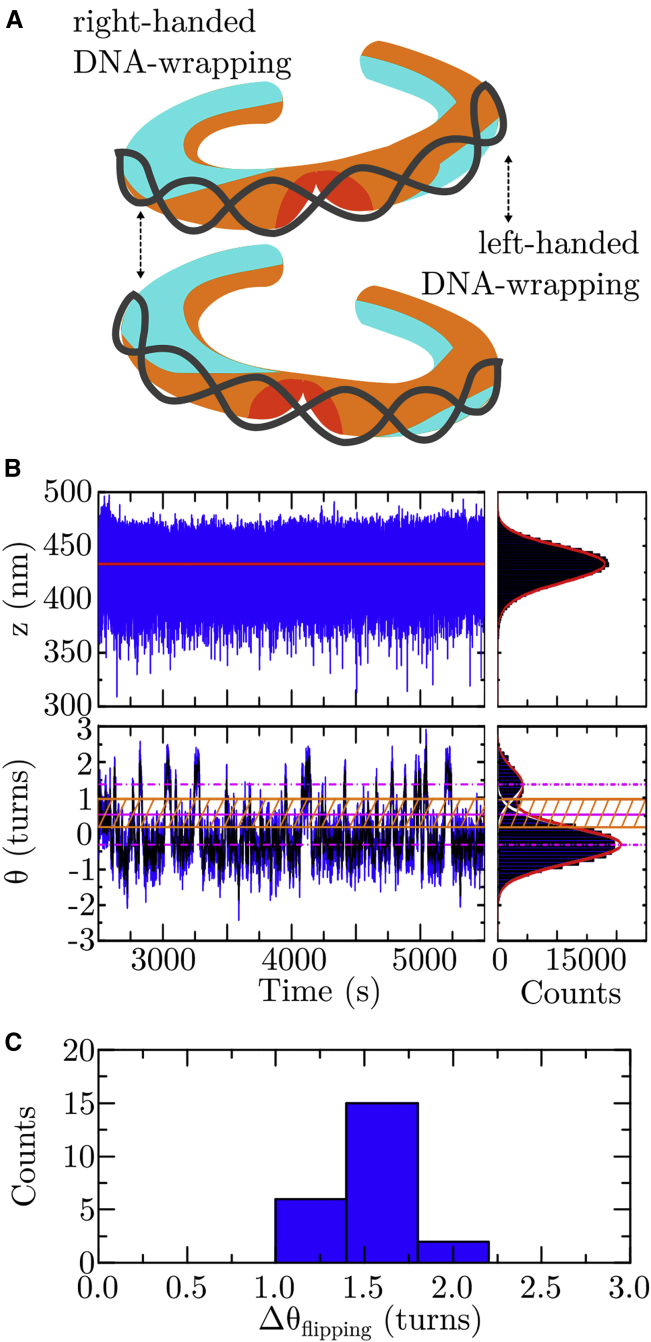
Eukaryotic genomes are hierarchically organized into protein-DNA assemblies for compaction into the nucleus. Nucleosomes, with the (H3-H4)2 tetrasome as a likely intermediate, are highly dynamic in nature by way of several different mechanisms. We have recently shown that tetrasomes spontaneously change the direction of their DNA wrapping between left- and right-handed conformations, which may prevent torque buildup in chromatin during active transcription or replication. DNA sequence has been shown to strongly affect nucleosome positioning throughout chromatin. It is not known, however, whether DNA sequence also impacts the dynamic properties of tetrasomes. To address this question, we examined tetrasomes assembled on a high-affinity DNA sequence using freely orbiting magnetic tweezers. In this context, we also studied the effects of mono- and divalent salts on the flipping dynamics. We found that neither DNA sequence nor altered buffer conditions affect overall tetrasome structure. In contrast, tetrasomes bound to high-affinity DNA sequences showed significantly altered flipping kinetics, predominantly via a reduction in the lifetime of the canonical state of left-handed wrapping. Increased mono- and divalent salt concentrations counteracted this behavior. Thus, our study indicates that high-affinity DNA sequences impact not only the positioning of the nucleosome but that they also endow the subnucleosomal tetrasome with enhanced conformational plasticity. This may provide a means to prevent histone loss upon exposure to torsional stress, thereby contributing to the integrity of chromatin at high-affinity sites.


Figures

Figure 1
Figure 1
Real-time assembly of single tetrasomes onto DNA with a 601 sequence. (A) Shown is the top view on ∼80 bp of DNA (dark gray) bound to a tetrameric protein core consisting of the histones H3 (orange) and H4 (cyan). This image was created by modifying the structural data of the Drosophila nucleosome from the Protein Data Bank (PDB) with the PDB identification code 2PYO (82) using the PyMOL Molecular Graphics System, Version 1.8 (Schrödinger, New York, NY). (B) Experimental assay based on FOMT is shown (49). A single DNA construct (black) containing a 601 sequence (red) at its center (DNAw/601) is attached to a coverslip (light blue) at one end and tethered to a superparamagnetic bead (light brown) at the other end. Above the flow cell, a cylindrically shaped permanent magnet (dark blue/red), with its axis precisely aligned with the DNA tether, exerts a constant force (F) on the bead while allowing its free rotation in the (x,y) plane (indicated by the black circular arrow). This enables the direct measurement of the DNA molecule’s length z and linking number Θ, which upon the assembly of a tetrasome (orange), are changed by Δz and ΔΘ (indicated by the red straight and circular arrows, respectively). Tetrasome assembly is induced by flushing in either (H3.1-H4)2 tetramers alone or preincubated histone/NAP1 complexes. Nonmagnetic beads attached to the flow cell surface serve as reference for drift correction. This figure is adapted from (37) (https://doi.org/10.1063/1.5009100), with the permission of AIP Publishing (Melville, NY). (C) Shown are partial time traces of the length z (in nm, top panel) and the linking number Θ (in turns, bottom panel) of a DNAw/601 molecule before and upon the assembly of a (H3.1-H4)2 tetrasome. The formation of a tetrasome simultaneously decreased both quantities in the form of a step identified using a step-finder algorithm (red lines) (Materials and Methods). About 60 s after assembly, free proteins were flushed out with measurement buffer (orange arrows) to prevent further histone binding. In this particular experiment, a tetrasome was assembled by flushing in NAP1/histone complexes (green arrows) in buffer A (Table 1). A corresponding time trace of a DNAw/601 molecule upon the assembly of a tetrasome from histone tetramers only is shown in Fig. S4. (D) Shown is a histogram of the changes in DNA length upon assembly and disassembly Δz(dis)ass (in nm, top panel) of single (H3.1-H4)2 tetrasomes (N = 27) and in DNA linking number upon assembly and disassembly ΔΘ(dis)ass (in turns, bottom panel) of single (H3.1-H4)2 tetrasomes (N = 27) in all buffers (Table 1), shown together with the mean spatial resolution corresponding to the average 1 SD (16 nm and 0.5 turns; green lines) from all experiments. Data beyond the resolution limits (hatched area) were excluded from the determination of the mean change Δz(dis)ass = 23 ± 5 nm (n = 25) and ΔΘ(dis)ass = 0.9 ± 0.2 turns (n = 26). To see this figure in color, go online.
Figure 2
Figure 2
The structural dynamics of single tetrasomes on DNA with a 601 sequence. (A) Representation of the two tetrasome conformations with the DNA wrapped in either a left-handed or a right-handed superhelix. Tetrasomes were observed to spontaneously flip between these two states (35, 36, 37). This figure is adapted from (37) (https://doi.org/10.1063/1.5009100), with the permission of AIP Publishing. (B) Shown are partial time traces of the length z (in nm, top panel) and the linking number Θ (in turns, bottom panel) of a DNA molecule after the assembly of a (H3.1-H4)2 tetrasome in buffer A (Table 1) upon flushing in histone/NAP1 complexes. As indicated from the fit by the step-finder algorithm to the time trace (red line, left panel) and the fit of a mirrored γ function (red line in histogram plot, right panel) to the skewed data, the DNA length remains constant. The DNA linking number spontaneously fluctuates (i.e., “flips”) between two states identified by fitting two Gaussian functions (white lines in histogram plot, right panel) underlying the full profile (red line in histogram plot, right panel). The two states correspond to a prevalent left-handed and a less adopted right-handed conformation of DNA wrapping, with the respective mean linking numbers Θleft = −0.31 ± 0.01 turns and Θright = +1.38 ± 0.06 turns (dashed-dotted magenta lines, 95% confidence level for estimated values). Because of drift, the mean value for Θleft obtained here is offset from the average change in DNA linking number upon tetrasome dis-/assembly (Fig. 1D, bottom panel). The structural dynamics were quantified in terms of the dwell times in the two states based on a threshold zone (hatched orange area) that is bounded by 1 SD from each mean value (orange solid lines) about their average (solid magenta line) (Materials and Methods). A corresponding partial time trace of a DNAw/601 molecule upon the assembly of a tetrasome from histone tetramers only is shown in Fig. S7. (C) Shown is a histogram of the change in DNA linking number ΔΘflipping (in turns) upon flipping of single (H3.1-H4)2 tetrasomes in their handedness of DNA wrapping in all buffers (Table 1). The data yield a mean value of ΔΘflipping = 1.6 ± 0.2 turns (N = 23). The individual values are provided in Table S9. To see this figure in color, go online.
Figure 3
Figure 3
Kinetics and energetics of single tetrasomes on DNA with a 601 sequence. (A) Shown are histograms of the dwell times of a single NAP1-loaded (H3.1-H4)2 tetrasome on a DNAw/601 molecule in the left- (left panel) and right-handed conformation (right panel) in buffer A (Tables 1 and 2). Exponential fits (red lines) yielded a mean dwell time of τD,left = 37 ± 2 s (N = 371) and τD,right = 28 + 2/−1 s (N = 373), respectively (68% confidence level for estimated values). (B) is the same as in (A) but now in buffer B (Tables 1 and 2). Exponential fits (red lines) yielded a mean dwell time of τD,left = 62 ± 3 s (N = 559) and τD,right = 33 ± 1 s (N = 564), respectively (68% confidence level for estimated values). (C) Shown are histograms of the dwell times of a single NAP1-loaded (H3.1-H4)2 tetrasome on a DNAw/601 molecule in the left-handed (top panel) and right-handed conformation (bottom panel) in buffer C (Tables 1 and 2). Exponential fits (red lines) yielded a mean dwell time of τD,left = 141 + 11/−10 s (N = 187) and τD,right = 30 ± 2 s (N = 188), respectively (68% confidence level for estimated values). All data in (A)–(C) were obtained by dwell-time analysis of the DNA linking number time traces filtered by averaging over 3.3 s (N = 330) (Materials and Methods). (D) Schematic energy diagrams of single NAP1-loaded tetrasomes on DNAw/601 in all buffer conditions are based on the dwell-time values and the probabilities obtained from the linking number distributions (Tables 2, S11, and S13–S15). The solid black lines illustrate the energy levels in buffer A (Table 1) for a NAP1-loaded (H3.1-H4)2 tetrasome on DNArandom, whereas the solid blue lines depict the energetics for a NAP1-loaded (H3.1-H4)2 tetrasome on DNAw/601. The green and orange dashed lines show the energy levels for a NAP1-loaded (H3.1-H4)2 tetrasome on DNAw/601 in buffers B and C, respectively. The free energy differences (ΔE) between the left- and right-handed conformations of tetrasomes on DNAw/601, with the respective energies Eleft and Eright, are considerably decreased compared to tetrasomes loaded onto DNArandom (Table 2). The heights of the energy barriers ΔGleft and ΔGright are estimated from the rates kl->r and kr->l, respectively. For tetrasomes on DNAw/601 relative to DNArandom in buffer A, ΔGleft decreases strongly, whereas ΔGright is largely unchanged. In the presence of mono- and divalent salts in buffers B and C, tetrasomes on DNAw/601 become considerably longer lived in the left-handed conformation (i.e., ΔGleft is higher) compared with tetrasomes on DNAw/601 in buffer A, whereas the right-handed state (hence ΔGright) remains essentially unaltered. To see this figure in color, go online.

Similar articles

Cited by

References

    1. Kornberg R.D. Chromatin structure: a repeating unit of histones and DNA. Science. 1974;184:868–871. - PubMed
    1. Olins A.L., Olins D.E. Spheroid chromatin units (v bodies) Science. 1974;183:330–332. - PubMed
    1. Oudet P., Gross-Bellard M., Chambon P. Electron microscopic and biochemical evidence that chromatin structure is a repeating unit. Cell. 1975;4:281–300. - PubMed
    1. Richmond T.J., Finch J.T., Klug A. Structure of the nucleosome core particle at 7 A resolution. Nature. 1984;311:532–537. - PubMed
    1. Luger K., Mäder A.W., Richmond T.J. Crystal structure of the nucleosome core particle at 2.8 A resolution. Nature. 1997;389:251–260. - PubMed

Publication types

LinkOut - more resources