. 2019 Oct 23;9(4):366-374.e5.
doi: 10.1016/j.cels.2019.08.005. Epub 2019 Sep 11.

High-Throughput Assessment of Kinome-wide Activation States

Affiliations

High-Throughput Assessment of Kinome-wide Activation States

Thierry Schmidlin et al. Cell Syst. .

Abstract

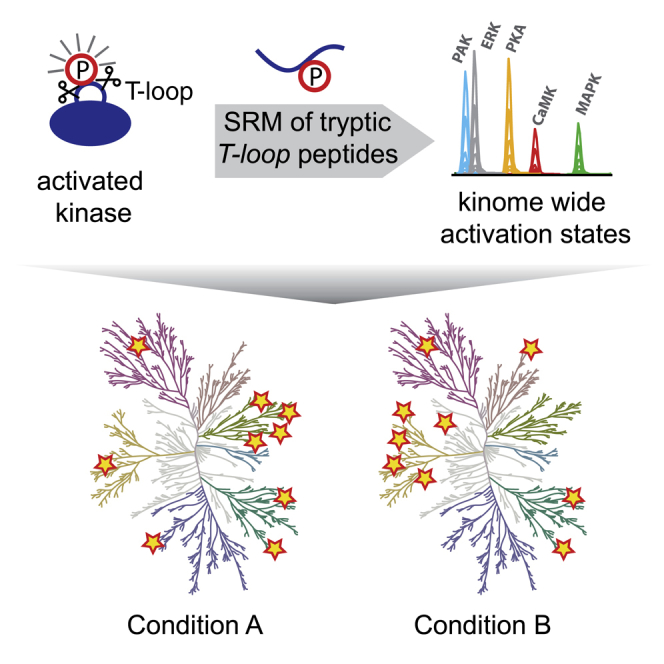
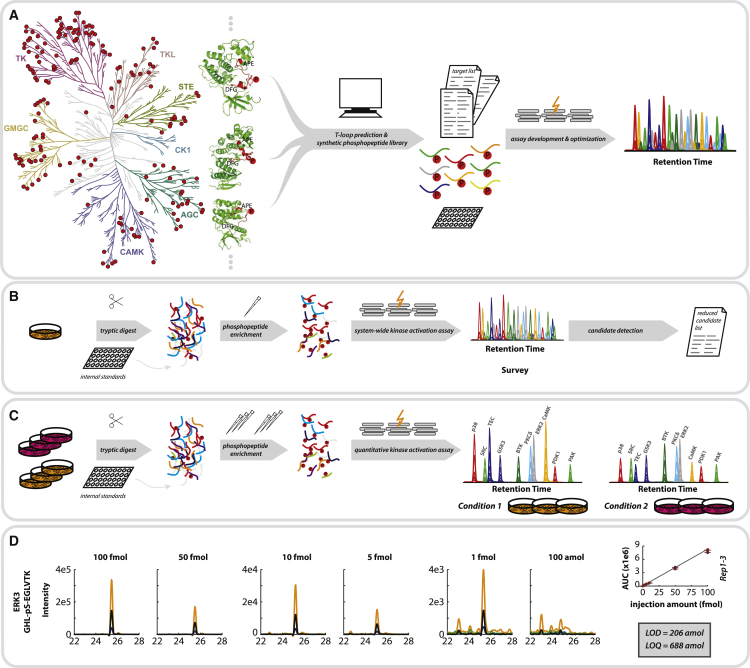
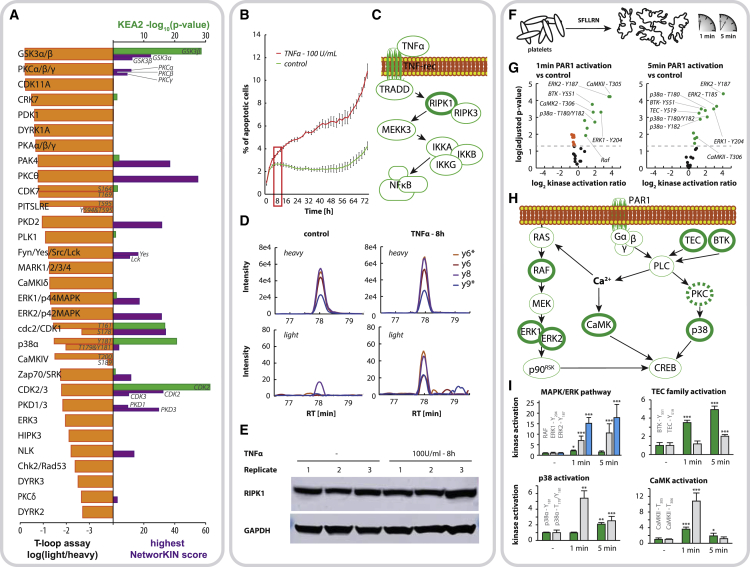
Aberrant kinase activity has been linked to a variety of disorders; however, methods to probe kinase activation states in cells have been lacking. Until now, kinase activity has mainly been deduced from either protein expression or substrate phosphorylation levels. Here, we describe a strategy to directly infer kinase activation through targeted quantification of T-loop phosphorylation, which serves as a critical activation switch in a majority of protein kinases. Combining selective phosphopeptide enrichment with robust targeted mass spectrometry, we provide highly specific assays for 248 peptides, covering 221 phosphosites in the T-loop region of 178 human kinases. Using these assays, we monitored the activation of 63 kinases through 73 T-loop phosphosites across different cell types, primary cells, and patient-derived tissue material. The sensitivity of our assays is highlighted by the reproducible detection of TNF-α-induced RIPK1 activation and the detection of 46 T-loop phosphorylation sites from a breast tumor needle biopsy.

Keywords: SRM; T-loop phosphorylation; cancer; kinase; kinase activity; phosphoproteomics; proteomics; signaling; targeted mass spectrometry.


Conflict of interest statement

Patent applicant, Utrecht Holding; name of inventor(s), M.A. and T.S.; application number, EP18179104.7; status of application, pending; specific aspect of the manuscript covered in the patent application, method for monitoring kinase activity in a sample. M.A. is a scientific advisor for Pepscope.

Figures

None
Graphical abstract
Figure 1
Figure 1
Targeted Quantification of T-Loop Phosphorylation to Determine Kinase Activation (A) Conserved activation sites were determined based on sequence homologies on a kinome-wide scale. A target list was developed containing phosphorylation sites accessible by tryptic digest covering 33% of the human kinome. Heavy-isotope-labeled peptides were synthesized for all entries of the target list and used for nanoLC-SRM assay development. (B and C) Samples were subjected to tryptic digest and automated phosphopeptide enrichment using Fe(III)-IMAC on an Agilent Bravo AssayMap. Heavy-isotope-labeled synthetic phosphopeptides were used as internal standards. (B) The survey mode allows screening for kinase activation states for all 178 kinases in one LC-MS run using a limited number of transitions per peptide. (C) The quantification mode employs more transitions per peptide allowing for accurate quantification of kinase activation states across different conditions, including confident phosphosites localization and high tolerance to interferences. (D) LOD and LOQ values were determined for a subset of phosphopeptides exemplified for the peptide GHL-pS-EGLVTK, representing ERK3. Response rates of the phosphopeptide were determined within a representative phosphopeptide background for known concentrations in triplicate. Variations in the linear regressions were then used to determine LOD and LOQ values according to the formulas LOD = 3Sa/b and LOQ = 10Sa/b (b = slope and Sa = standard deviation of the intercept). Error bars represent standard deviation observed for triplicate measurements.
Figure 2
Figure 2
Probing Kinase Activation in Varying Cellular Systems (A) Determining kinase activation by targeted measurement of T-loop phosphorylations versus modeling of kinase activities from substrate detection in large shotgun proteomic datasets: orange bars represent the relative abundance of T-loop phosphorylations in Jurkat cells estimated by their intensity ratio to the heavy-isotope-labeled standard peptides; green and purple bars represent kinase activity prediction by KEA2 (result as p values, green bars) and NetworKIN (depicted as highest individual score found for any substrate, purple bars) when applied to a fractionated Jurkat cell sample analyzed in shotgun MS (>11,600 phosphopeptides). (B) Alterations in kinase activation upon TNF-α treatment: Jurkat cells were grown with and without TNF-α stimulation for 8 h, resulting in an increased rate of cell death as determined by caspase-3/7 green apoptosis reagent (n = 4 for both groups, error bars depicting standard deviation). (C) TNF-α induces the recruitment of receptor-interacting protein serine-threonine kinases (RIPKs) to the TNF-receptor complex, resulting in its activation and initiation of necroptotic signaling. (D) RIPK1 activation through phosphorylation at S161 measured by SRM under both conditions. Representative SRM traces are shown for unstimulated and stimulated cells with upper panels representing internal heavy-labeled standard peptides and lower panels representing signals from endogenous peptides ( indicates neutral loss of phosphoric acid on the fragment ions). (E) Immunoblot analysis demonstrates equal protein expression levels of RIPK1 under both conditions. (F) Kinase activity profiling in PAR1-activated human blood platelets: platelets were activated with SFLLRN-NH2 hexapeptide, mimicking thrombin activation for 1 and 5 min, respectively. (G) Volcano plots depict changes in overall kinase activation upon PAR1 activation of platelets for 1 and 5 min, respectively (significance cutoff p < 0.05). (H) Signaling network depicts known downstream signaling pathways of PAR1, highlighting key players where increased T-loop phosphorylation could be monitored in our assay (solid bold green). Baseline PKC activity could be detected for various PKC isozymes but with no significant change in activation upon PAR1 activation (outlined in dashed bold green). (I) Bar graphs show representative dynamic regulation of kinase activation for key players in the pathway, i.e., p38α, CaMK2, RAF, ERK, BTK, and TEC (quantification based on heavy-to-light ratio, normalized on Ctrl sample, error bars depict standard deviation, p ≤ 0.05; ∗∗p ≤ 0.01; ∗∗∗p ≤ 0.001).
Figure 3
Figure 3
Probing Kinase Activation in Patient-Derived Samples (A) Reorganization of kinase activities upon acquired BRAF inhibitor resistance in melanoma: matched melanoma cell lines were established from patient-derived xenografts (PDXs) from the same patient before and after acquired resistance to the BRAF inhibitor PLX-4720, giving rise to a model system comprising treatment naive, treatment sensitive, and treatment resistant cell lines. (B) Pairwise comparison of kinase activation between the 3 conditions is depicted as volcano plot using an arbitrary significance cutoff (p < 0.05). (C) Molecular function of ERK4, which is part of a highly confined molecular system, together with ERK3 and MK5. Bar plots show the detected abundance of the T-loop phosphorylations for ERK3, ERK4, and MK5 (normalized to values observed in naive cells, error bars depicting standard deviation, p ≤ 0.05; ∗∗p ≤ 0.01; ∗∗∗p ≤ 0.001). (D) Determining kinase activation states in a breast cancer needle biopsy: proteins were extracted from half a needle biopsy (<5 mg of tissue), followed by tryptic digest, phosphopeptide enrichment by Fe(III)-IMAC, and global kinase activation screening by nanoLC-SRM. (E) The detected kinases span a dynamic range of more than 3 orders of magnitude, as estimated by their intensity ratio to the heavy-isotope-labeled standard peptide (assuming roughly equimolar internal standard concentration). (F) Selected kinases detected in their activated state are shown in the context of their molecular signaling pathway according to the Kegg database (outlined in bold green).

References

    1. Abelin J.G., Patel J., Lu X., Feeney C.M., Fagbami L., Creech A.L., Hu R., Lam D., Davison D., Pino L. Reduced-representation phosphosignatures measured by quantitative targeted ms capture cellular states and enable large-scale comparison of drug-induced phenotypes. Mol. Cell. Proteomics. 2016;15:1622–1641. - PMC - PubMed
    1. Annibaldi A., Meier P. Checkpoints in TNF-induced cell death: implications in inflammation and cancer. Trends Mol. Med. 2018;24:49–65. - PubMed
    1. Atkinson B.T., Ellmeier W., Watson S.P. Tec regulates platelet activation by GPVI in the absence of Btk. Blood. 2003;102:3592–3599. - PubMed
    1. Bantscheff M., Eberhard D., Abraham Y., Bastuck S., Boesche M., Hobson S., Mathieson T., Perrin J., Raida M., Rau C. Quantitative chemical proteomics reveals mechanisms of action of clinical ABL kinase inhibitors. Nat. Biotechnol. 2007;25:1035–1044. - PubMed
    1. Batth T.S., Francavilla C., Olsen J.V. Off-line high-pH reversed-phase fractionation for in-depth phosphoproteomics. J. Proteome Res. 2014;13:6176–6186. - PubMed

Publication types

Substances