

Mucin O-glycans facilitate symbiosynthesis to maintain gut immune homeostasis
- PMID: 31521614
- PMCID: PMC6838389
- DOI: 10.1016/j.ebiom.2019.09.008
Mucin O-glycans facilitate symbiosynthesis to maintain gut immune homeostasis
Abstract
Background: The dysbiosis of gut microbiota has been implicated in the pathogenesis of inflammatory bowel diseases; however, the underlying mechanisms have not yet been elucidated. Heavily glycosylated mucin establishes a first-line barrier against pathogens and serves as a niche for microbial growth.
Methods: To elucidate relationships among dysbiosis, abnormal mucin utilisation, and microbial metabolic dysfunction, we analysed short-chain fatty acids (SCFAs) and mucin components in stool samples of 40 healthy subjects, 49 ulcerative colitis (UC) patients, and 44 Crohn's disease (CD) patients from Japan.
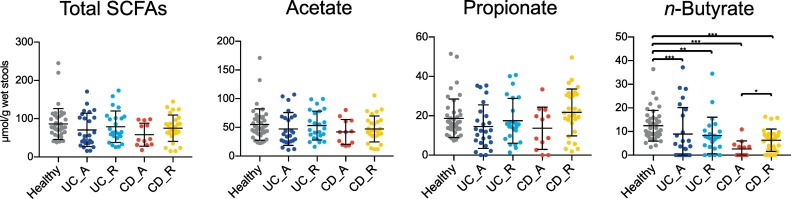
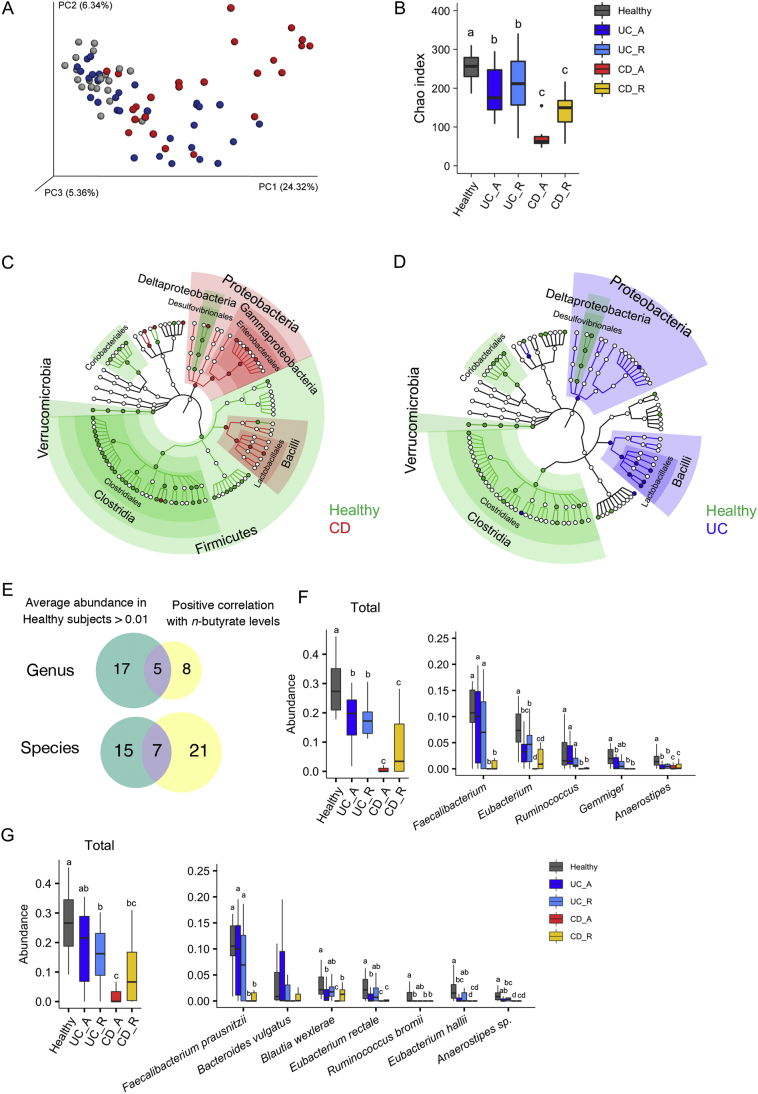
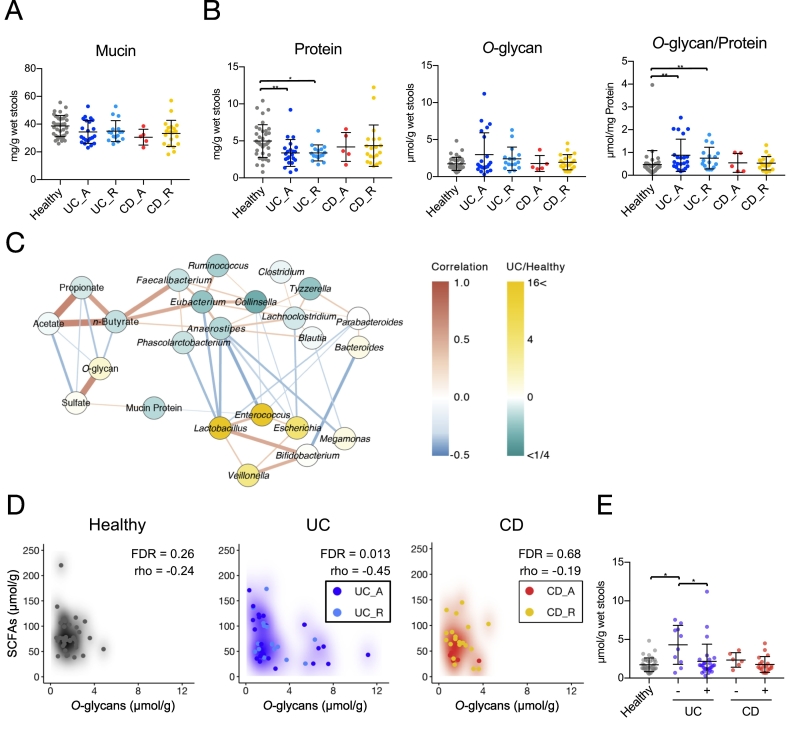
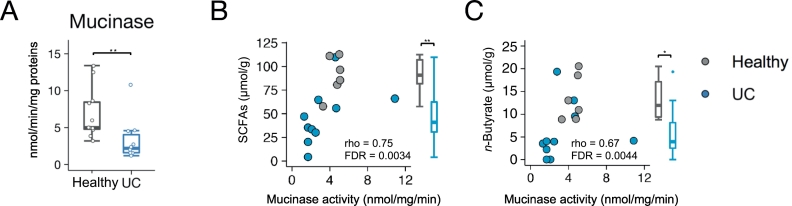
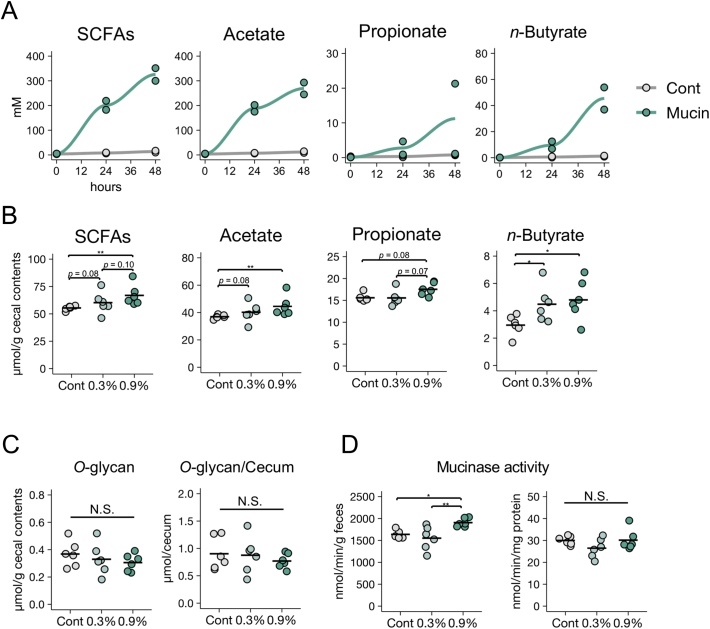
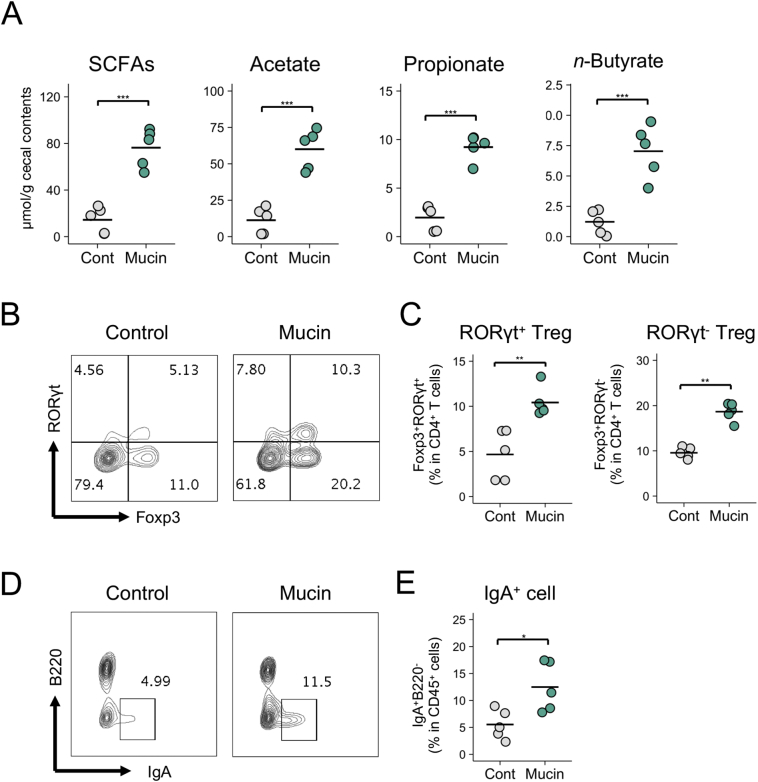
Findings: Levels of n-butyrate were significantly lower in stools of both CD and UC patients than in stools of healthy subjects. Correlation analysis identified seven bacterial species positively correlated with n-butyrate levels; the major n-butyrate producer, Faecalibacterium prausnitzii, was particularly underrepresented in CD patients, but not in UC patients. In UC patients, there were inverse correlations between mucin O-glycan levels and the production of SCFAs, such as n-butyrate, suggesting that mucin O-glycans serve as an endogenous fermentation substrate for n-butyrate production. Indeed, mucin-fed rodents exhibited enhanced n-butyrate production, leading to the expansion of RORgt+Treg cells and IgA-producing cells in colonic lamina propria. Microbial utilisation of mucin-associated O-glycans was significantly reduced in n-butyrate-deficient UC patients.
Interpretation: Mucin O-glycans facilitate symbiosynthesis of n-butyrate by gut microbiota. Abnormal mucin utilisation may lead to reduced n-butyrate production in UC patients. FUND: Japan Society for the Promotion of Science, Health Labour Sciences Research Grant, AMED-Crest, AMED, Yakult Foundation, Keio Gijuku Academic Development Funds, The Aashi Grass Foundation, and The Canon Foundation.
Keywords: Butyrate; Inflammatory bowel disease; Microbiota; Mucin.
Copyright © 2019 The Authors. Published by Elsevier B.V. All rights reserved.
Conflict of interest statement
The authors have declared that no competing interests exist.
Figures
Similar articles
-
Mucin-Derived O-Glycans Act as Endogenous Fiber and Sustain Mucosal Immune Homeostasis via Short-Chain Fatty Acid Production in Rat Cecum.J Nutr. 2020 Oct 12;150(10):2656-2665. doi: 10.1093/jn/nxaa097. J Nutr. 2020. PMID: 32286621
-
The role of mucin O-glycans in microbiota dysbiosis, intestinal homeostasis, and host-pathogen interactions.Am J Physiol Gastrointest Liver Physiol. 2023 Jun 1;324(6):G452-G465. doi: 10.1152/ajpgi.00261.2022. Epub 2023 Apr 18. Am J Physiol Gastrointest Liver Physiol. 2023. PMID: 37070751 Review.
-
Mucin O-glycan-microbiota axis orchestrates gut homeostasis in a diarrheal pig model.Microbiome. 2022 Aug 31;10(1):139. doi: 10.1186/s40168-022-01326-8. Microbiome. 2022. PMID: 36045454 Free PMC article.
-
Differential contributions of the gut microbiota and metabolome to pathomechanisms in ulcerative colitis: an in vitro analysis.Gut Microbes. 2024 Jan-Dec;16(1):2424913. doi: 10.1080/19490976.2024.2424913. Epub 2024 Nov 13. Gut Microbes. 2024. PMID: 39535140 Free PMC article.
-
Mucin-type O-glycans and their roles in intestinal homeostasis.Glycobiology. 2013 Sep;23(9):1026-37. doi: 10.1093/glycob/cwt045. Epub 2013 Jun 10. Glycobiology. 2013. PMID: 23752712 Free PMC article. Review.
Cited by
-
Total Gastrointestinal Flora Transplantation in the Treatment of Leaky Gut Syndrome and Flora Loss.Cureus. 2022 Nov 3;14(11):e31071. doi: 10.7759/cureus.31071. eCollection 2022 Nov. Cureus. 2022. PMID: 36475195 Free PMC article.
-
Polyphenols as Drivers of a Homeostatic Gut Microecology and Immuno-Metabolic Traits of Akkermansia muciniphila: From Mouse to Man.Int J Mol Sci. 2022 Dec 20;24(1):45. doi: 10.3390/ijms24010045. Int J Mol Sci. 2022. PMID: 36613488 Free PMC article. Review.
-
Alteration of microbiota antibody-mediated immune selection contributes to dysbiosis in inflammatory bowel diseases.EMBO Mol Med. 2022 Aug 8;14(8):e15386. doi: 10.15252/emmm.202115386. Epub 2022 Jul 4. EMBO Mol Med. 2022. PMID: 35785473 Free PMC article.
-
CoMA - an intuitive and user-friendly pipeline for amplicon-sequencing data analysis.PLoS One. 2020 Dec 2;15(12):e0243241. doi: 10.1371/journal.pone.0243241. eCollection 2020. PLoS One. 2020. PMID: 33264369 Free PMC article.
-
Nucleotide binding as an allosteric regulatory mechanism for Akkermansia muciniphila β-N-acetylhexosaminidase Am2136.Gut Microbes. 2022 Jan-Dec;14(1):2143221. doi: 10.1080/19490976.2022.2143221. Gut Microbes. 2022. PMID: 36394293 Free PMC article.
References
-
- Kamada N., Seo S.-U.U., Chen G.Y., Núñez G. Role of the gut microbiota in immunity and inflammatory disease. Nat Rev Immunol. 2013;13:321–335. - PubMed
MeSH terms
Substances
LinkOut - more resources
Full Text Sources
Other Literature Sources
Miscellaneous
