. 2019 Sep 19;179(1):219-235.e21.
doi: 10.1016/j.cell.2019.08.032. Epub 2019 Sep 12.

UVB-Induced Tumor Heterogeneity Diminishes Immune Response in Melanoma

Affiliations

UVB-Induced Tumor Heterogeneity Diminishes Immune Response in Melanoma

Yochai Wolf et al. Cell. .

Abstract

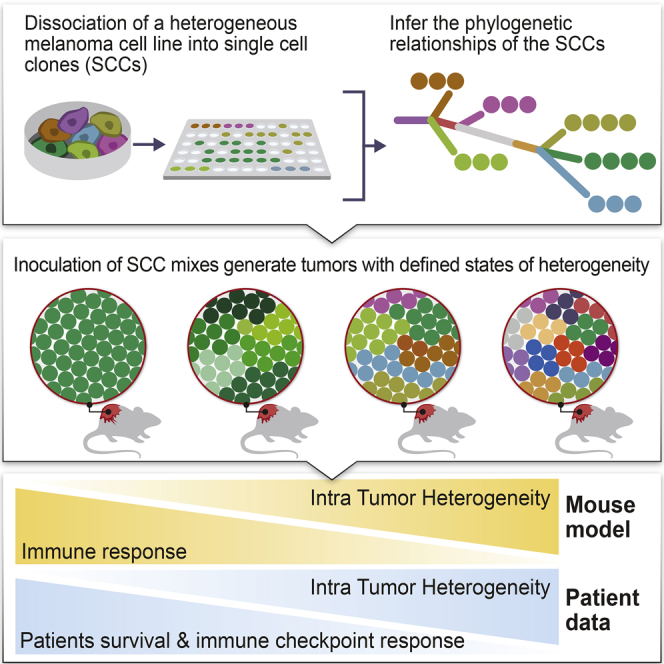
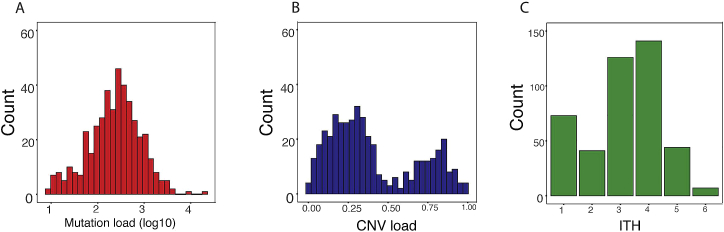
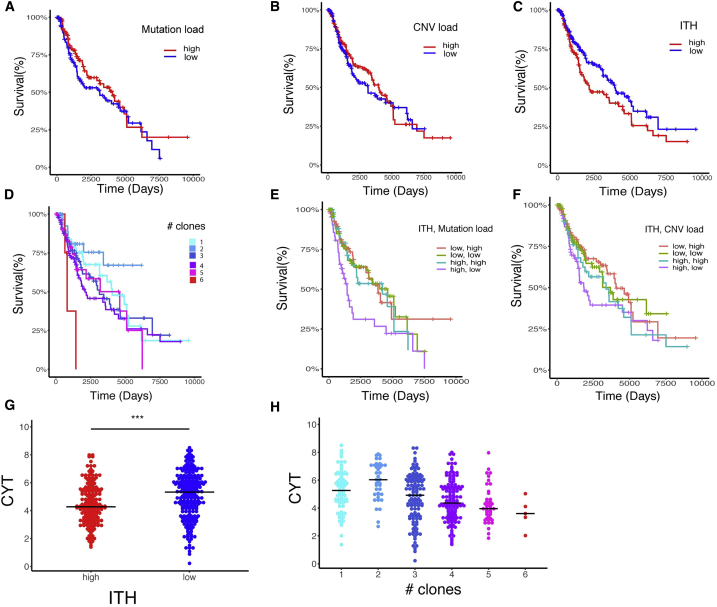
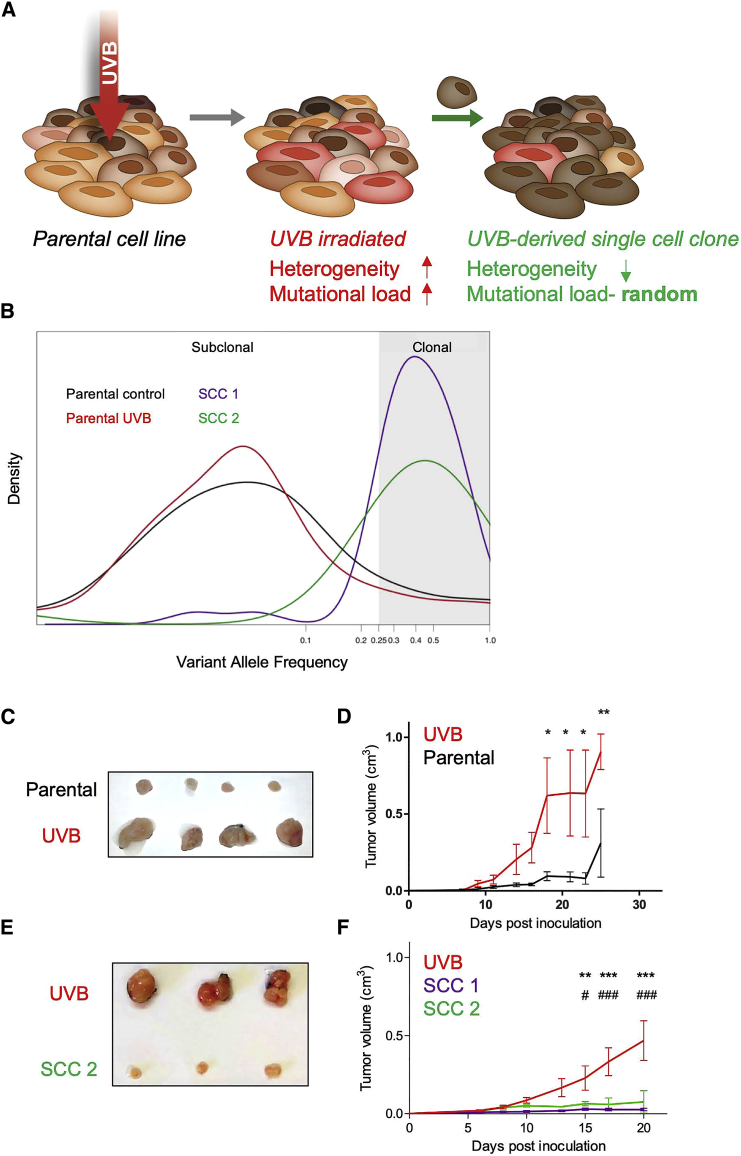
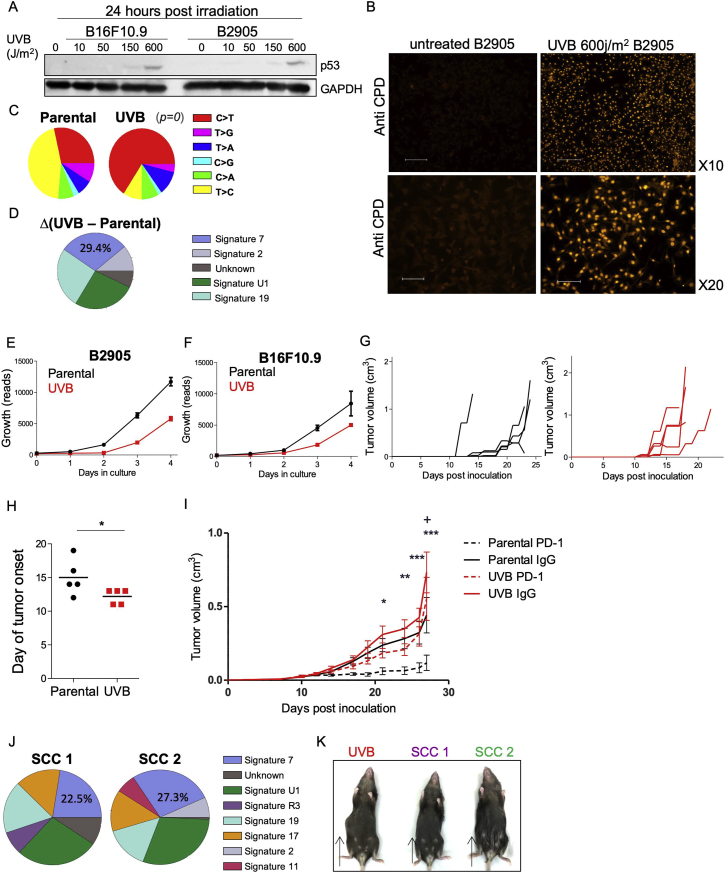
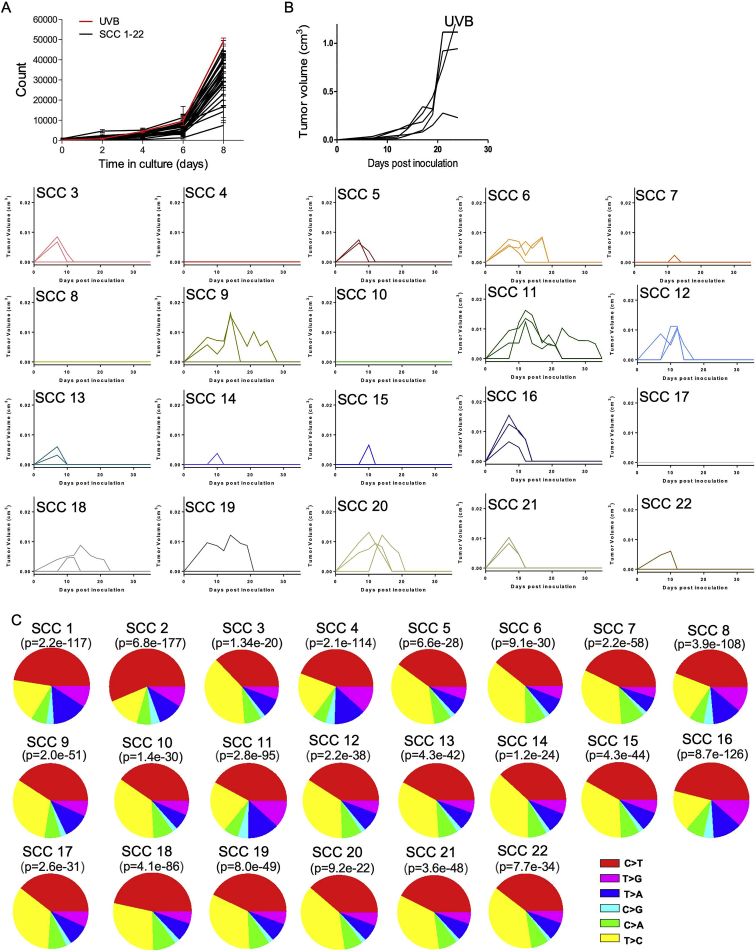
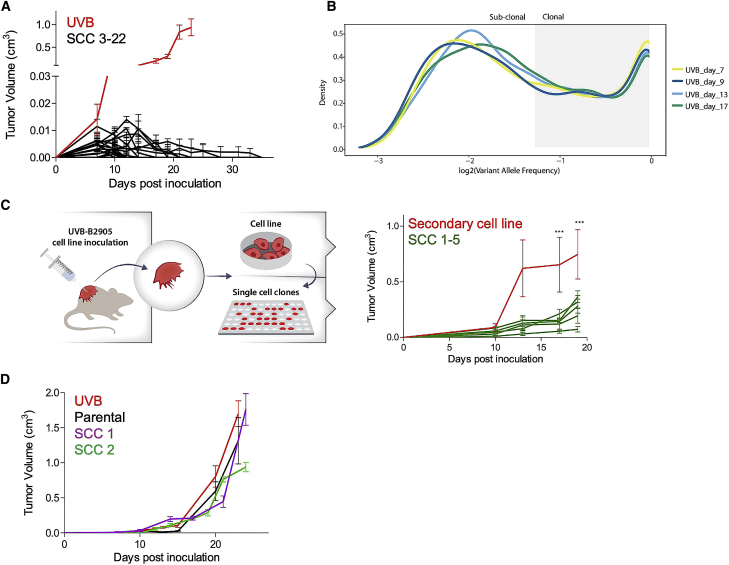
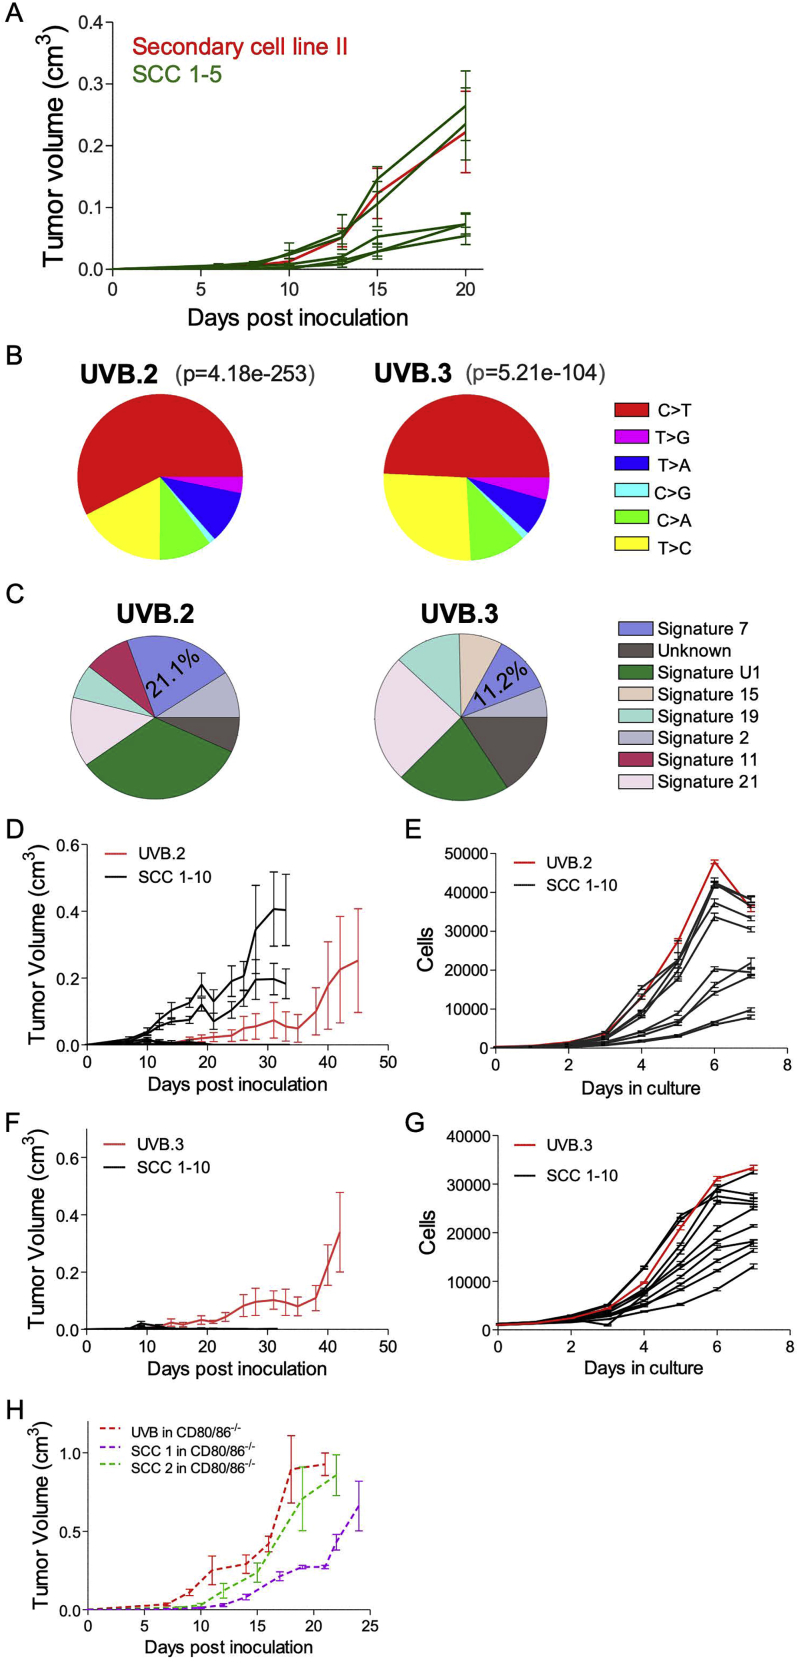
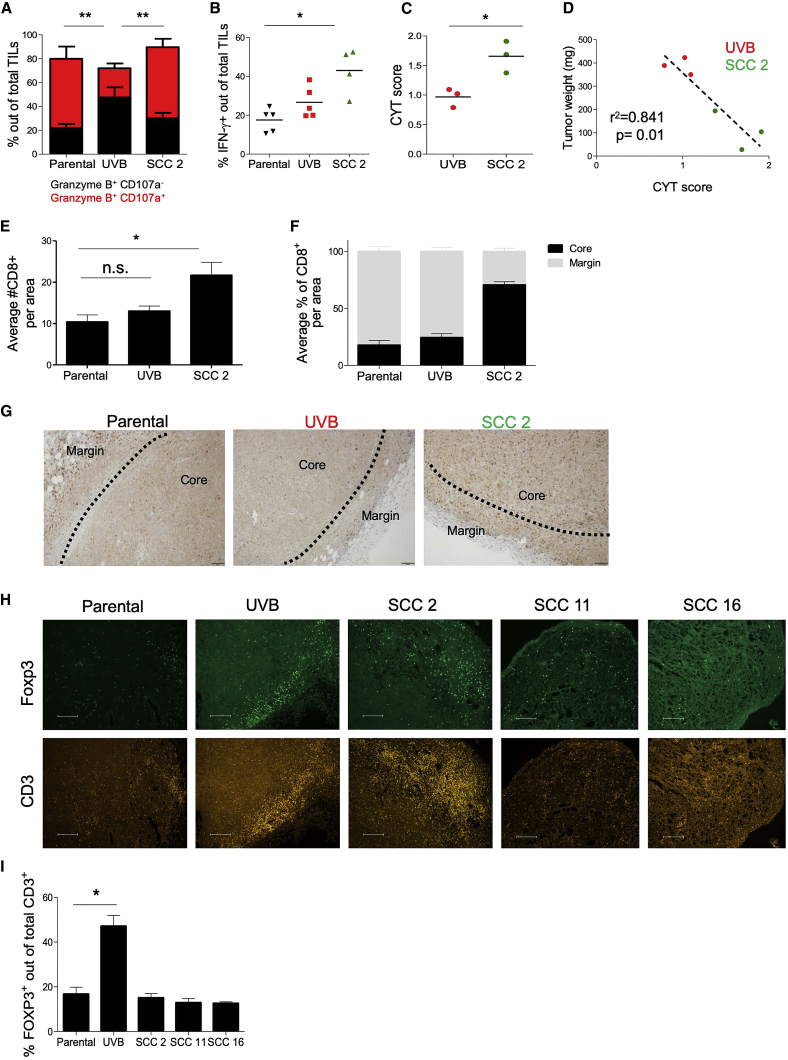
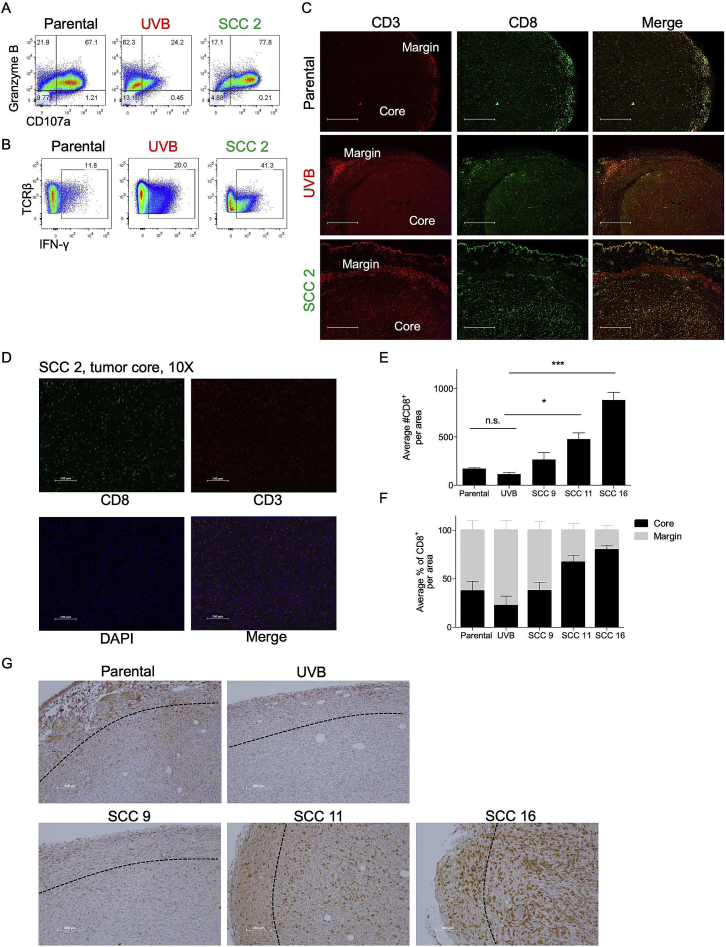
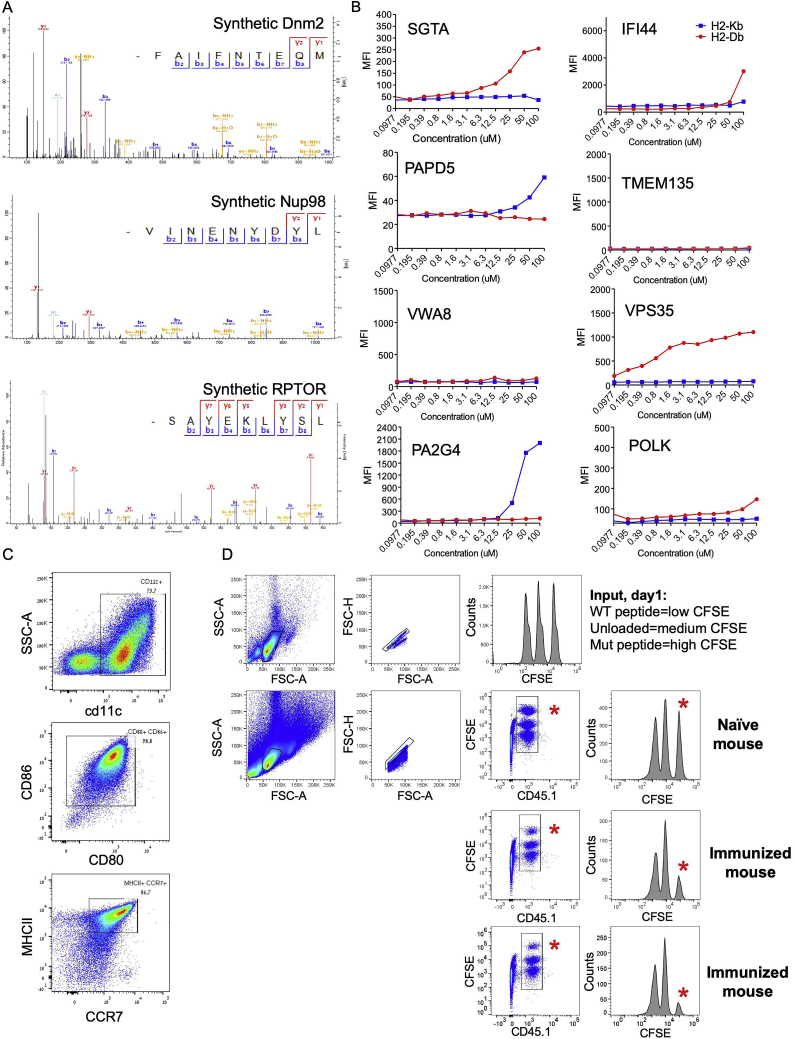
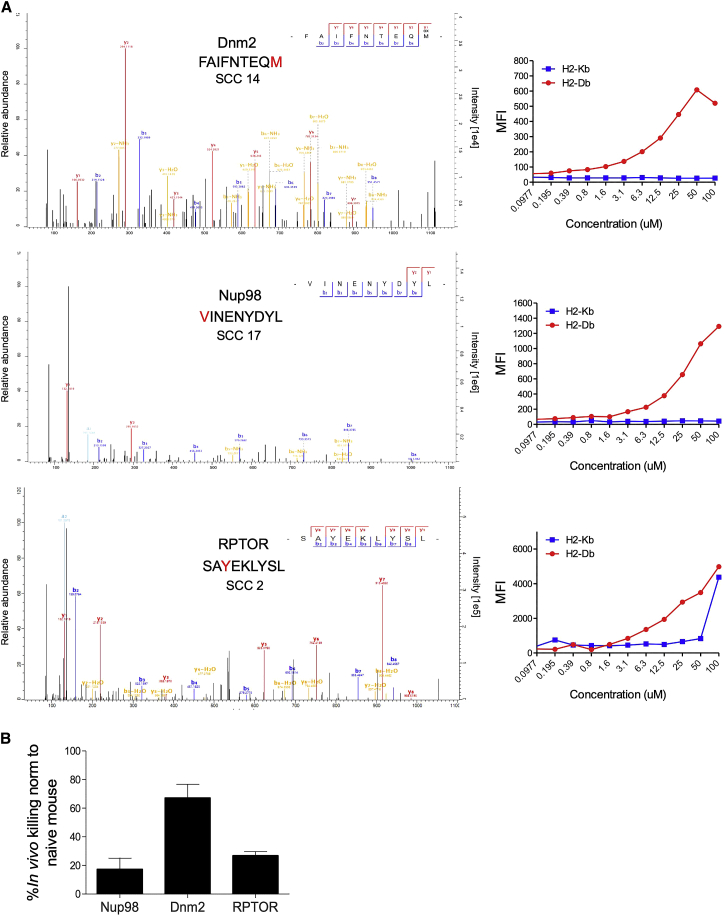
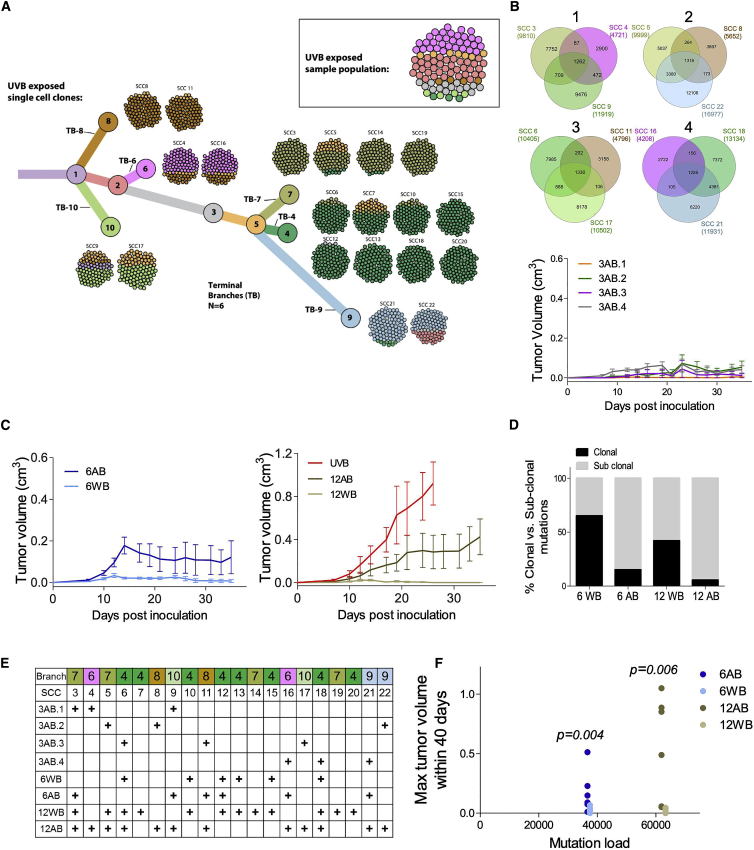
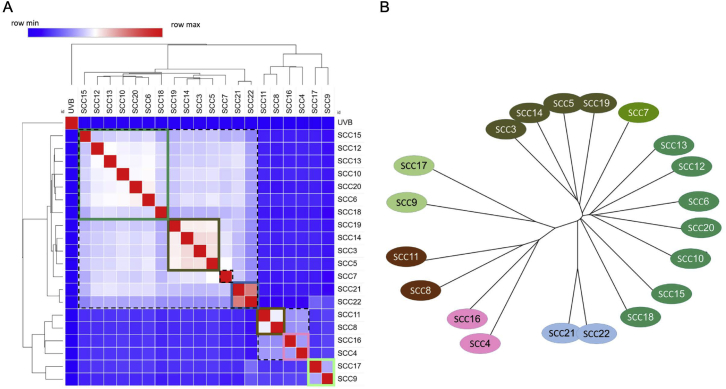
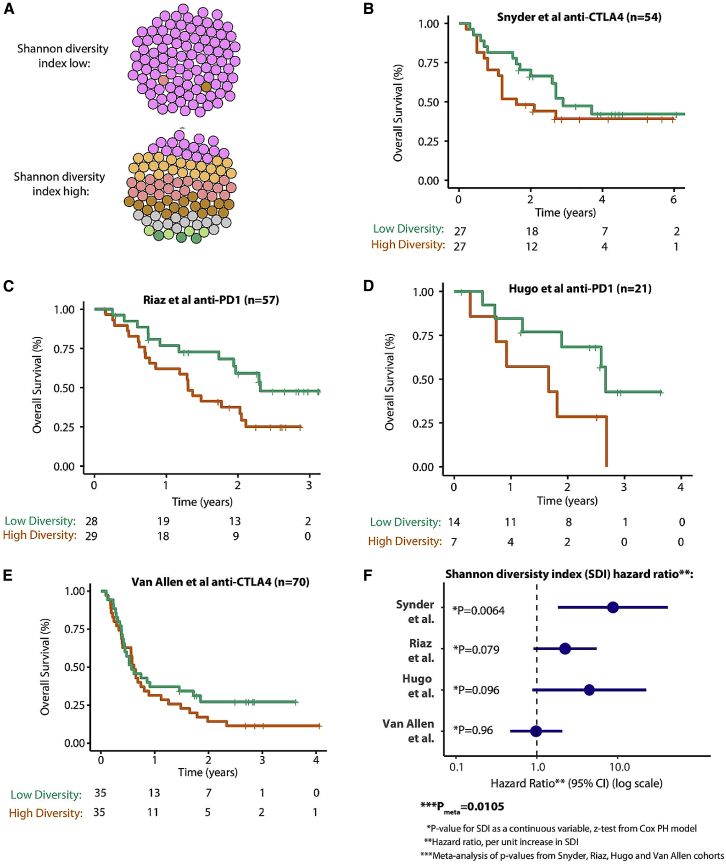
Although clonal neo-antigen burden is associated with improved response to immune therapy, the functional basis for this remains unclear. Here we study this question in a novel controlled mouse melanoma model that enables us to explore the effects of intra-tumor heterogeneity (ITH) on tumor aggressiveness and immunity independent of tumor mutational burden. Induction of UVB-derived mutations yields highly aggressive tumors with decreased anti-tumor activity. However, single-cell-derived tumors with reduced ITH are swiftly rejected. Their rejection is accompanied by increased T cell reactivity and a less suppressive microenvironment. Using phylogenetic analyses and mixing experiments of single-cell clones, we dissect two characteristics of ITH: the number of clones forming the tumor and their clonal diversity. Our analysis of melanoma patient tumor data recapitulates our results in terms of overall survival and response to immune checkpoint therapy. These findings highlight the importance of clonal mutations in robust immune surveillance and the need to quantify patient ITH to determine the response to checkpoint blockade.

Keywords: anti-tumor immunity; cancer neoantigens; checkpoint immunotherapy; intra-tumor heterogeneity; melanoma; mouse model; mutational load.


Conflict of interest statement

C.S. declares the following receipt of grants/research support: Pfizer, AstraZeneca, BMS, Roche Ventana. Receipt of honoraria, consultancy, or SAB Member fees: Pfizer, Novartis, GlaxoSmithKline, MSD, BMS, Celgene, AstraZeneca, Illumina, Sarah Canon Research Institute, Genentech, Roche-Ventana, GRAIL, Medicxi Advisor for Dynamo Therapeutics. Stock shareholder: Apogen Biotechnologies, Epic Bioscience, GRAIL. Co-Founder & stock options: Achilles Therapeutics. K.L. reports speaker fees from Roche Tissue Diagnostics and patents pending on indel burden as a predictor of checkpoint inhibitor response and targeting of frameshift neoantigens for personalised immunotherapy.

Figures

None
Graphical abstract
Figure S1
Figure S1
Characteristics of Human Melanoma TCGA Data, Related to Figure 1 A) Distribution of the somatic mutation load (silent + non-silent) on a log10 scale. B) Distribution of CNV load – defined as fraction of the genome affected by CNV. C) Distribution of the overall intra tumor heterogeneity estimated using CHAT (See STAR Methods).
Figure 1
Figure 1
Analysis of the Association between ITH, Mutational Load, and Patient Survival across TCGA Skin Cutaneous Melanoma Samples (A) Kaplan-Meier survival curves (time is measured in days on the x axis) of patients with high versus low mutational load. Log rank statistics: 1.96, p = 0.16. (B) Kaplan-Meier survival curves of patients with high versus low CNV load. Log rank statistics: 0.31, p = 0.577. (C) Kaplan-Meier survival curves of patient with high versus low ITH. Log rank statistics: 3.97, p = 0.046. (D) Kaplan-Meier survival curves for patients segregated by their number of clones. (E) Kaplan-Meier survival curves of patients segregated based on the combination of mutational load and ITH. Log rank statistics: 9.2, p = 0.0267. (F) Kaplan-Meier survival curves of patients segregated based on the combination of CNV load and ITH. Log rank statistics: 4.57, p = 0.206. (G) CYT score (in log scale) of patients with high versus low ITH. ∗∗∗p < 0.001, Wilcoxon’s test. (H) CYT score (in log scale) of patients segregated by their number of clones. Spearman’s rho: −0.27, p < 0.001. For further information regarding the analyses, please refer to STAR Methods and Figure S1.
Figure 2
Figure 2
Differential Heterogeneity Induces Differential Tumor Growth In Vivo (A) Scheme of experimental design for generating UVB-irradiated cells and generating SCCs derived from UVB-irradiated cells. Cell lines are irradiated by UVB at dosage of 600 J/m2; from these irradiated cells, SCCs are generated. (B) Distribution of variant allele frequencies (VAFs) of parental B2905 cells (black), UVB-irradiated B2905 cells (red), SCC 1 (purple), and SCC 2 (green) in log2 space. VAF > 0.25 (log2 = −2) is considered clonal. (C) Tumors excised from mice inoculated with either parental or UVB-irradiated cell lines on day 15 after inoculation. (D) In vivo tumor growth in mice inoculated with parental B2905 cells (black) and UVB-irradiated cells (red). n = 3–4; data are representative of three independent experiments. Data are mean ± SEM. p < 0.05, ∗∗∗p < 0.001, two-way ANOVA followed by Bonferroni’s post hoc test. (E) Tumors excised from UVB-irradiated B2905 cells versus SCC 2, day 19. (F) In vivo growth of tumors in mice inoculated with UVB (red) or SCC 1 (purple) and SCC 2 (green). n = 4–5; data are representative of two independent experiments. Data are mean ± SEM. ∗∗p < 0.01∗∗∗p < 0.001, two-way ANOVA followed by Bonferroni’s post hoc test. refers to UVB and SSC 1 comparisons; # refers to UVB and SSC 2 comparisons. See also Figure S2, Table S1, and Table S2.
Figure S2
Figure S2
In Vitro and In Vivo Assessment of UVB-Treated Cells, Related to Figure 2 and Table S2 A) western blot for p53 and GAPDH in B16F10.9 and B2905 cells 24h post irradiation in various UVB dosages. B) Immunofluorescence stains for UVB-induced cyclobutane pyrimidine dimer (CPD) in parental B2905 cells -untreated (left) and UVB irradiated (right). The UVB irradiated cells were fixed, washed and subjected to immunostaining two minutes after irradiation. Scale bar represents 200 μM (for 10x magnification) and 100 μM (for 20x magnification). C) Distribution of somatic alterations in the parental cell line, in comparison to those occurring following UVB exposure show increase in C > T alterations (distribution of added mutations is shown relative to parental). p value was calculated based on the Chi-square test D) Mutation signatures identified by DeconstructSigs for the mutation changes following UVB irradiation (UVB B2905 versus Parental cell line). E-F) In vitro proliferation of parental versus UVB irradiated B2905, and B16F10.9, respectively, starting from 500 cells at day 0. Data are mean ± SEM. G) In vivo tumor growth in mice inoculated with parental B16F10.9 (left panel) and UVB irradiated B16F10.9 (right panel). n = 5, data are representative of two independent experiments. H) Day of tumor onset for the experiment shown in G. I) In vivo tumor growth in mice inoculated with parental B2905 (Black) or UVB irradiated B2905 (red) lines, treated with anti-PD-1 or IgG control antibodies at days 6, 9, and 12 post cells inoculation (n = 11-12). Data are mean ± SEM. Comparisons between parental B2905 tumors treated with IgG or anti-PD-1 treated are depicted by asterisks, whereas comprisons between UVB B2905 tumors treated with IgG or anti-PD-1 are depcited by cross. ∗,+p < 0.05, ∗∗p < 0.01, ∗∗∗p < 0.001, one-way ANOVA followed by Tukey's post hoc test, J) Mutation signature 7, associated with UVB exposure, is identified in SCC 1 and 2 (deconstructSigs tool). K) Macroscopic tumor growth for tumors derived from UVB, SCC 1 and SCC 2 at day 15.
Figure S3
Figure S3
Supplemental Data for SCC 1–22, Related to Figure 3 A) In vitro growth of UVB irradiated B2905, and the 22 single cell clones derived from it, measured by SyberGreen proliferation assay. Data are mean ± SD. B) In vivo growth of the UVB irradiated B2905 cells and all 20 SCC depicted in Figure 3A, presented individually. n = 3 for each single cell line inoculation. n = 5 for the UVB irradiated B2905 line. C) Somatic alteration distributions of all SCCs show significant difference in comparison to the parental cell line (mutations added relative to parental are shown) p value was calculated based on the Chi-square test.
Figure 3
Figure 3
Decreased Heterogeneity Correlates with Increased Anti-tumor Immune Response (A) In vivo tumor growth in mice inoculated with the UVB-irradiated B2905 cell line (red, n = 5) or with 20 different SCCs derived from this line (SCC 3–22, black, n = 3). Data are representative of at least two independent experiments. Data are mean ± SEM. (B) In vivo evolution experiment. Shown is a VAF plot for the UVB-irradiated B2905 line, generated from WES data of tumor samples taken on days 7, 9, 13, and 17 after inoculation. Data are representative of two biological repeats. (C) Left: scheme of secondary cell line generation and its derivative SCCs. Right: in vivo tumor growth in mice inoculated with a secondary cell line derived from a UVB-irradiated B2905 inoculated tumor (red, n = 5) or with 5 different SCCs derived from this line (green, n = 5). Data are mean ± SEM. ∗∗∗p < 0.001 in all SCC versus secondary cell line comparisons. (D) In vivo tumor growth in NSG immunocompromised mice inoculated with the UVB-irradiated B2905 cell line (red, n = 3) or with SCCs derived from this line (SCC 1, purple, n = 4; SCC 2, green, n = 3) or with parental B2905 cells (black, n = 3). Data are mean ± SEM. See also Figures S3 and S4.
Figure S4
Figure S4
Characterization of Additional UVB-Irradiated B2905 Lines and SCCs Derived from Them, Related to Figure 3 A) In vivo tumor growth in mice inoculated with a secondary cell line, derived from a UVB irradiated B2905 tumor (red, n = 5) or with 5 different SCC derived from this line. (green, n = 5). Data are mean ± SEM. B-G: Additional, independent, UVB irradiated B2905 cell lines: B) C > T somatic alterations are significantly most dominant following UVB exposure (mutations added relative to parental are shown). p value was calculated based on the Chi-square test. C) Signature 7 mutations associated with UVB exposure is obtained in UVB.2 and UVB.3 using deconstructSigs tool. D) In vivo tumor growth in mice inoculated with a UVB irradiated B2905 cell line, “UVB.2,” (red, n = 6) or with 10 different single cell clones derived from this line. (black, n = 5). Data are mean ± SEM. E) In vitro growth of the cell lines described in D, measured using SyberGreen proliferation assay. Data are mean ± SEM. F) In vivo tumor growth in mice inoculated with a UVB irradiated B2905 cell line, “UVB.3,” (red, n = 5) or with 10 different single cell clones derived from this line. (black, n = 5). Data are mean ± SEM. G) In vitro growth of the cell lines described in F, measured using SyberGreen proliferation assay. Data are mean ± SEM. H) In vivo growth of tumors derived from (the first) UVB irradiated B2905, SCC 1, and SCC 2 in CD80/86−/− mice. n = 4-7. Data are mean ± SEM.
Figure 4
Figure 4
Homogeneous SCCs Elicit a Strong Immune Response (A) Flow cytometry analysis of the Granzyme B and CD107a population in total TCRβ+ TILs on day 19. n = 4–5; data are mean ± SEM. ∗∗p < 0.01 for Granzyme B+ CD107a+ TILs, two-way ANOVA followed by Bonferroni’s post hoc test. (B) Flow cytometry analysis of interferon-γ (IFN-γ) in total TILs on day 19. n = 4–5, p < 0.05, Kruskal-Wallis test followed by Dunn’s multiple comparisons test. (C) CYT score derived from RNA-seq data of sorted CD8+ TILs from UVB-irradiated B2905 and SCC 2 tumors on day 15. p < 0.05, Mann-Whitney U test. (D) Pearson correlation between CYT score and weights of tumors in Figure 3C. (E) Quantitation of total CD8+ TILs in the indicated tumors. Four sections from each tumor and three tumors derived from each cell line were examined. A significant difference was observed between parental cells and SSC 2 but not between parental cells and UVB. Data are mean ± SEM. p < 0.05, one-way ANOVA followed by Tukey’s post hoc test. (F) Relative quantitation of the average percentage of CD8+ TILs in the tumor core versus the margin of the tumors described in (E). Data are mean ± SD. (G) Representative immunohistochemical stain for CD8 in slides taken from tumors derived by parental, UVB and SCC 2 on day 10 after cell inoculation. The scale bars represent 100 μM. (H) Immunofluorescence stains of CD3 and Foxp3 in tumors derived from B2905 parental, UVB, and SCC 2, 16, and 11 on days 10−11 after cell inoculation. 3–4 sections from each tumor and two tumors derived from each cell line were examined. The scale bars represent 200 μM. (I) Relative quantitation of the percentage of Foxp3+ of CD3+ TILs described in (H). Data are mean ± SEM. ∗p < 0.05, one-way ANOVA followed by Tukey’s post hoc test. See also Figure S5.
Figure S5
Figure S5
Differential TIL Activation and Infiltration in Differentially Heterogeneous Tumors, Related to Figure 4 A-B) Flow cytometry results of the analyses described in Figure 4 A-B. C) Immunofluorescence of CD3 and CD8 in slides taken from tumors derived by B2905 Parental, UVB and SCC 2. Magnification is 4X. Pictures are representative of three mice per group. Scale bar represents 500 μM. D) higher magnification (10X) of the SCC 2 core. Scale bar represents 200 μM. E-F) Quantification of CD8+ TILs infiltration (E, p < 0.05, ∗∗∗p < 0.001, One-way ANNOVA followed by Tuckey’s post hoc test) and their core versus margin localization in tumors derived from B2905-parental, UVB, and SCC 9,11,16, at day 15 post inoculation. Significant differences are seen between UVB and SSC 11/16 but not between UVB and parental cell lines. n = 3-4. G) Representative immunohistochemical stain for CD8+ cells. Slides were taken from the tumors indicated above, at day 15 post inoculation. Scale bar represents 200 μM.
Figure S6
Figure S6
Characterization of the Identified Neoantigens, Related to Figure 5 A) Mass spectra of synthetic peptides, identical in their sequence to the indicated neoantigens described in Figure 5. B) Differential binding of the identified neopeptides MHCI; Peptide binding to MHCI molecules was assessed via MHCI stabilization assay using RMA-S cells, incubated with the peptides at 0.1-100 μM for 18 hours. Surface expression of H2-Db and H2-Kb was measured by flow cytometry. C) Flow cytometry analysis showing the BM-derived DCs after 10 days of maturation in culture. These cells were used for peptide vaccination. Results are representative of the three rounds of DCs vaccination. D) Flow cytometry analysis from day 1 (first row) and day 2 (rows 2-4) of the in vivo killing assay for the immunized versus naive mice. At day 1, Splenocytes from a CD45.1+ donor mouse were either loaded with wild-type peptide, unloaded, or loaded with a mutant peptide, labeled with CFSE low, medium and high concentrations, respectively, and subjected to flow cytometry analysis to assure these cells are in 1:1:1 ratios. This splenocytes mixture was injected either to naive mouse, or to 2-3 immunized mice (all CD45.2+). 24 hours later, the immunized mice splenocytes were subjected to flow cytometry analysis. The CD45.1+CFSE+ population was gated, and specific killing percentages were calculated, relative to the naive mice. The red asterisks point to the mutant peptide loaded cells at day 2, in the naive versus immunized mice. The above analysis, for noepeptide Dnm2, is a representative of the killing assays described in Figure 5, for three different neopeptides.
Figure 5
Figure 5
Detection and Characterization of HLA-Bound Neoantigens in SCCs (A) Left: spectra of three representative neoantigens detected by targeted mass spectrometry. The SCCs in which these neoantigens were detected are indicated. Right: surface expression of H2-Db and H2-Kb on RMA-S cells incubated with the peptides at 0.1–100 μM for 18 h and measured by flow cytometry analysis. (B) In vivo killing assay in mice immunized with the three neoantigens described in (A) using DC vaccination. The killing percentage is calculated relative to the killing measured in naive, non-vaccinated mice. n = 2–3. Data are mean ± SEM. See also Figure S6 and Tables S2 and S3.
Figure 6
Figure 6
Tumors Derived from Mixtures of Clones Show Differential Growth In Vivo (A) Phylogenetic tree representation of the UVB-irradiated B2905 cell line. The tree depicts the results from mutation clustering analysis, which was used to define the distinct subclones present within the UVB cell line. The phylogenetic relationship between subclones is shown, and then each of the 20 UVB derived SCCs is mapped onto the subclonal branch with the highest genetic similarity. Each of the 20 SCCs is depicted as a ball of 100 tumor cells, with the color coding reflecting the percentage frequency of each branch in each SCC sample. Shown in the top right box is a representation of the UVB parental sample, again shown as a ball of 100 tumor cells, color-coded to match the subclonal branches. See also Figure S7. (B) Top: Venn diagrams for the four 3AB mixes inoculated, representing the number of protein-coding mutations and their intersections between the SCC in each mix. Bottom: in vivo tumor growth curves of the four different 3AB mixes. n = 5. Data are mean ± SEM. (C) Left: in vivo tumor growth curves of the 6WB mix (within TB-4) and 6AB mix (one SCC from each TB). n = 4–5. Right: in vivo tumor growth curves of the 12WB mix (within TB-5) and 12AB mix (two SCC from each TB) and the UVB-irradiated B2905 cell line. n = 5–6. Data are mean ± SEM. (D) Percent clonal versus sub-clonal mutations in the mixes described in (C). (E) The SCC included in each mix described in (B) and (C). (F) The association between the 6AB, 6AB, 12AB, and 12WB mix mutation number (unique) and the maximal tumor volume size (cubic centimeters) within 40 days. Each dot represents an individual mouse. The graph shows statistical significance between the 6 and 12 mixes but not between mutation number and tumor volume (Wilcoxon rank-sum test). See also Table S7.
Figure S7
Figure S7
Single-Cell Clone Clustering of Shared Mutations and Phylogenetic Reconstruction, Related to Figure 6 A) Hierarchical Clustering analysis of correlations between SCCs, based on the fraction of shared mutations. B) Phylogenetic reconstruction of SCCs’ mutations based on neighbor-joining tree estimation shows consistent results (phangorn R package).
Figure 7
Figure 7
Shannon Diversity Index (SDI) Analysis in Immune Checkpoint Inhibitor Datasets (A) The cartoon illustrates two examples of the SDI, top low SDI (the tumor is predominantly composed of one major clone) and bottom high SDI (the tumor is composed of multiple clones with higher evenness between clones). SDI is measured using individual tumor subclones (from Pyclone clustering) as types and the somatic mutations as entities so that a tumor with a low SDI would have nearly all mutations concentrated in just one clone, and, in contrast, a tumor with a high SDI would have a higher number of clones, with mutations spread evenly or diversely across each clone. (B) The SDI analysis applied to the Snyder et al. (2014) anti-CTLA4 dataset. Overall survival Kaplan-Meier plots are shown for with patients with a high SDI in red (SDI above median value in cohort) and a low SDI in green. The number of patients at risk by time point is shown in the table below. (C–E) The same data format as in (B) for the Riaz et al. (2017) anti-PD-1 dataset (C), Hugo et al. (2016) anti-PD-1 dataset (D), and Van Allen et al. (2015) anti-CTLA4 dataset (D), respectively. (F) Forest plot showing the HR for the SDI in each dataset, with the HR value corresponding to the survival risk per unit increase (i.e., each +1 increment) in the SDI. For significance analysis, SDI is tested as a continuous variable (to show a continuous association across the full range of data) using a Cox proportional hazard model (other clinical predictors, e.g., stage, are not included). See also Tables S4 and S5.

Comment in

References

    1. Alexandrov L.B., Nik-Zainal S., Wedge D.C., Aparicio S.A., Behjati S., Biankin A.V., Bignell G.R., Bolli N., Borg A., Børresen-Dale A.L., Australian Pancreatic Cancer Genome Initiative. ICGC Breast Cancer Consortium. ICGC MMML-Seq Consortium. ICGC PedBrain Signatures of mutational processes in human cancer. Nature. 2013;500:415–421. - PMC - PubMed
    1. Alter G., Malenfant J.M., Altfeld M. CD107a as a functional marker for the identification of natural killer cell activity. J. Immunol. Methods. 2004;294:15–22. - PubMed
    1. Andor N., Graham T.A., Jansen M., Xia L.C., Aktipis C.A., Petritsch C., Ji H.P., Maley C.C. Pan-cancer analysis of the extent and consequences of intratumor heterogeneity. Nat. Med. 2016;22:105–113. - PMC - PubMed
    1. Arce Vargas F., Furness A.J.S., Solomon I., Joshi K., Mekkaoui L., Lesko M.H., Miranda Rota E., Dahan R., Georgiou A., Sledzinska A., Melanoma TRACERx Consortium. Renal TRACERx Consortium. Lung TRACERx Consortium Fc-Optimized Anti-CD25 Depletes Tumor-Infiltrating Regulatory T Cells and Synergizes with PD-1 Blockade to Eradicate Established Tumors. Immunity. 2017;46:577–586. - PMC - PubMed
    1. Bar-On L., Birnberg T., Kim K.W., Jung S. Dendritic cell-restricted CD80/86 deficiency results in peripheral regulatory T-cell reduction but is not associated with lymphocyte hyperactivation. Eur. J. Immunol. 2011;41:291–298. - PubMed

Publication types

MeSH terms