. 2019 Oct 8;13(4):669-683.
doi: 10.1016/j.stemcr.2019.08.004. Epub 2019 Sep 12.

PSEN1ΔE9, APPswe, and APOE4 Confer Disparate Phenotypes in Human iPSC-Derived Microglia

Affiliations

PSEN1ΔE9, APPswe, and APOE4 Confer Disparate Phenotypes in Human iPSC-Derived Microglia

Henna Konttinen et al. Stem Cell Reports. .

Abstract

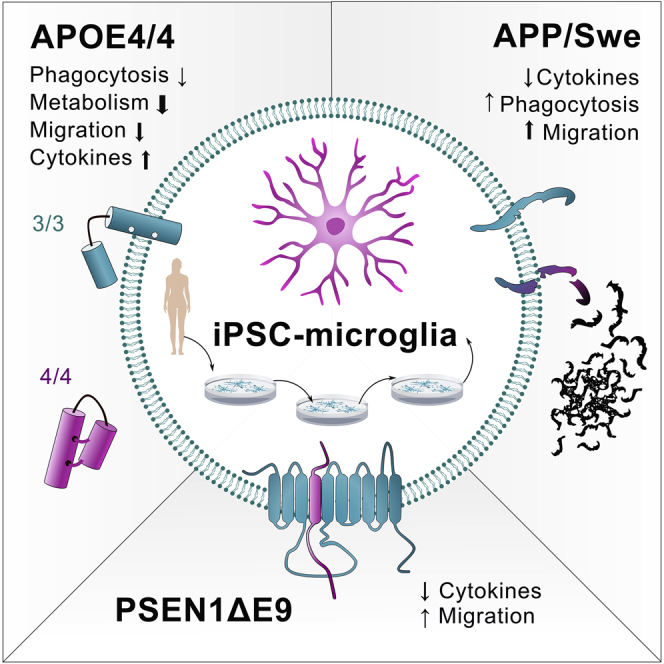
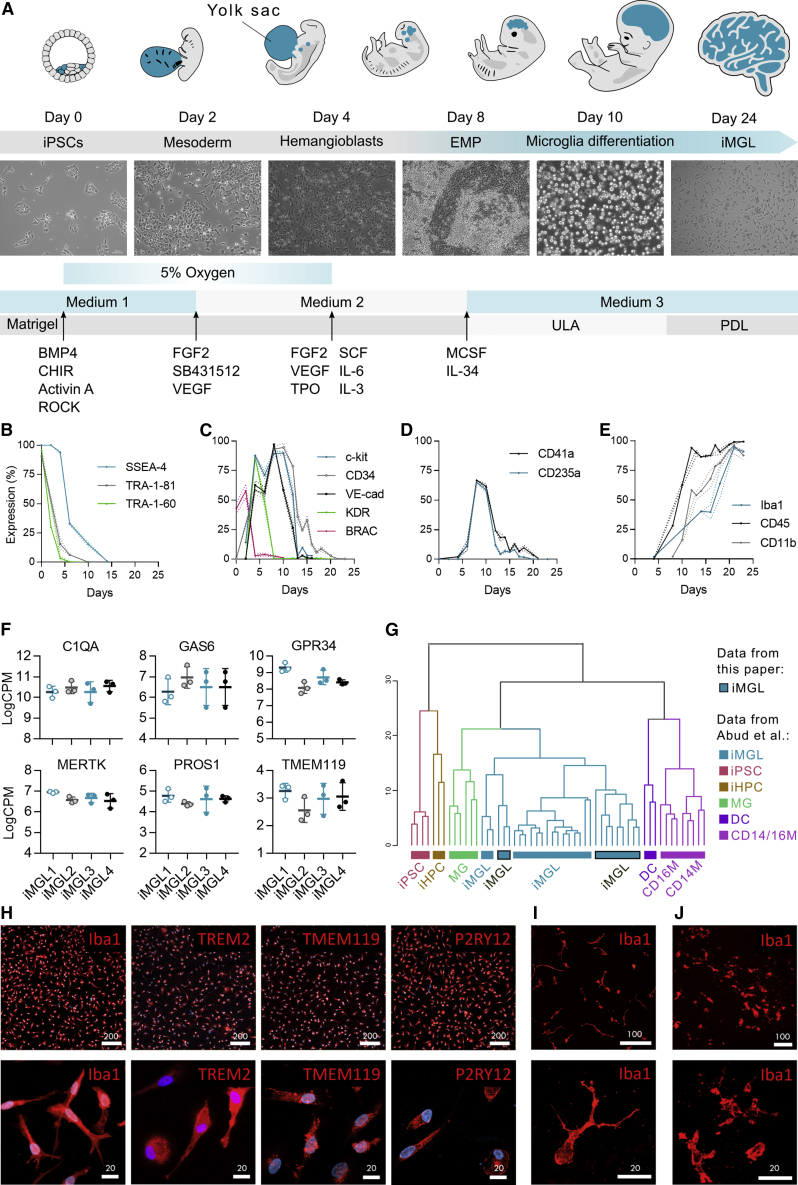
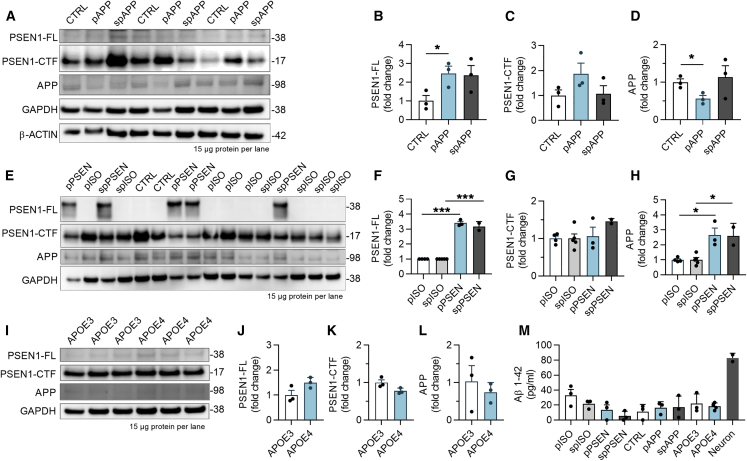
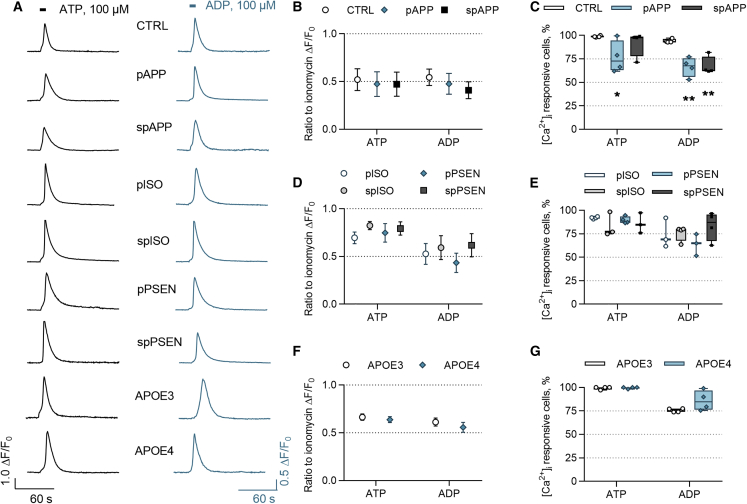
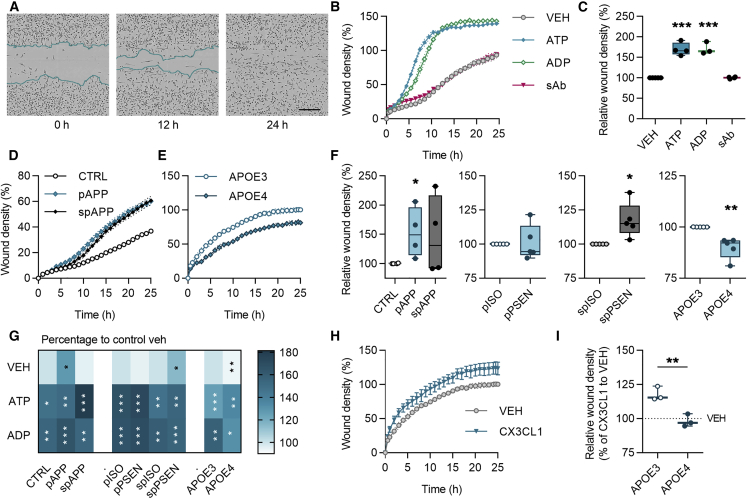
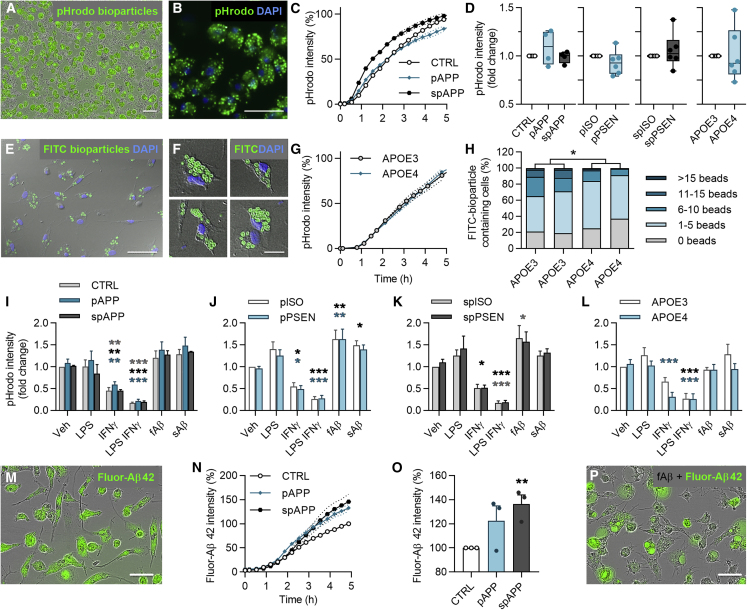
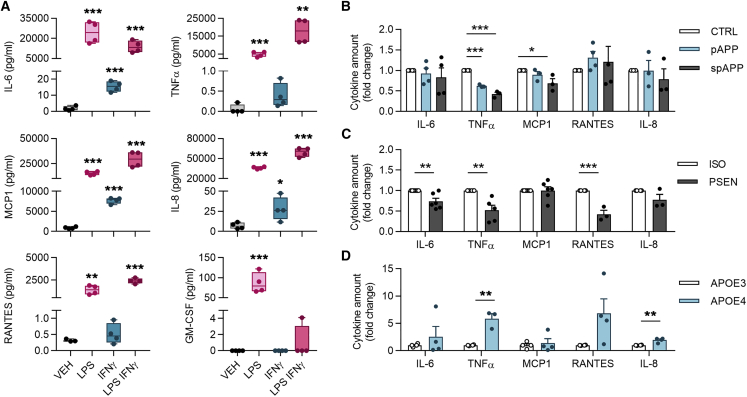
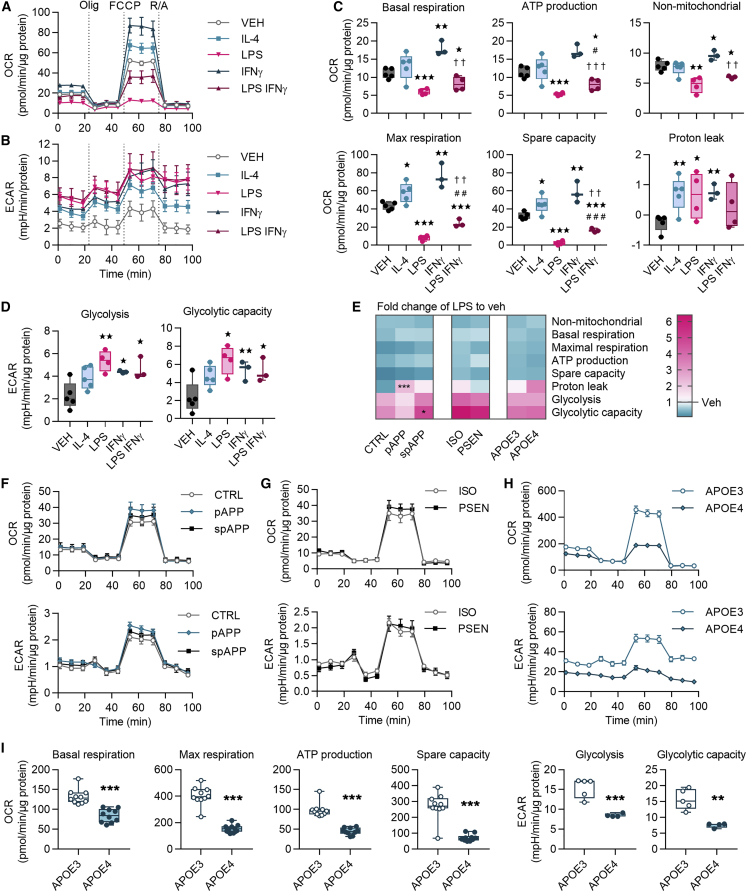
Here we elucidate the effect of Alzheimer disease (AD)-predisposing genetic backgrounds, APOE4, PSEN1ΔE9, and APPswe, on functionality of human microglia-like cells (iMGLs). We present a physiologically relevant high-yield protocol for producing iMGLs from induced pluripotent stem cells. Differentiation is directed with small molecules through primitive erythromyeloid progenitors to re-create microglial ontogeny from yolk sac. The iMGLs express microglial signature genes and respond to ADP with intracellular Ca2+ release distinguishing them from macrophages. Using 16 iPSC lines from healthy donors, AD patients and isogenic controls, we reveal that the APOE4 genotype has a profound impact on several aspects of microglial functionality, whereas PSEN1ΔE9 and APPswe mutations trigger minor alterations. The APOE4 genotype impairs phagocytosis, migration, and metabolic activity of iMGLs but exacerbates their cytokine secretion. This indicates that APOE4 iMGLs are fundamentally unable to mount normal microglial functionality in AD.

Keywords: APOE; APPswe; Alzheimer disease; E9; PSEN1Δ; iPSC; metabolism; microglia; mitochondria; phagocytosis.


Figures

None
Graphical abstract
Figure 1
Figure 1
iPSCs Differentiate into iMGLs through Primitive Hematopoiesis (A–E) Schematic protocol (A). Percentages of positive cells analyzed by flow cytometry for markers of (B) pluripotency, (C) EMPs and mesodermal brachyury (BRAC), (D) primitive EMPs, and (E) and mature microglia. n = 4 cell lines, repeated in 3 batches. (F) The expression of microglial signature genes in RNA sequencing (RNA-seq) data of D24 iMGLs as log2 CPM values. n = 3 batches, 4 cell lines. (G) Hierarchical clustering of RNA-seq data shows that our iMGLs cluster with published iMGLs and human microglia (MG), but are distinct from dendritic cells (DCs), monocytes (CD14M and CD16M), iPSCs, and hematopoietic progenitor cells (HPCs) (Abud et al., 2017). (H–J) Immunostainings of D24 iMGLs (H). Repeated with two batches for all cell lines. Images of iMGLs labeled with IBA1 (red) in (I) 3D-Matrigel co-culture with neurons and in (J) cerebral brain organoids. Repeated with two batches for 2–4 cell lines. Scale bars as μm. Data presented mean ± SEM. See also Figures S1 and S2; Tables S1 and S2.
Figure 2
Figure 2
iMGLs Express APP and PSEN1 Proteins, and PSEN1ΔE9 Mutation Leads to Expected Alterations in PSEN1 Endoproteolysis (A–L) Western blots for full-length (FL) and C-terminal fragment (CTF) of PSEN1 and APP proteins from 3 batches of control (CTRL) and APPswe (pAPP, spAPP) iMGLs (A). GAPDH and b-ACTIN as loading controls. Quantification of blots normalized to GAPDH for (B) PSEN1-FL, (C) PSEN1-CTF, and (D) APP protein. n = 3 batches. Respective western blots (E) and quantification (F–H) for PSEN1ΔE9 iMGLs (pPSEN, spPSEN) and their isogenic controls (pISO and spISO). n = 2–5 batches. Western blots (I) for APOE3 and APOE4 iMGLs and quantification (J–L) for the proteins. n = 3 batches. (M) Aβ 1-42 levels in cell culture medium after 48 h analyzed by ELISA. n = 2–5 batches for APP and PSEN; n = 3 wells for APOE repeated in three batches. Data presented mean ± SEM unpaired two-tailed t test,p < 0.05, ∗∗p < 0.01, ∗∗∗p < 0.001. p, presymptomatic; sp, symptomatic. See also Figure S3.
Figure 3
Figure 3
ATP and ADP Evoke Intracellular Calcium [Ca2+]i Transients in iMGLs (A) Example traces of [Ca2+]i transients following 100 μM ATP (left panel) and ADP (right panel) applications for 5 s (indicated by bars) in iMGLs loaded with the Ca2+ indicator Fluo-4 AM. (B) The ratio of maximum amplitudes normalized to amplitudes evoked by ionomycin that was applied in the end of experiment and used as inclusion criteria. n = 4 batches, each with 9–10 coverslips, altogether 3,994 CTRL, 3,015 pAPP, and 3,906 spAPP cells. (C–E) Percentages of ATP- and ADP-responsive cells in APPswe lines compared with control iMGLs (C). Ratio of maximum amplitudes (D) and percentages of responsive cells (E) obtained from isogenic and PSENΔE9 iMGLs. n = 4 batches, each with 9–12 coverslips, altogether 1,969 pISO, 2,355 spISO, 1,856 pPSEN, and 2,823 spPSEN cells. (F and G) Similar data for APOE3 and APOE4 iMGLs. n = 4 coverslips, altogether 482 APOE3 and 991 APOE4 cells, repeated in three batches. Data presented mean ± SEM unpaired two-tailed t test or one-way ANOVA followed by Bonferroni's post hoc test, p < 0.05, ∗∗p < 0.01. CTRL, control; p, presymptomatic; sp, symptomatic; PSEN, PSEN1ΔE9; APP, APPswe; and ISO, isogenic control iMGLs.
Figure 4
Figure 4
Chemokinesis Is Accelerated in APPswe and PSEN1ΔE9 iMGLs but Decelerated in APOE4 iMGLs (A) Representative images of iMGLs in scratch wound migration assay at 0, 12, and 24 h time points. Scale bar 300 µm. (B) Wound densities measured for 25 h with vehicle (VEH), 100 μM ATP, 100 μM ADP, or 1-μM soluble sAβ treatments. (C–E) Wound densities at 24 h normalized to vehicle (C). Time curves for (D) control (CTRL) and APPswe (APP), and (E) APOE3 and APOE4 iMGLs. (F) Wound densities at 24 h normalized to control or isogenic (ISO) iMGLs. (G) A heatmap for increase (darker color) or decrease (lighter color) in wound density compared with vehicle. White asterisks indicate significance compared with vehicle and black asterisks to control genotype. (H) Time curves for wound density with 100 μM fractalkine (CX3CL1) treatment in APO3 iMGLs. (I) Corresponding wound density at 24 h normalized to vehicle for APOE iMGLs. Curve graphs show a representative experiment of three replicates, n = 3–5 wells. Boxplots and heatmap show normalized results from n = 3–5 replicate batches. Data presented mean ± SEM, unpaired two-tailed t test, p < 0.05, p < 0.01, ∗∗∗p < 0.001. p, presymptomatic; sp, symptomatic. See also Figure S4.
Figure 5
Figure 5
Phagocytosis Is Dampened in APOE4 iMGLs, but not in APPswe or PSEN1ΔE9 iMGLs (A and B) Representative images of phagocytosed green pHrodo Zymosan A bioparticles in iMGLs at 5 h. (C) Time curves for pHrodo fluorescence intensity in control (CTRL) and APPswe (APP) iMGLs normalized to cell amount. (D) Respective boxplots at 5 h normalized to control or isogenic (ISO) iMGLs. (E and F) Representative images of phagocytosed FITC Zymosan A bioparticles in iMGLs. (G) pHrodo time curves for APOE3 and APOE4 iMGLs. (H) Percentages of APOE iMGLs that internalized certain number of FITC particles per cell. n = 290–750 cells. (I–L) pHrodo intensity at 5 h, after 24 h pretreatment with 100 ng/mL LPS, 20 ng/mL IFN-γ, or LPS-IFN-γ, or with simultaneous treatment with 0.5 μM soluble sAβ or fibrillar fAβ, compared with vehicle (Veh) in APPswe (I), pPSEN (J), spPSEN (K), and APOE (L) iMGLs. (M) Representative image of phagocytosed green fluor-Aβ1-42 in iMGLs at 5 h. (N) Time curves for fluorescence intensity of fluor-Aβ in control and APPswe iMGLs. (O) Respective bar graphs at 5 h normalized to control iMGLs. (P) Representative image of iMGLs treated with fluor-Aβ and fAβ depicting enlarged vacuoles. Scale bars, 50 μm. Curve graphs show a representative experiment of 3 replicates, n = 4 wells. Boxplots and bar graphs show normalized results from n = 2–6 replicate batches. Data presented mean ± SEM unpaired two-tailed t test or two-way ANOVA with Bonferroni's post hoc test,p < 0.05, ∗∗p < 0.01, ∗∗∗p < 0.001. p, presymptomatic; sp, symptomatic; PSEN, PSEN1ΔE9 iMGLs. See also Figure S4.
Figure 6
Figure 6
Cytokine Release under Proinflammatory Conditions Is Aggravated in APOE4 iMGLs but Decreased in PSEN1ΔE9 and APPswe iMGLs (A) iMGLs secrete cytokines when stimulated for 24 h with LPS 100 ng/mL, IFN-γ 20 ng/mL, or their combination LPS-IFN-γ as measured from media by cytometric bead array assay. Representative graphs. n = 4 wells. (B) spAPP iMGLs released less TNF-α, and pAPP less TNF-α and MCP1, compared with control iMGLs in response to LPS-IFN-γ treatment. (C) PSEN1ΔE9 iMGLs released less IL-6, TNF-α, and RANTES compared with isogenic iMGLs. (D) In contrast, APOE4 iMGLs released aggregated amounts of TNF-α and IL-8 compared with APOE3. For (B–D) n = 3–6 batches, each with 4 wells. Data presented mean ± SEM unpaired two-tailed t test, p < 0.05, p < 0.01, ∗∗∗p < 0.001. See also Figure S4. CTRL, control; p, presymptomatic; sp, symptomatic; PSEN, PSEN1ΔE9; APP, APPswe; and ISO, isogenic control iMGLs.
Figure 7
Figure 7
Metabolism of iMGLs Is Altered under Pro- and Anti-inflammatory Stimuli and by APOE4 Genetic Background (A) Representative oxygen consumption rate (OCR) curves for iMGLs following 24 h vehicle (VEH), LPS, IL-4, IFN-γ, and LPS-IFN-γ treatments, all 20 ng/mL. n = 3–5 wells. (B–D) Corresponding extracellular acidification rate (ECAR) curves (B). Mitochondrial parameters calculated from (C) OCRs in (A and D) from ECARs in (B). (E–H) Heatmap indicating decrease (blue) or increase (red) in fold change of mitochondrial parameters of LPS-treated iMGLs compared with vehicle (E). White equals 1. n = 5 CTRL, n = 4 pAPP, n = 2 spAPP, n = 3 APOE3, and n = 2 APOE4 batches with 10 wells; n = 1 isogenic, and n = 3 PSEN1 batches with 4–5 wells. Representative OCR and ECAR curves for (F) control and APPswe, (G) isogenic and PSEN1ΔE9, and for (H) APOE4 and APOE3 iMGLs. n = 5–10 wells, repeated with three batches. (I) Mitochondrial parameters calculated from OCRs and ECARs in (H) p < 0.05, ∗∗p < 0.01, ∗∗∗p < 0.001 compared with vehicle, #compared with LPS, †compared with IFN-γ, two-tailed unpaired t test. Olig, oligomycin; FCCP, carbonyl cyanide-4-(trifluoromethoxy)phenylhydrazone; R/A, rotenone and antimycin A, each 1 μM. CTRL, control; p, presymptomatic; sp, symptomatic; PSEN, PSEN1ΔE9; APP, APPswe; and ISO, isogenic control iMGLs.

References

    1. Abud E.M., Ramirez R.N., Martinez E.S., Healy L.M., Nguyen C.H.H., Newman S.A., Yeromin A.V., Scarfone V.M., Marsh S.E., Fimbres C. iPSC-derived human microglia-like cells to study neurological diseases. Neuron. 2017;94:278–293.e9. - PMC - PubMed
    1. Bagyinszky E., Youn Y.C., An S.S., Kim S. The genetics of Alzheimer's disease. Clin. Interv. Aging. 2014;9:535–551. - PMC - PubMed
    1. Balez R., Steiner N., Engel M., Munoz S.S., Lum J.S., Wu Y., Wang D., Vallotton P., Sachdev P., O'Connor M. Neuroprotective effects of apigenin against inflammation, neuronal excitability and apoptosis in an induced pluripotent stem cell model of Alzheimer's disease. Sci. Rep. 2016;6:31450. - PMC - PubMed
    1. Banati R.B., Gehrmann J., Czech C., Monning U., Jones L.L., Konig G., Beyreuther K., Kreutzberg G.W. Early and rapid de novo synthesis of Alzheimer beta A4-amyloid precursor protein (APP) in activated microglia. Glia. 1993;9:199–210. - PubMed
    1. Barroeta-Espar I., Weinstock L.D., Perez-Nievas B.G., Meltzer A.C., Siao Tick Chong M., Amaral A.C., Murray M.E., Moulder K.L., Morris J.C., Cairns N.J. Distinct cytokine profiles in human brains resilient to Alzheimer's pathology. Neurobiol. Dis. 2019;121:327–337. - PMC - PubMed

Publication types

MeSH terms