. 2019 Nov 21;76(4):590-599.e4.
doi: 10.1016/j.molcel.2019.08.007. Epub 2019 Sep 12.

A Complex of U1 snRNP with Cleavage and Polyadenylation Factors Controls Telescripting, Regulating mRNA Transcription in Human Cells

Affiliations

A Complex of U1 snRNP with Cleavage and Polyadenylation Factors Controls Telescripting, Regulating mRNA Transcription in Human Cells

Byung Ran So et al. Mol Cell. .

Abstract

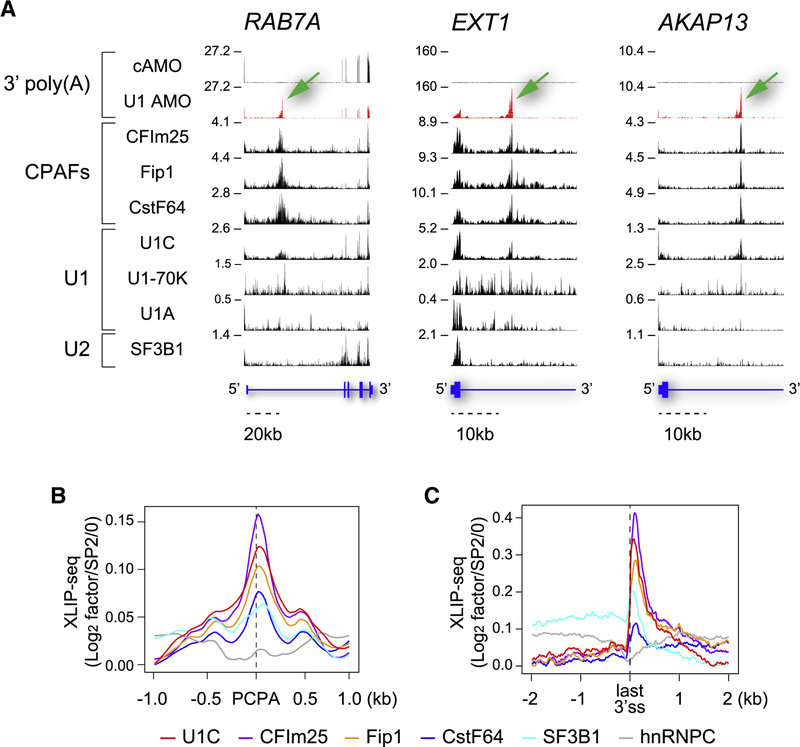
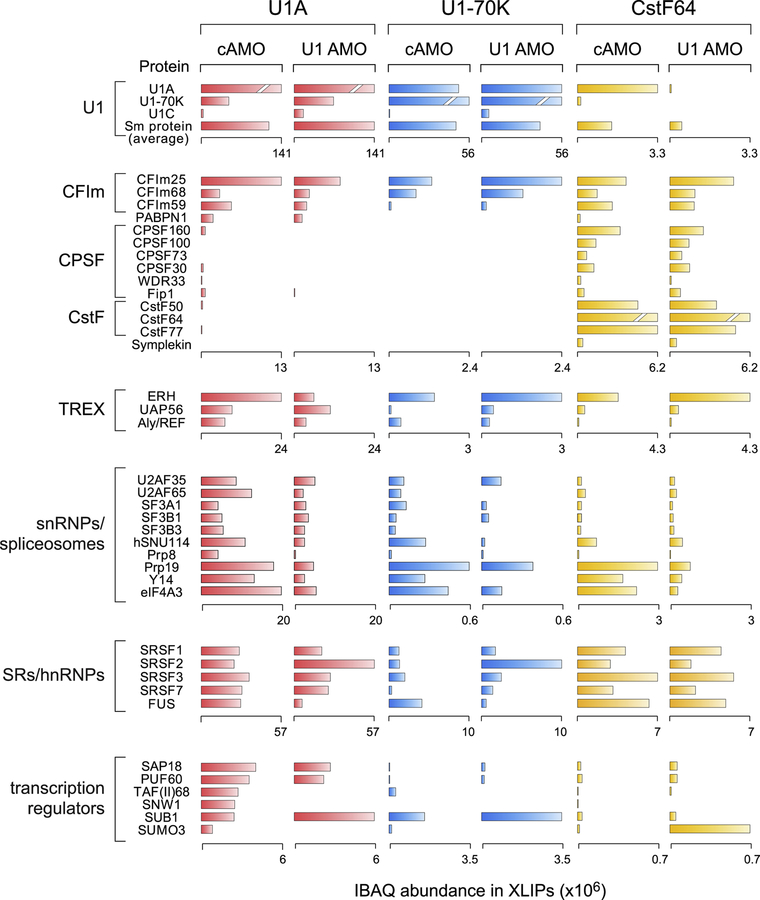
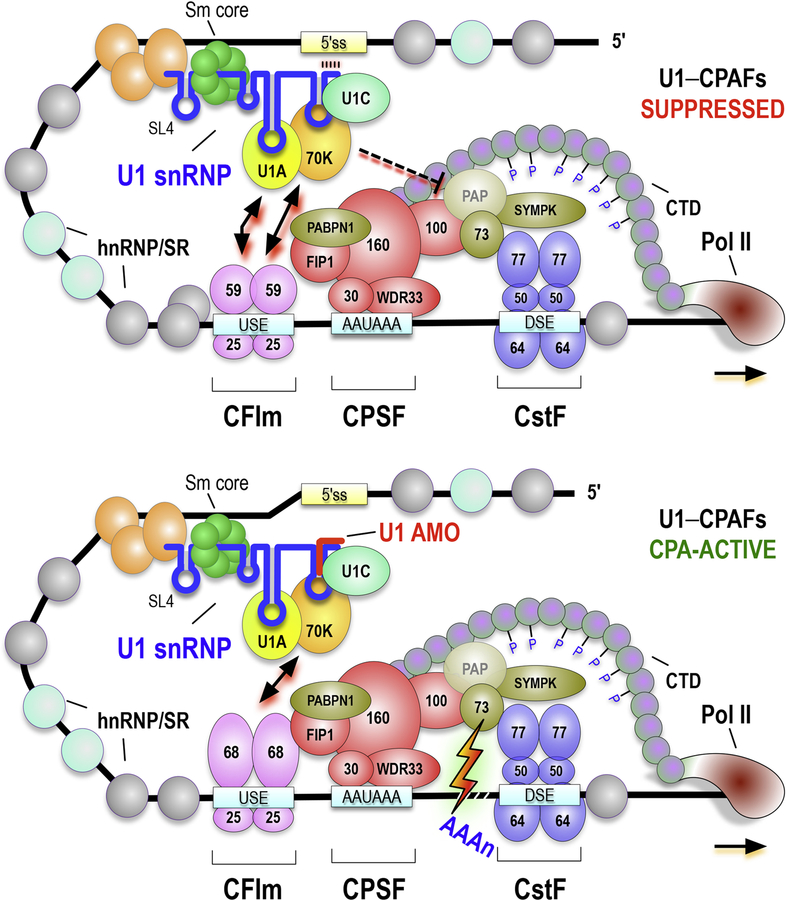
Full-length transcription in the majority of human genes depends on U1 snRNP (U1) to co-transcriptionally suppress transcription-terminating premature 3' end cleavage and polyadenylation (PCPA) from cryptic polyadenylation signals (PASs) in introns. However, the mechanism of this U1 activity, termed telescripting, is unknown. Here, we captured a complex, comprising U1 and CPA factors (U1-CPAFs), that binds intronic PASs and suppresses PCPA. U1-CPAFs are distinct from U1-spliceosomal complexes; they include CPA's three main subunits, CFIm, CPSF, and CstF; lack essential splicing factors; and associate with transcription elongation and mRNA export complexes. Telescripting requires U1:pre-mRNA base-pairing, which can be disrupted by U1 antisense oligonucleotide (U1 AMO), triggering PCPA. U1 AMO remodels U1-CPAFs, revealing changes, including recruitment of CPA-stimulating factors, that explain U1-CPAFs' switch from repressive to activated states. Our findings outline this U1 telescripting mechanism and demonstrate U1's unique role as central regulator of pre-mRNA processing and transcription.

Keywords: -end processing; U1 snRNP; cleavage and polyadenylation; mRNA 3ʹ; telescripting; transcription elongation; transcription termination.


Conflict of interest statement

DECLARATION OF INTERESTS

The authors declare no competing interests.

Figures

Figure 1.
Figure 1.. U1 and CPAFs co-localize at PCPA locations in introns.
(A) Genome browser views of XLIP-seq data for the indicated factors from HeLa cells transfected with U1 AMO or cAMO in select regions of representative genes (RAB7A, EXT1, and AKAP13). Non-genomic 3’-poly(A)s identified in the RNA-seq of 5min EU pulse-labeled and oligo(dT)-selected RNAs indicate the positions of PCPA elicited with U1 AMO (green arrows). In cAMO, these are located at the end of the genes, which are not included in the views shown. The Y-axis indicates reads per million (RPM) for the highest peak within the genome browser field for each sample. Annotated RefSeq gene structures are shown in blue with thin horizontal lines indicating introns and thicker blocks indicating exons (See also Figure S1). (B) Metagene plots for U1–CPAFs co-localization at PCPA sites (n=1,485). Normalized XLIP binding (log2 RPM in XLIPs over SP2/0) of the factors was rescaled using the lowest values as a baseline and were plotted around the PCPA sites within a 2kb window. (C) Metagene plots of the normalized U1–CPAFs XLIP binding for PCPA genes as shown in (B) around the last 3’ss, (n=1,469) within a 4kb window.
Figure 2.
Figure 2.. The most enriched proteins in U1 and CstF64 XLIPs in control and U1 AMO transfected cells.
The bar graph represents the IBAQ abundance of proteins in the indicated XLIPs (See also Figure S3, Tables S2, and S3). Proteins were ranked by IBAQs from U1A XLIP in control (cAMO) and classified into indicated functional groups according to protein (UniProt) and gene databases (GeneCards). Spliceosomes indicates spliceosomal components, including all snRNPs except U1 (shown separately); CPAFs indicate 3’-processing cleavage and polyadenylation factors; TREX indicates the transcription and export complex proteins; hnRNP/SR indicates RBPs of the hnRNP proteins family and the SR domain subgroup; Transcription regulators indicates proteins involves in mRNA maturation and export. The scale of the IBAQs for each group is indicated under the bar graphs except for the highest IBAQ proteins in each XLIP due to high enrichment of the IP target proteins (U1A, Sm proteins (average), and CstF64 in U1A, U1–70K, and CstF64 XLIPs shown as a broken bar, respectively).
Figure 3.
Figure 3.. U1 and CPAFs co-localize at PCPA locations proximal to the first 5’ splice site in long introns.
(A) Genome browser views of EU pulse-labeled 3’-poly(A)-seq, biotinylated U1 AMO XLPD, and XLIP-seq data on representative genes (CDK6 and EGFR). The Y-axis indicates RPM for the highest peak within the genome browser field for each sample. Annotated RefSeq gene structures are shown in blue with thin horizontal lines indicating introns and thicker blocks indicating exons. Green arrows indicate end points of major PCPA locations (See also Figure S5). (B) Metagene plots of Pol II ChIP-seq for PCPA genes from cAMO-, U1 AMO-transfected cells (Oh et al., 2017), and biotin-U1 AMO XLPD-seq around the TSS are shown within a 4kb window (n=1,469) (See also Figure S5). (C) Metagene plots of normalized XLIP binding (log2 RPM in XLIPs over SP2/0) of the factors (left) and biotinylated U1 AMO binding (log2 RPM in U1 AMO over cAMO, right) were rescaled using the lowest values as a baseline and were plotted around the first 5’ss, within a 4kb widow (n=1,469). (D) Relative stoichiometry of proteins enriched in the main functional groups as indicated. X-axis indicates IBAQ enrichment values in U1 AMO-compared to cAMO-XLPD. U1 snRNP, CPAFs, CBC, TREX, Pol II-associated, and exosome adaptor complex proteins are indicated (See also Table S4).
Figure 4.
Figure 4.. CFIm25/68 is a natural PCPA activator.
(A) Western blot analysis of HeLa cell lysates transfected with control, CFIm25, or CFIm68 siRNA. The knockdown efficiencies relative to Actin as a loading control are indicated as percentages of residual protein for each knockdown compared to control. (B) Genome browser views of 4-thiouridine-labeled RNA-seq data with indicated siRNA knockdowns in HeLa cells on representative genes (GLS, ACACA, and SIAH1). The Y-axis indicates RPM for the highest peak within the genome browser field for each RNA-seq. Annotated RefSeq gene structures are shown in blue with thin horizontal lines indicating introns and thicker blocks indicating exons. The 5’ss is indicated by a black arrow above the gene structure. Green arrows indicate major peaks showing natural PCPA within 1kb downstream of the first 5’ss. We note that the increase in the PCPA peak is readily apparent by comparison to the nearby peak in exon1. (C) Box plots showing the distribution of RNA-seq read counts in the 1kb downstream of the intron to the reads the first exon upon siRNA knockdown or U1 AMO. The median of the data is indicated as a notch in the box, while the whisker depicts 1.5 times the inter- quartile range, and outliers are shown as dots. The significance of difference between each knockdown group was performed using Wilcoxon rank sum test, all the P-values are <2.2 × 10⁻¹⁶.
Figure 5.
Figure 5.. Schematic representation of U1–CPAF complex function in telescripting.
Two modes of the U1–CPAF complexes are shown. U1-specific proteins, U1–70K and U1A bind stem loop (SL) 1 and 2, respectively, while U1C associates with U1 through U1–70K. A heptameric Sm core on U1’s Sm site between SL3 and SL4. (A) An active mode of U1–CPAF complex in telescripting at the cryptic PAS in the first introns. The U1 is not a part of productive spliceosomes and associates with CFIm, CPSF, CstF complexes, Symplekin/SYMPK, and PABPN1, which suppresses premature termination. (B) A stimulatory mode of U1–CPAFs complex active in P/CPA. Loss of U1 snRNA’s 5’-end base-pairing with the nascent transcript, due to U1 AMO, switches U1–CPAFs from suppressed to CPA-active states, likely by a combination of removal of inhibitory U1A–CPAF interactions and by allowing the CPA-stimulatory factor, CFIm68, as the main CFIm25 binder. U1 AMO does not release U1 from U1–CPAFs, which maintains its overall composition and binding locations. For simplicity, other aspects of the model described in the text are not shown, including interactions with the CBCA, TREX, and exosomes.

References

    1. Alber F, Dokudovskaya S, Veenhoff LM, Zhang W, Kipper J, Devos D, Suprapto A, Karni-Schmidt O, Williams R, Chait BT, Sali A, and Rout MP (2007). The molecular architecture of the nuclear pore complex. Nature 450, 695–701. - PubMed
    1. Almada AE, Wu X, Kriz AJ, Burge CB, and Sharp PA (2013). Promoter directionality is controlled by U1 snRNP and polyadenylation signals. Nature 499, 360–363. - PMC - PubMed
    1. Andersen PR, Domanski M, Kristiansen MS, Storvall H, Ntini E, Verheggen C, Schein A, Bunkenborg J, Poser I, Hallais M, Sandberg R, Hyman A, LaCava J, Rout MP, Andersen JS, Bertrand E, and Jensen TH (2013). The human cap-binding complex is functionally connected to the nuclear RNA exosome. Nat Struct Mol Biol 20, 1367–1376. - PMC - PubMed
    1. Awasthi S, and Alwine JC (2003). Association of polyadenylation cleavage factor I with U1 snRNP. RNA 9, 1400–1409. - PMC - PubMed
    1. Bartkowiak B, Liu P, Phatnani HP, Fuda NJ, Cooper JJ, Price DH, Adelman K, Lis JT, and Greenleaf AL (2010). CDK12 is a transcription elongation-associated CTD kinase, the metazoan ortholog of yeast Ctk1. Genes Dev 24, 2303–2316. - PMC - PubMed

Publication types

MeSH terms