. 2019 Oct 3;25(4):501-513.e5.
doi: 10.1016/j.stem.2019.08.011. Epub 2019 Sep 12.

Chronic Inflammation Directs an Olfactory Stem Cell Functional Switch from Neuroregeneration to Immune Defense

Affiliations

Chronic Inflammation Directs an Olfactory Stem Cell Functional Switch from Neuroregeneration to Immune Defense

Mengfei Chen et al. Cell Stem Cell. .

Abstract

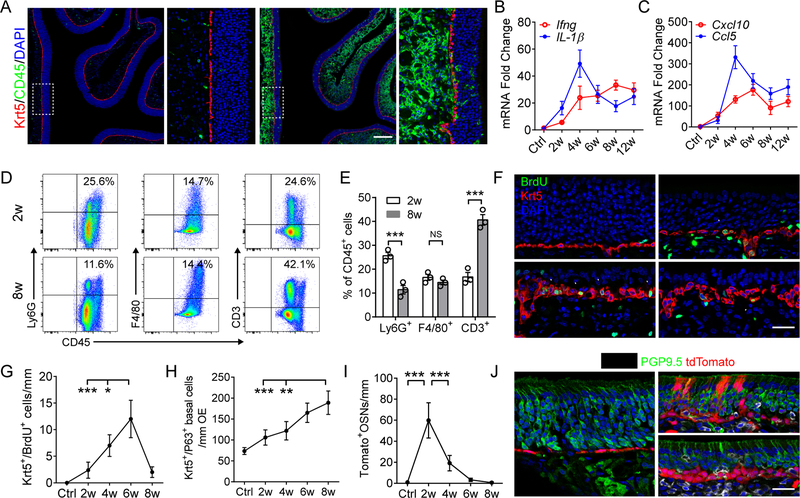
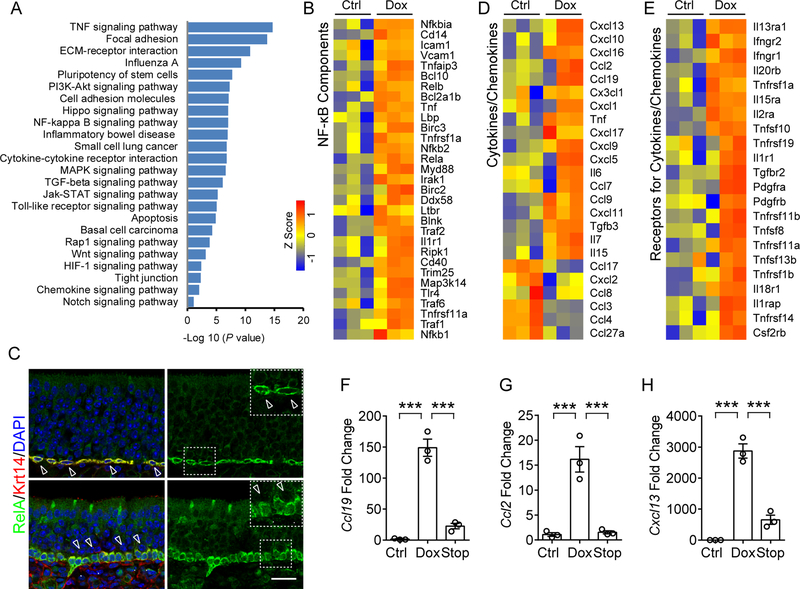
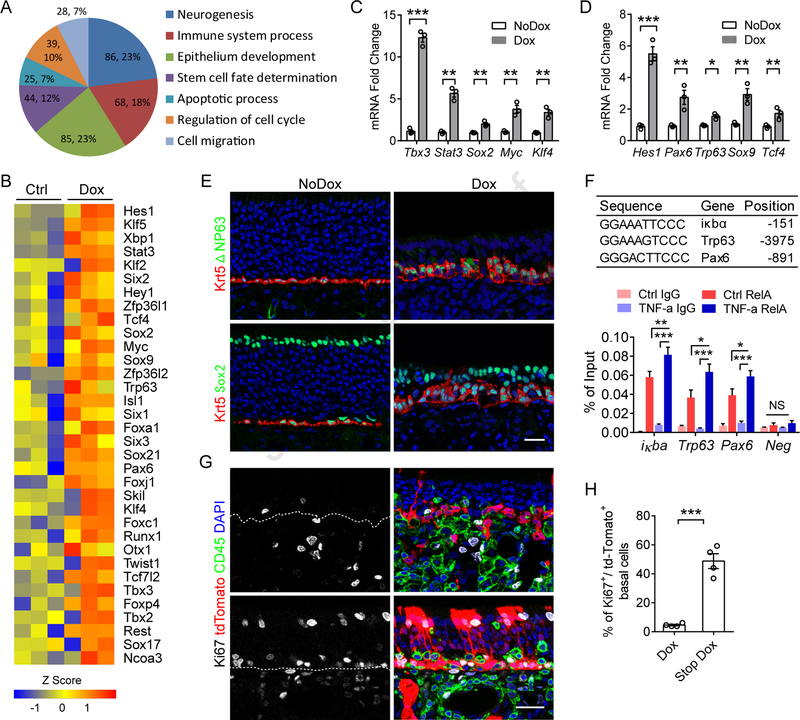
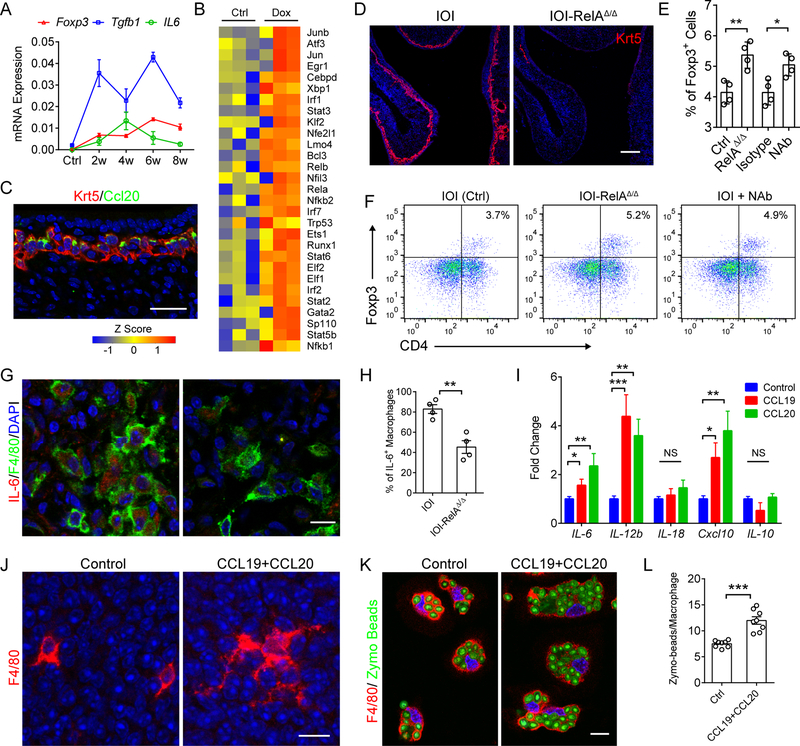
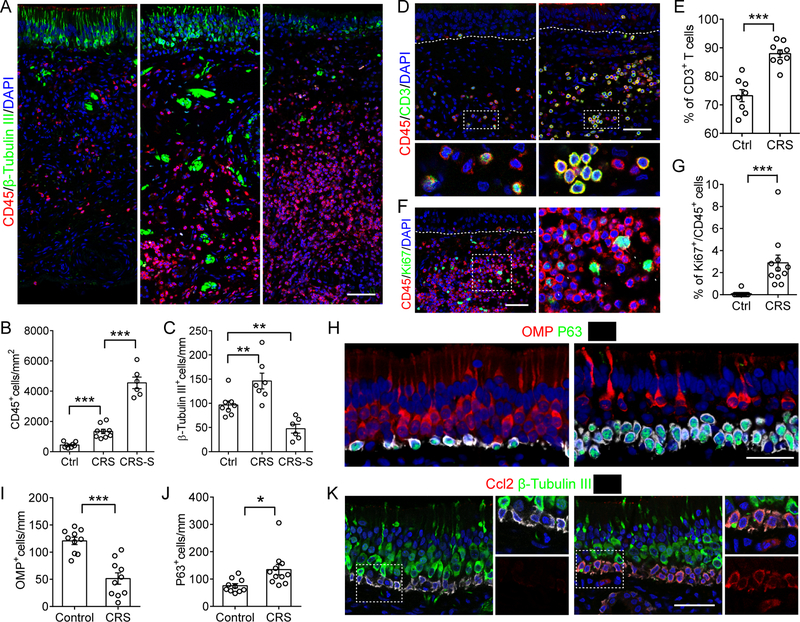
Although olfactory mucosa possesses long-lived horizontal basal stem cells (HBCs) and remarkable regenerative capacity, the function of human olfactory neuroepithelium is significantly impaired in chronic inflammatory rhinosinusitis. Here, we show that, while inflammation initially damages olfactory neurons and activates HBC-mediated regeneration, continued inflammation locks HBCs in an undifferentiated state. Global gene expression in mouse HBCs reveals broad upregulation of NF-κB-regulated cytokines and chemokines including CCL19, CCL20, and CXCL10, accompanied by enhancement of "stemness"-related transcription factors. Loss-of-function studies identify an NF-κB-dependent role of HBCs in amplifying inflammatory signaling, contributing to macrophage and T cell local proliferation. Chronically activated HBCs signal macrophages to maintain immune defense and prevent Treg development. In diseased human olfactory tissue, activated HBCs in a P63+ undifferentiated state similarly contribute to inflammation through chemokine production. These observations establish a mechanism of chronic rhinosinusitis-associated olfactory loss, caused by a functional switch of neuroepithelial stem cells from regeneration to immune defense.

Keywords: NF-kB; basal stem cell; chemokine; chronic inflammation; neural stem cell; neurogenesis; olfactory epithelium; regeneration.


Conflict of interest statement

DECLARATION OF INTERESTS

The authors declare no competing interests.

Figures

Figure 1.
Figure 1.. Continuous inflammation impedes olfactory neurogenesis.
(A) Representative images of no Dox control and olfactory inflammation after 3 w (weeks) of Dox treatment. (B and C) Quantitative PCR (qPCR) analysis of mRNA expression of cytokines (B) and chemokines (C) in whole olfactory mucosa after indicated time periods of Dox induction. (D and E) Percentage of inflammatory cell subpopulation in olfactory mucosa (E) and representative FCS plots (D). A total of 8 × 10⁴ CD45+ cells were recorded in each OE sample. n = 3 mice in (B–E). (F and G) Quantification of dividing Krt5+ stem cells (arrowheads) in olfactory epithelium (G), and representative images (F) of BrdU incorporation assay. (H) Quantification of P63+/Krt5+ olfactory stem cells. n = 5 mice per group in (F–H). (I and J) Lineage tracing of Krt5+ basal cells in inflammatory microenvironment, n = 3 mice. Data are represented as mean ± SEM, *P < 0.05, **P < 0.01, ***P < 0.001, P values were calculated by unpaired two tailed Student’s t-test (E) or by one-way ANOVA (G–I); NS, not significant. Scale bars, 200 μm (A) and 25 μm (F and J). See also Figure S1.
Figure 2.
Figure 2.. NF-κB activation in HBC targeted broad spectrum cytokines and chemokines
(A) Pathway enrichment analysis of genes that were significantly upregulated (>2-fold, p < 0.05) in sorted HBCs after 6 w Dox treatment, relative to untreated control. Enriched pathways were presented according to –log10 (p value). (B) Heat map of NF-κB pathway-related genes that are significantly upregulated in HBCs after Dox treatment. (C) Immunostaining analysis of RelA localization in HBCs. RelA is highly expressed in Krt14+ HBCs and largely absent in nuclei (upper panel, hollow arrow heads) in the static state. Upon Dox-initiated inflammation, RelA translocated to the nucleus in Krt14+ HBCs (Arrow heads in lower panel, compared to hollow arrow heads). IOI mouse was treated with Dox for 12 days. (D) Heat map of cytokines or chemokines genes that are differentially expressed in HBCs. (E) Heat map of upregulated receptor genes of cytokines or chemokines in HBCs. The color scale shows the Z score of each gene. (F–H) qPCR analysis of mRNA expression of Ccl19 (F), Ccl2 (G), and Cxcl13 (H) in HBCs sorted from control, Dox treated and 3 days post-Dox treatment (Stop) mice. Data are represented as mean ± SEM, n = 3 independent samples. ***P < 0.001, P values were calculated by one-way ANOVA. Scale bar, 50 μm. See also Figure S2.
Figure 3.
Figure 3.. HBCs amplify inflammatory signals in olfactory mucosa via NF-κB
(A) Representative images of CD45 and BrdU staining in control (NoDox) or 6 days of Dox treatment (Dox and RelAΔ/Δ) groups. RelAΔ/Δ, IOI mice with selective RelA deletion in HBCs. (B) Quantification of CD45+ immune cells in (A). (C and D) Quantification of CD45+/BrdU+ (C) or CD45+/Ki67+ (D) proliferating immune cells at indicated time points of Dox treatment. (E and F) Representative images of co-staining for Ki67 and the macrophage marker F4/80 (E), and quantification of F4/80+/Ki67+ proliferating macrophages (F) in olfactory mucosa. (G and H) Co-staining CD3 and Ki67 (H), and quantification of CD3+/Ki67+ proliferating T lymphocytes (G). (I–N) Immunostaining of CXCL10, CCL19, and CCL20 with Krt5 in Dox treated IOI (I–K) or IOI with RelA deletion (L–N) in HBCs. Below (I–N) show magnified views of boxed area. Data are represented as mean ± SEM, n = 4 mice. *P < 0.05, *P < 0.01, **P < 0.001; P values were calculated by unpaired two tailed Student’s t-test. All experiments were replicated at least twice. Scale bars, 25 μm. See also Figure S3 and S4.
Figure 4.
Figure 4.. Transcriptional regulation switches off the HBC regenerative phenotype
(A) GO analysis of the differentially expressed transcription factors in HBCs between control and 6w Dox treated group (up or downregulation > 1-fold, p < 0.05). Each slice of the pie chart represents the number of genes and percentage that belong to the indicated GO terms. (B) Upregulated transcription factors in HBCs of 6w Dox treated group that are involved in maintaining stem cell capacity. (C and D) qPCR validation of upregulated transcription factors in sorted HBCs. n = 3 independent samples. (E) Immunostaining of Krt5, Sox2 and ΔNP63 in sections from Control or 6 w Dox treated mice. Some ΔNP63 cells located between Krt5+/ΔNP63+ stem cells are immune cells (Figures 4G and S1G). (F) Chip-qPCR analysis of RelA binding sites using primary cultured HBCs. Sequence and location are indicated in above table. A region lacking a binding site was examined as negative control (Neg). n = 3 biological replicates. (G and H) Immunostaining of Ki67 and CD45 in Krt5cre-IOI-Rosa26-stopflox/flox-tdTomato mice (G), and quantification of Ki67+/tdTomato+ proliferating basal cells (H). n = 4 mice. Data are represented as mean ± SEM. *P < 0.05; **P < 0.01; ***P < 0.001. P values were calculated by unpaired two tailed Student’s t-test (C and D) or by one-way ANOVA (F); NS, not significant. Experiments were replicated at least twice except (A and B). Scale bars, 25 μm (E and G). See also Figure S4.
Figure 5.
Figure 5.. HBC signaling activates immune defense by macrophages
(A) qPCR analysis of Tgfb1, Foxp3, and Il6 mRNA expression in whole olfactory mucosa after Dox induction. Data at indicated time periods was collected from 3 mice. (B) Upregulated immune defense-related transcription factors in sorted HBCs after 6 w Dox treatment. (C) Representative image of Krt5 and CCL20 staining in olfactory epithelium after 8 weeks of Dox treatment. (D) Immunostaining of Krt5 in RelA ablated IOI mice after 6 w Dox treatment. (E and F) Quantification of CD4+/Foxp3+ Treg (E) and representative flow cytometric plots (F). IOI mice (Ctrl, Isotype, and NAb) and IOI with HBC RelA deletion (RelAΔ/Δ) were administered Dox for 6 weeks. To block HBC chemokines, isotype IgG or anti-CCL19 and anti-CCL20 neutralizing antibody (NAb) were administered for 5 consecutive days. A total of 1 × 10⁴ CD45+ immune cells were presented. (G and H) Representative images of F4/80 and IL-6 co-staining (G), and the percentage of IL-6 expressing macrophages (H). n = 4 mice. (I) qPCR analysis of indicated genes expression in macrophage cultures after 3 h of CCL19 or CCL20 treatments. n = 3 mice. (J) Morphology of F4/80+ cells in whole mount olfactory mucosa with or without CCL19 and CCL20 stimulation. Tissue was resting in DMEM without serum for 2 hours before chemokines stimulation. (K and L) Representative images of F4/80+ macrophages ingesting Zymosan beads (K), and quantification of Zymosan beads in each cell (L). n = 8 fields of 40 x images. Data are represented as mean ± SEM. *P < 0.05; **P < 0.01; ***P < 0.001. P values were calculated by unpaired two tailed Student’s t-test (H and L) or by one-way ANOVA (E and I). Scale bars, 10 μm (G, J, and K), 25 μm (C), 100 μm (D). See also Figure S5.
Figure 6.
Figure 6.. Olfactory inflammation in CRS is associated with neural stem cell dysfunction
(A–C) Quantification of CD45+ cells (B) or β-Tubulin III+ immature OSNs (C) in human olfactory biopsy (A). CRS-S, CRS subjects with severe inflammatory cell infiltration. (D and E) Immunostaining of CD3 and CD45 (D), and percentage of CD3+ T lymphocytes in total immune cells (E). (F and G) Immunostaining analysis of immune cell local proliferation. Graph shows the percentage of Ki67+ subpopulation in total CD45+ cells. (H–J) Triple-staining of Krt5, P63 and OSNs marker OMP(H). OMP+ OSNs (I) and P63+ HBCs (J) in control and CRS were counted. (K) Representative images of CCL2 expression in olfactory biopsy. Dots in graph represent independent patients. Data are represented as mean ± SEM. *P < 0.05; **P < 0.01, ***P < 0.001. P values were calculated by unpaired two tailed Student’s t-test (E, G, I, and J) or by one-way ANOVA (B and C). Scale bars, 25 μm. See also Figure S6.

Comment in

References

    1. Adam RC, Yang H, Rockowitz S, Larsen SB, Nikolova M, Oristian DS, Polak L, Kadaja M, Asare A, Zheng D, et al. (2015). Pioneer factors govern super-enhancer dynamics in stem cell plasticity and lineage choice. Nature 521, 366–370. - PMC - PubMed
    1. Afonina IS, Zhong Z, Karin M, and Beyaert R (2017). Limiting inflammation-the negative regulation of NF-kappaB and the NLRP3 inflammasome. Nat Immunol 18, 861–869. - PubMed
    1. Ali N, Zirak B, Rodriguez RS, Pauli ML, Truong HA, Lai K, Ahn R, Corbin K, Lowe MM, Scharschmidt TC, et al. (2017). Regulatory T Cells in Skin Facilitate Epithelial Stem Cell Differentiation. Cell 169, 1119–1129 e1111. - PMC - PubMed
    1. Artis D (2008). Epithelial-cell recognition of commensal bacteria and maintenance of immune homeostasis in the gut. Nat Rev Immunol 8, 411–420. - PubMed
    1. Ashburner M, Ball CA, Blake JA, Botstein D, Butler H, Cherry JM, Davis AP, Dolinski K, Dwight SS, Eppig JT, et al. (2000). Gene ontology: tool for the unification of biology. The Gene Ontology Consortium. Nat Genet 25, 25–29. - PMC - PubMed

Publication types