. 2019 Oct 3;25(4):486-500.e9.
doi: 10.1016/j.stem.2019.08.005. Epub 2019 Sep 12.

Mitigating Antagonism between Transcription and Proliferation Allows Near-Deterministic Cellular Reprogramming

Affiliations

Mitigating Antagonism between Transcription and Proliferation Allows Near-Deterministic Cellular Reprogramming

Kimberley N Babos et al. Cell Stem Cell. .

Abstract

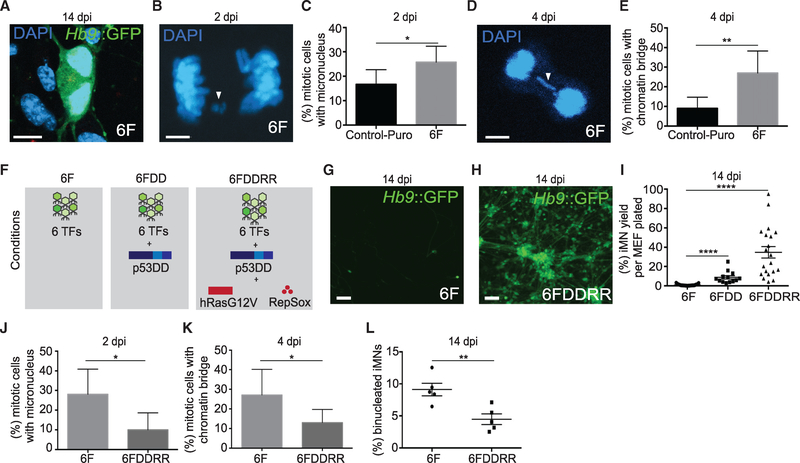
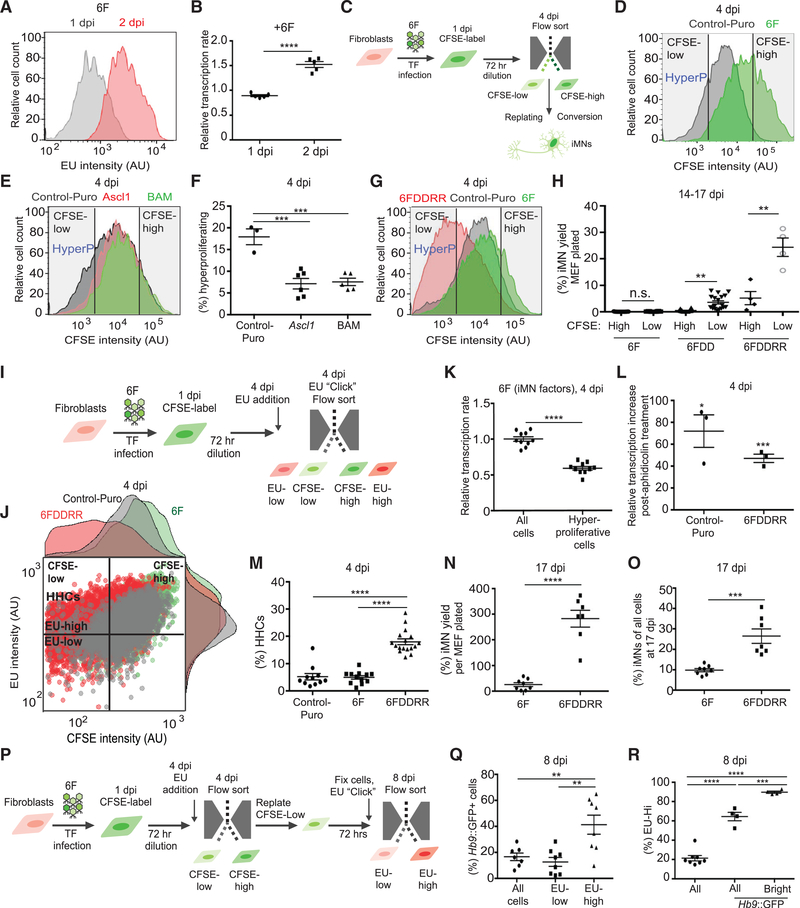
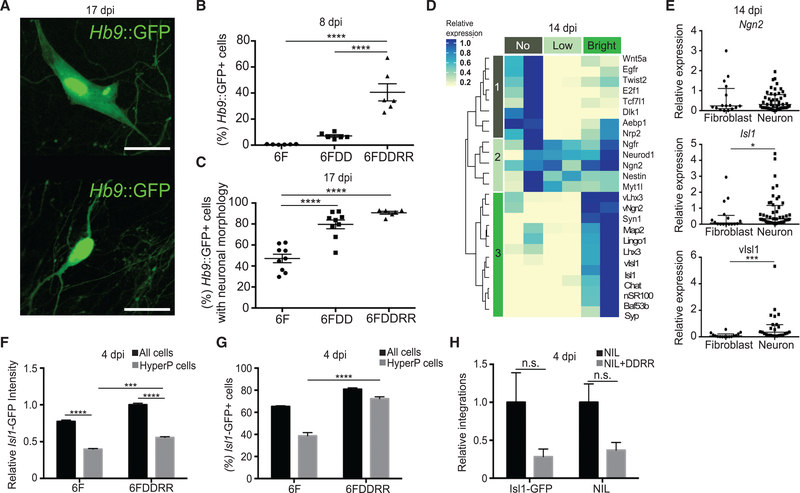
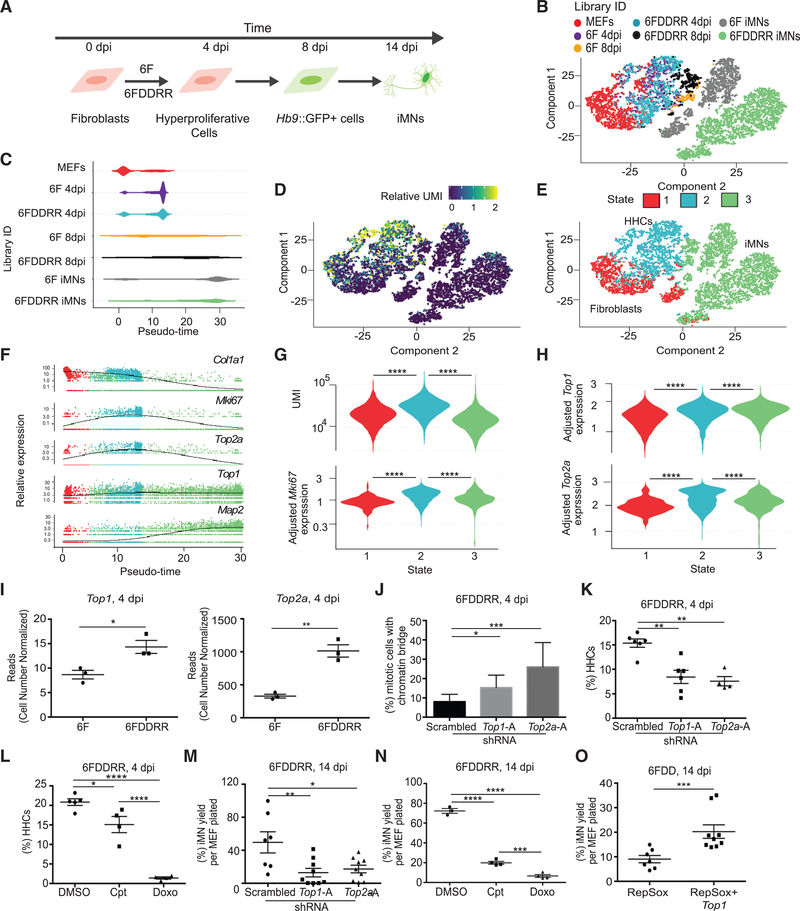
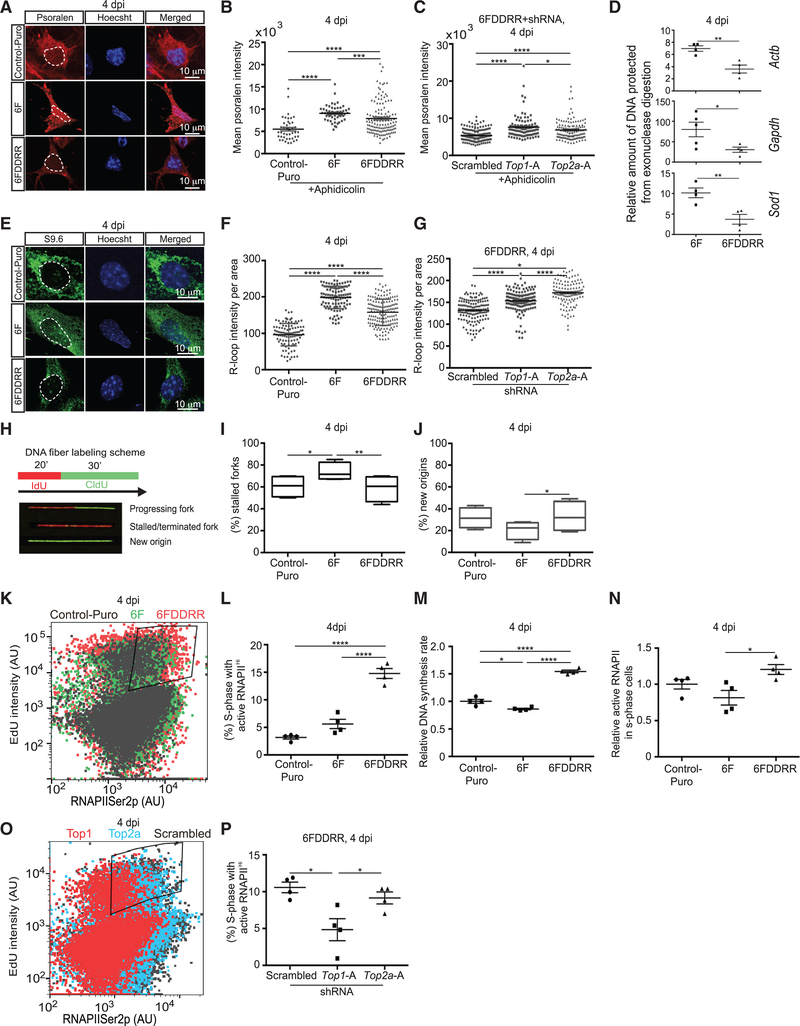
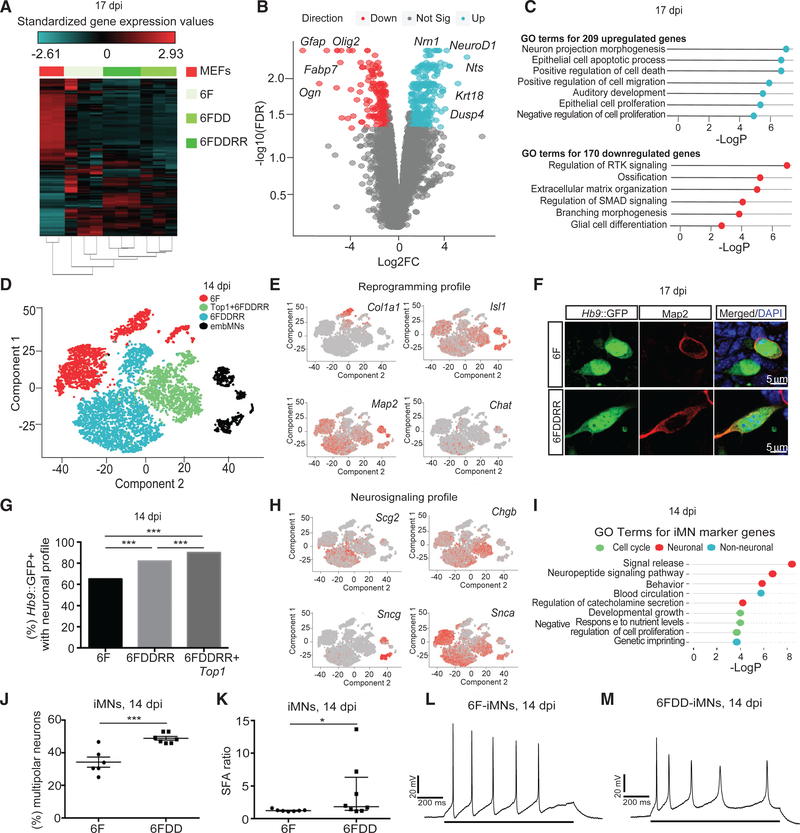
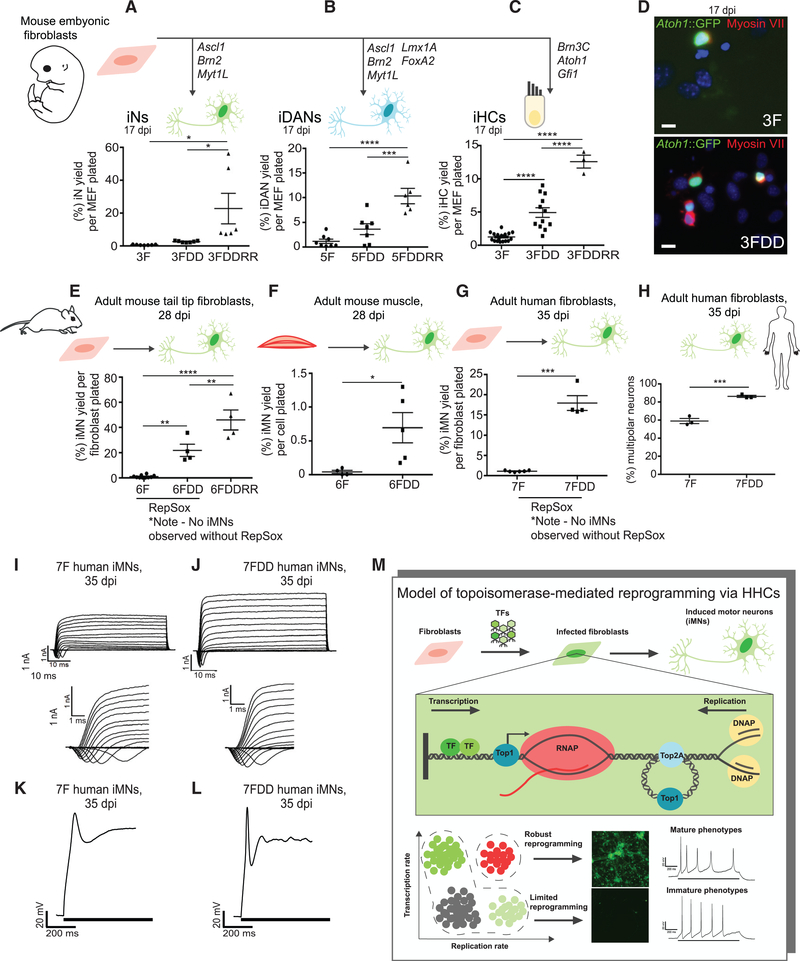
Although cellular reprogramming enables the generation of new cell types for disease modeling and regenerative therapies, reprogramming remains a rare cellular event. By examining reprogramming of fibroblasts into motor neurons and multiple other somatic lineages, we find that epigenetic barriers to conversion can be overcome by endowing cells with the ability to mitigate an inherent antagonism between transcription and DNA replication. We show that transcription factor overexpression induces unusually high rates of transcription and that sustaining hypertranscription and transgene expression in hyperproliferative cells early in reprogramming is critical for successful lineage conversion. However, hypertranscription impedes DNA replication and cell proliferation, processes that facilitate reprogramming. We identify a chemical and genetic cocktail that dramatically increases the number of cells capable of simultaneous hypertranscription and hyperproliferation by activating topoisomerases. Further, we show that hypertranscribing, hyperproliferating cells reprogram at 100-fold higher, near-deterministic rates. Therefore, relaxing biophysical constraints overcomes molecular barriers to cellular reprogramming.

Keywords: Repsox; genomic instability; hypertranscription; p53; reprogramming; single-cell RNA-seq; topoisomerase; transcription factor; transcription rate.


Conflict of interest statement

DECLARATION OF INTERESTS

J.K.I. is a co-founder of AcuraStem and is bound by confidentiality agreements that prevent him from disclosing details of his financial interests in this work. Other authors declare no competing interests.

Figures

Figure 1.
Figure 1.. Genetic and Chemical Factors Relieve Genomic Stress and Reprogramming Block
(A) Binucleated iMN at 14 dpi. Scale bar represents 10 μm. (B) Mitotic cell with a micronucleus at 2 dpi. Arrow denotes micronucleus. Scale bar represents 5 μm. In Figure 1, mitotic cells were identified based on morphology of DAPI+ nuclei as described (Slattery et al., 2012). (C) Percentage of mitotic anaphase-telophase cells with a micronucleus at 2 dpi. Anaphase-telophase cells with a non-integrated DNA fragment were scored as having micronuclei. n = 150–175 cells from 3–6 independent conversions per condition. Percentage ± 95% confidence interval is shown; chi-square test. (D) Mitotic cell with a chromatin bridge at 4 dpi. Arrow denotes bridge. Scale bar represents 10 μm. (E) Percent of mitotic anaphase-telophase cells with a chromatin bridge at 4 dpi. Anaphase-telophase cells with a DNA strand between daughter cells were scored as having a bridge. n = 63–100 cells from 3–6 independent conversions per condition. Percentage ± 95% confidence interval per condition is shown; chi-square test. (F) Legend of genetic and chemical combinations used in conversion. 6F, 6 transcription factors only; 6FDD, 6 transcription factors and p53DD, a p53 mutant; 6FDDRR, 6 transcription factors and p53DD, hRasG12V, and RepSox. (G) 6F iMNs, 14 dpi. Scale bar represents 100 μm. (H) 6FDDRR-iMNs, 14 dpi. Scale bar represents 100 μm. (I) iMN yield in 6F, 6FDD, or 6FDDRR conditions at 14 dpi. Conversion yield determined by counting Hb9::GFP+ cells with neuronal morphology divided by number of cells seeded is shown. n = 10–20 independent conversions per condition. Mean ± SEM; one-way ANOVA. (J) Percentage of mitotic anaphase-telophase cells with a micronucleus at 2 dpi. n = 100 cells from 3 independent conversions per condition. Percentage ± 95% confidence interval is shown; chi-square test. (K) Percentage of mitotic anaphase-telophase cells with a chromatin bridge at 4 dpi. n = 100 cells from 3 independent conversions per condition. Percentage ± 95% confidence interval is shown; chi-square test. (L) Percentage of binucleated iMNs at 14 dpi; n = 6 independent conversions; mean ± SEM; unpaired t test. Significance summary: p > 0.05 (ns); *p ≤ 0.05; **p ≤ 0.01; ***p ≤ 0.001; and ****p ≤ 0.0001.
Figure 2.
Figure 2.. Hypertranscribing and Hyperproliferating Cells Drive Reprogramming
(A) FACS plot showing relative EU incorporation in viable cells from 6F-infected MEF cultures at 1 and 2 dpi. Cell viability was determined by forward scatter (FSC) and side scatter (SSC) profiles in FACS analysis. (B) Relative transcription rate measured by EU incorporation via flow cytometry at 1 and 2 dpi in 6F-infected MEFs compared to uninfected control. Mean EU intensity of non-transduced MEFs = 1. Only viable cells, determined by FSC and SSC profile via FACS, were analyzed. n = 5 independent transductions per condition. Mean ± SEM; unpaired t test. (C) Schematic of CSFE-based flow sorting and replating of populations for reprogramming assays. (D) CFSE intensity measured by flow cytometry at 4 dpi. “HyperP,” hyperproliferating cells, defined as cells showing a two-fold increase in division rate (an 8-fold decrease in CFSE intensity) compared to the average of Control-Puro MEFs. (E) CFSE intensity measured by flow cytometry for Puro-infected cells (control), Ascl1-infected cells, or Brn2+Ascl1+Myt1l-infected cells (BAM) at 4 dpi. (F) Effect of addition of Ascl1 or neuronal reprogramming factors BAM on the percentage of hyperproliferating cells measured by flow cytometry at 4 dpi. n = 3–6 independent transductions per condition. Mean ± SEM; one-way ANOVA. (G) CFSE intensity measured by flow cytometry at 4 dpi with gates showing CFSE-low (HyperP) and CFSE-high. (H) Yield of iMNs from reprogramming populations sorted by CFSE intensity (CFSE-low and CFSE-high) at 4 dpi. Percent yield determined by counting total iMNs normalized by total number of cells counted per population at 4 dpi is shown. n = 4–23 independent conversions per condition. For 6F and 6FDD, median ± interquartile range and Mann-Whitney test between CFSE high and low groups in each transduction condition are shown. For 6FDDRR, mean ± SEM. Unpaired t test between CFSE high and low groups is shown. (I) Schematic of CFSE-EU assay for measuring transcription and proliferation rates via flow cytometry at 4 dpi. (J) Dot plot of CFSE intensity and fluorescently labeled EU for Control-Puro (gray), 6F (green), and 6FDDRR (red). Histograms of CFSE and EU intensity adjacent to dot plot are shown. Quadrant to demark HHCs set by reference to 6F condition is shown. Hyperproliferating and slow cycling cells set by selecting CFSE value in 6F condition to allow the dimmest 15% are shown. High EU values set by top half of 6F condition are shown, resulting in ~7% HHCs in 6F. K) Relative transcription rate measured by EU incorporation via flow cytometry at 4 dpi of the whole population (all cells) of 6F-infected cells compared to hyperproliferative cells measured in 6F-infected MEFs. n = 10 independent transductions per condition. Mean ± SEM; one-way ANOVA. (L) Percent relative transcription rate increase upon inhibition of DNA synthesis with aphidicolin treatment at 4 dpi. Relative transcription rate determined by difference between rates with and without aphidicolin treatment normalized to without for each transduction condition. n = 3 independent transductions per condition. Mean ± SEM; unpaired t test between with and without aphidicolin treatment for each transduction condition. (M) Percentage of HHCs. n = 11–16 independent conversions per condition. Median ± interquartile range is shown; Kruskal-Wallis test. (N) Yield of Hb9::GFP+ cells counted via flow cytometry at 17 dpi normalized to number of seeded cells. n = 7–8 independent conversions per condition. Mean ± SEM; unpaired t test. (O) Yield of Hb9::GFP+ cells normalized to total cell number at 17 dpi. Cells were quantified via flow cytometry at 17 dpi. n = 7 or 8 independent conversions per condition. Mean ± SEM; unpaired t test. (P) Schematic of CFSE-EU-pulse label assay to sort and label HHCs at 4 dpi followed by evaluation of Hb9::GFP intensity at 8 dpi. (Q) Percentage of Hb9::GFP+ cells in 6FDDDR conditions for various gated populations. Cells gated for low EU intensity are shown. EU-low, cells with EU intensity in the lowest three quartiles, and EU-high, cells with EU intensity in the top quartile, at 8 dpi compared to all viable cells are shown, both EU-high and EU-low (all cells). Viable cells defined based on FSC and SSC profiles via FACS are shown. n = 7 or 8 independent conversions. Mean ± SEM; one-way ANOVA. (R) Percentage of replated hyperproliferating cells in 6FDDRR conditions gated for high EU intensity (cells with EU intensity in the top quartile as measured by FACS) at 8 dpi. By definition, the whole viable population (all) contained 25% EU-Hi cells and Hb9::GFP+ and Hb9::GFP+ Bright cells (Hb9::GFP intensity in the top half of all viable Hb9+ cells) displayed enrichment of EU-high cells. n = 4–8 independent conversions. Median ± interquartile range is shown; Kruskal-Wallis test. Significance summary: p > 0.05 (ns); *p ≤ 0.05; **p ≤ 0.01; ***p ≤ 0.001; and ****p ≤ 0.0001.
Figure 3.
Figure 3.. Sustained Transgene Expression Differentiates Complete from Partial Reprogramming
(A) Hb9::GFP+ cells with fibroblast (top) or neuronal (bottom) morphology at 17 dpi. Scale bars represent 20 μm. (B) Percentage of Hb9::GFP+ cells of all viable cells measured by flow cytometry at 8 dpi. n = 6 independent conversions per condition. Mean ± SEM; one-way ANOVA. (C) Percentage of Hb9::GFP+ cells with neuronal morphology of total Hb9::GFP+ cells at 17 dpi. n = 9 independent conversions per condition. Mean ± SEM; one-way ANOVA. (D) Relative gene expression of cells collected at 14 dpi sorted based on No, Low, or Bright Hb9::GFP expression. Bright Hb9::GFP, cells in the top 50% of Hb9::GFP in the 6F condition. Gene expression was calculated based on qRT-PCR data. The expression level that was highest among the three conditions was set to 1 and used to normalize levels for the other two conditions. n = 2 independent experiments for each condition. (E) Relative expression for single cells with either fibroblast (n = 16) or neuronal (n = 39) morphology for qPCR assays for endogenous Ngn2 and Isl1 and viral Isl1 (vIsl1). Median ± interquartile range is shown; Mann-Whitney test. (F) Relative Isl1-GFP intensity in all viable cells (all) and HyperP infected with Isl1-GFP and 6F or 6FDDRR measured by flow cytometry at 4 dpi. n = 4–6 independent transductions per condition. Mean ± SEM; one-way ANOVA. (G) Percentage of Isl1-GFP+ cells in all viable cells (all) and HyperP measured by flow cytometry at 4 dpi. Isl1-GFP+ determined by expression exceeding fluorescein isothiocyanate (FITC) values for untransfected cells is shown. n = 6 independent transductions per condition. Mean ± SEM; one-way ANOVA. (H) Relative integrations of Isl1-GFP and NIL viruses in cells collected at 4 dpi. Relative integrations determined by qPCR are shown. Delta Ct of transgene calculated by difference of Ct between transgene and endogenous genomic region is shown. Relative integrations calculated by normalizing to NIL condition are shown. n = 3 independent transductions per condition. Mean ± SEM; one-way ANOVA. Significance summary: p > 0.05 (ns); *p ≤ 0.05; **p ≤ 0.01; ***p ≤ 0.001; and ****p ≤ 0.0001.
Figure 4.
Figure 4.. Topoisomerase Expression Enables Cells to Exhibit Both Hyperproliferation and Hypertranscription
(A) Schematic of populations collected across conversion and profiled via single-cell RNA-seq. Individual libraries were prepared for MEFs (1,357 cells), hyperproliferating cells (CFSE-low) for 6F (1,174 cells) and 6FDDRR (1,189 cells) collected at 4 dpi (6F 4 dpi and 6FDDRR 4 dpi), and Hb9::GFP+ cells for 6F (259 cells) and 6FDDRR (406 cells) at 8 dpi (6F 8 dpi and 6FDDRR 8 dpi) and 6F iMNs (1,863 cells) and 6FDDRR iMNs (2,869 cells) at 14 dpi (iMNs). (B) t-distributed stochastic neighbor embedding (tSNE) projection of all cells mapped during reprogramming colored by condition. (C) Distribution of pseudotime across cells in each condition. (D) Relative UMI distribution across cells. (E) Clustering of three cellular states across the tSNE projection. (F) Relative expression of Col1a1, Mki67, Top2a, Top1, and Map2 over pseudotime. Colors correspond to states identified in (E). (G) Violin plot of UMI (top, unique molecular identifiers) and relative Mki67 expression (bottom) for clusters identified in (E). (H) Violin plot of relative expression of Top1 (top) and Top2a (bottom) for clusters identified in (E). (I) Reads from Top1 and Top2a quantified by cell number normalized (CNN) RNA-seq at 4 dpi. (J) Percentage of mitotic anaphase-telophase cells with a chromatin bridge at 4 dpi for 6FDDRR conditions. n = 3 independent conversions per condition,n = 50–70 cells per condition. Percentage ± 95% confidence interval; chi-square test. (K) Percentage of HHCs in 6FDDRR conditions. n = 4–6 independent conversions per condition. Mean ± SEM; one-way ANOVA. (L) Percentage of HHCs in 6FDDRR conditions treated for 18 h with camptothecin (Cpt) or doxorubicin (Doxo) prior to 4 dpi compared to DMSO control. n = 4 or 5 independent conversions per condition. Mean ± SEM; one-way ANOVA. (M) Yield of iMNs in 6DDDRR conditions at 14 dpi. n = 7–9 independent conversions per condition. Mean ± SEM; one-way ANOVA. (N) Yield of iMNs at 14 dpi in 6FDDRR conditions treated for 18 h with Cpt or Doxo prior to 4 dpi compared to DMSO control. n = 3 or 4 independent conversions per condition. Mean ± SEM; one-way ANOVA. (O) Yield of iMNs at 14 dpi in 6FDD condition treated with RepSox with or without Top1 overexpression. n = 7–9 independent conversions per condition. Mean ± SEM; unpaired t test. Significance summary: p > 0.05 (ns); *p ≤ 0.05; **p ≤ 0.01; ***p ≤ 0.001; and ****p ≤ 0.0001.
Figure 5.
Figure 5.. DDRR and Topoisomerase Expression Reduces Negative DNA Supercoiling and R-Loop Formation and Sustains Transcription in S Phase
(A) Psoralen incorporation at 4 dpi. Scale bars represent 10 μm. Dotted white lines outline the nucleus. (B) Mean intensity of biotinylated psoralen conjugated streptavidin-Alexa Fluor 594 at 4 dpi. Cultures treated with 1 μM aphidicolin for 2 h prior to collection at 4 dpi are shown. n = 42–130 cells from 3 independent conversions per condition. Median ± interquartile range is shown; Kruskal-Wallis test. (C) Mean intensity of biotinylated psoralen conjugated streptavidin-Alexa Fluor 594 at 4 dpi in 6FDDRR conditions at 4 dpi. n = 99–162 cells from 3 independent conversions per condition. Median ± interquartile range is shown; Kruskal-Wallis test. (D) Relative amount of DNA protected by exonuclease digestion in regions 500 bp upstream of transcription start sites for listed genes at 4 dpi. n = 4 independent transductions per condition per gene. Mean ± SEM; unpaired t test. (E) R-loop immunostaining (S9.6) at 4 dpi. Scale bars represent 10 μm. Dotted white lines outline the nucleus. (F) R-loop intensity per area at 4 dpi. n = 101–158 cells from 3 independent conversions per condition. Median ± interquartile range is shown; Kruskal-Wallis test.(G) R-loop intensity per area at 4 dpi in 6FDDRR conditions. n = 119–135 cells from 3 independent conversions per condition. Median ± interquartile range is shown; Kruskal-Wallis test. (H) DNA fiber labeling scheme to identify progressing replication forks (red-green), stalled forks (red only), and new origins (green only). (I) Relative number of stalled replication forks at 4 dpi. Stalled replication forks were quantified and normalized to all replicative fiber species to generate the percentage of stalled replication forks. n = 1,000 fibers per condition from 4 independent transductions. Percentage ± 95% confidence interval is shown; Fisher’s exact test. (J) Relative number of new origins at 4 dpi. New origins were quantified and normalized to all replicative fiber species to generate the percentage of stalled replication forks. n = 1,000 fibers per condition from 4 independent transductions. Percentage ± 95% confidence interval is shown; Fisher’s exact test. (K) Dot plot of EdU and active RNA polymerase II intensity at 4 dpi for Control-Puro (gray), 6F (green), and 6FDDRR (red). Gating to demark S phase cells with high active RNAPII (RNAPII Ser2p) is shown. S phase determined by intensity above EdU incorporation in non-proliferative, irradiated MEFs is shown (Figure S4H). High RNAPIISer2p, the top quartile of RNAPIISer2p intensity in Control-Puro infected cells in S phase cells. (L) Percentage of cells in S phase with high RNAPII activity from area gated in (K) measured via flow cytometry at 4 dpi. Percentage relative to total viable cell population based on FSC and SSC profile via FACS is shown. n = 4 independent conversions per condition. Mean ± SEM; one-way ANOVA. (M) Relative DNA synthesis rate of S phase cells at 4 dpi. Relative DNA synthesis rate determined by EdU intensity of S phase population normalized to EdU intensity of S phase population in Control-Puro condition is shown. n = 4 independent conversions per condition. Mean ± SEM; one-way ANOVA. (N) Relative active RNAPII of S phase cells at 4 dpi. Relative active RNAPII rate in S phase cells determined by intensity of RNAPII Ser2p in S phase population normalized to intensity of RNAPII Ser2p in S phase population in Control-Puro condition is shown. n = 4 independent conversions per condition. Mean ± SEM; one-way ANOVA. (O) Dot plot of EdU and active RNA polymerase II intensity at 4 dpi for 6FDDRR+Scrambled shRNA (gray), 6FDDRR+shTop2a (blue), and 6FDDRR+shTop1 (red) shRNAs. Gating to demark S phase cells with high active RNAPII (RNAPII Ser2p) is shown. (P) Percentage of cells in S phase with high RNAPII activity from area gated in (O) at 4 dpi in 6FDDRR conditions. n = 4 independent conversions per condition. Mean ± SEM; one-way ANOVA. Significance summary: p > 0.05 (ns); *p ≤ 0.05; **p ≤ 0.01; ***p ≤ 0.001; and ****p ≤ 0.0001.
Figure 6.
Figure 6.. Converting HHCs Adopt the Induced Motor Neuron Transcriptional Program and Accelerate Morphological Maturation
(A) RNA-seq heatmap for Hb9::GFP+ cells at 17 dpi from different conditions compared to starting MEFs across the 1,186 genes that are differentially expressed between MEFs and Hb9::GFP+ cells. n = 3 independent conversions per condition. (B) Volcano plot comparison of genes up- (blue) or downregulated (red) in Hb9::GFP+ cells at 17 dpi. (C) List of gene ontology (GO) terms for genes upregulated (top, blue) or downregulated (bottom, red) in 6FDDRR cells compared to 6F at 17 dpi. (D) tSNE projection of Hb9::GFP+ embryonic motor neurons (embMNs) collected at 12.5 dpi and iMNs generated by three different cocktails (6F, 6FDDRR, and 6FDDRR+Top1) colored by individual condition. embMNs were bioinformatically identified by Isl1 expression to distinguish from other Hb9::GFP+ populations. (E) Relative expression colored by intensity of Col1a1, Isl1, Map2, and Chat over the populations in the tSNE in (D). (F) Hb9::GFP+ iMNs immunostained for Map2 at 17 dpi. Scale bars represent 5 μm. (G) Percentage of the Hb9::GFP+ cell population with neuronal gene expression profile at 17 dpi. (H) Relative expression of neurosignaling genes (i.e., Scg2, Chgb, Sncg, and Snca) colored by intensity over the populations in the tSNE in (D). (I) List of gene ontology (GO) terms for marker genes upregulated in iMN clusters. (J) Percentage of multipolar iMNs derived from MEFs at 14 dpi. n = 6 or 7 independent conversions per condition. Mean ± SEM; unpaired t test. (K) SFA ratio evoked action potentials (Aps) of mouse iMNs at 14 dpi. n = 7 or 8 cells from 3 independent conversions per condition. Median ± interquartile range is shown; Mann-Whitney test. (L and M) Representative action potentials evoked in mouse iMNs by a positive current injection (indicated by solid bar across bottom) illustrating SFA over the course of the stimulus of iMNs in 6FDD (M) and 6F (L) conditions at 14 dpi. Significance summary: p > 0.05 (ns); *p ≤ 0.05; **p ≤ 0.01; ***p ≤ 0.001; and ****p ≤ 0.0001.
Figure 7.
Figure 7.. The DDRR Cocktail Boosts Reprogramming across Multiple Cell Types and Species
(A) Yield of induced neurons for different conditions, including control with 3 factors (3F [Brn2, Ascl1, and Myt1l]), 3FDD, and 3FDDRR counted by MAP2+ cells at 17 dpi over number of cells seeded. n = 6 or 7 independent conversions per condition. Mean ± SEM; one-way ANOVA. (B) Yield of induced dopaminergic neurons (iDANs) for different conditions, including control with 5 factors (5F [Brn2, Ascl1, Myt1l, Lmx1A, and FoxA2]), 5FDD, and 5FDDRR counted by MAP2+ cells at 17 dpi. n = 6–8 independent conversions per condition. Mean ± SEM; one-way ANOVA. (C) Yield of induced inner ear hair cells (iHCs) for different conditions, including control with 3 factors (3F [Brn3C, Atoh1, and Gfi1]), 3FDD, and 3FDDRR counted by Atoh1::nGFP+ cells at 17 dpi. n = 3–16 independent conversions per condition. Mean ± SEM; one-way ANOVA. (D) 3F-iHCs and 3FDD-iHCs immunostained with Myosin VIIa at 17 dpi. Scale bars represent 100 μm. (E) Yield of iMNs generated from adult tail tip fibroblasts with 6F, 6FDD (both conditions with RepSox), and 6FDDRR at 28 dpi. n = 4–9 independent conversions per condition. Mean ± SEM; one-way ANOVA. (F) Yield of iMNs generated from Hb9::GFP+ adult mouse muscle explants at 28 dpi. n = 4 or 5 independent conversions per condition. Mean ± SEM; unpaired t test. (G) Yield of iMNs generated from human fibroblasts with factors alone (7F) or 7FDD (both conditions with RepSox), counted by MAP2+ cells at 35 dpi. n = 4–6 independent conversions per condition. Median ± interquartile range is shown; Mann-Whitney test. (H) Percentage of multipolar iMNs derived from primary human fibroblasts at 35 dpi. n = 3 independent conversions per condition. Mean ± SEM; unpaired t test. (I and J) Step voltage depolarizations result in functional sodium and potassium channels in human 7F (I) or 7FDD-iMNs (J) at 35 dpi. (K and L) Action potentials evoked by step current injection in current-clamp configuration for human 7F (K) or 7FDD-iMNs at 35 dpi (L). (L) Model of topoisomerase-mediated reprogramming through hypertranscribing, hyperproliferating cells. Significance summary: p > 0.05 (ns); *p ≤ 0.05; **p ≤ 0.01; ***p ≤ 0.001; and ****p ≤ 0.0001.

Comment in

References

    1. Aguilera A, and García-Muse T (2012). R loops: from transcription byproducts to threats to genome stability. Mol. Cell 46, 115–124. - PubMed
    1. Boguslawski SJ, Smith DE, Michalak MA, Mickelson KE, Yehle CO, Patterson WL, and Carrico RJ (1986). Characterization of monoclonal antibody to DNA.RNA and its application to immunodetection of hybrids. J. Immunol. Methods 89, 123–130. - PubMed
    1. Bowman T, Symonds H, Gu L, Yin C, Oren M, and Van Dyke T (1996). Tissue-specific inactivation of p53 tumor suppression in the mouse. Genes Dev. 10, 826–835. - PubMed
    1. Broderick R, Nieminuszczy J, Blackford AN, Winczura A, and Niedzwiedz W (2015). TOPBP1 recruits TOP2A to ultra-fine anaphase bridges to aid in their resolution. Nat. Commun 6, 6572. - PMC - PubMed
    1. Cahan P, Li H, Morris SA, Lummertz da Rocha E, Daley GQ, and Collins JJ (2014). CellNet: network biology applied to stem cell engineering. Cell 158, 903–915. - PMC - PubMed

Publication types

Substances