The effects of dopamine and dopamine receptor agonists on the phototransduction cascade of frog rods
- PMID: 31523118
- PMCID: PMC6707617
The effects of dopamine and dopamine receptor agonists on the phototransduction cascade of frog rods
Abstract
Purpose: Accumulating evidence suggests that dopamine, the major catecholamine in the vertebrate retina, may modulate cAMP-mediated signaling in photoreceptors to optimize vision in the light/dark cycle. The main putative mechanism of dopamine-induced adaptation changes in photoreceptors is activation of D2-like receptors (D2R), which leads to a decrease of the intracellular cAMP level and reduction of protein kinase A (PKA) activity. However, the mechanisms by which dopamine exerts its regulating effect on the phototransduction cascade remain largely unknown. The aim of the present study was to investigate the effects of dopamine and dopamine receptor agonists on rod photoresponses.
Methods: The experiments were performed on solitary rods of the Rana ridibunda frog. Photoreceptor currents were recorded using a suction pipette technique. The effects of dopamine (0.1-50 µM) and selective dopamine receptor agonists-D1R agonist SKF-38393 (0.1-50 µM), D2R agonist quinpirole (2.5-50 µM), and D1-D2 receptor heterodimer agonist SKF-83959 (50 µM)-were examined.
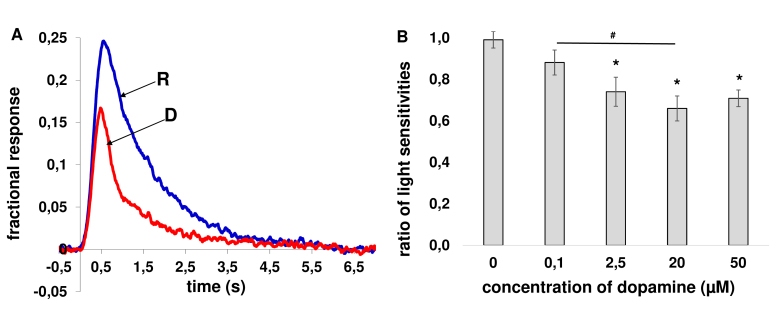
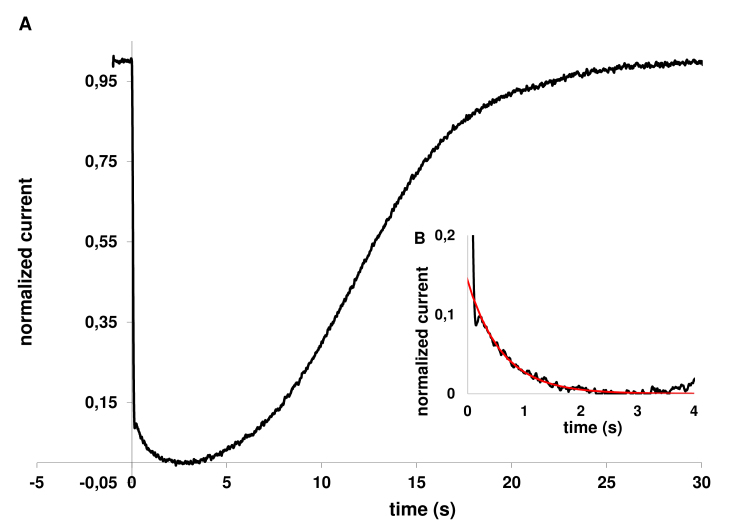
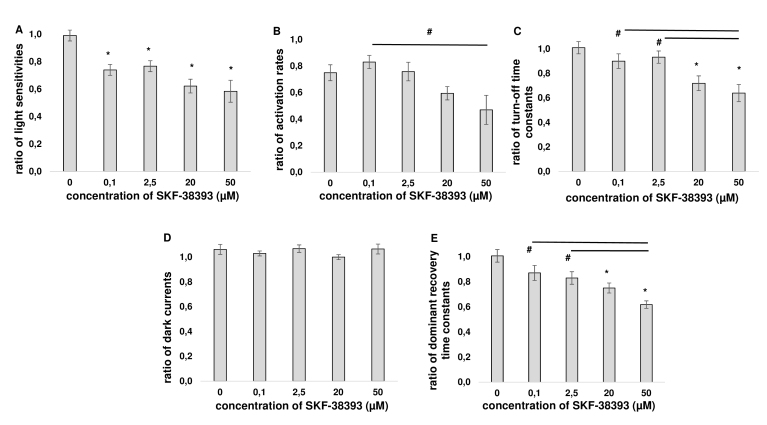
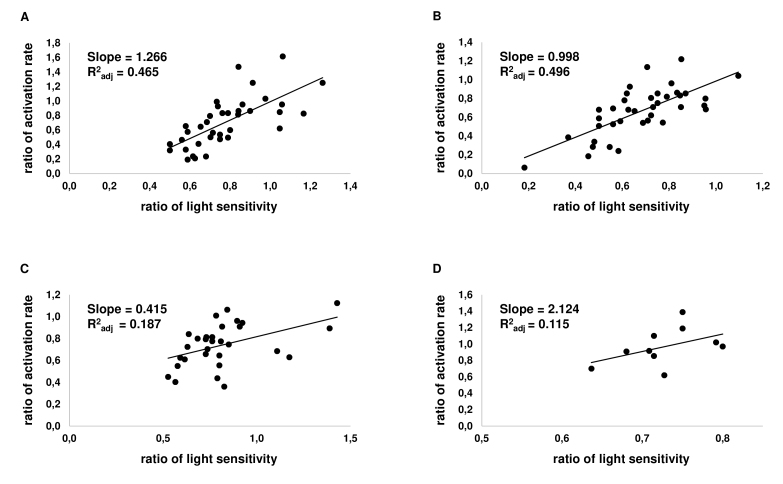
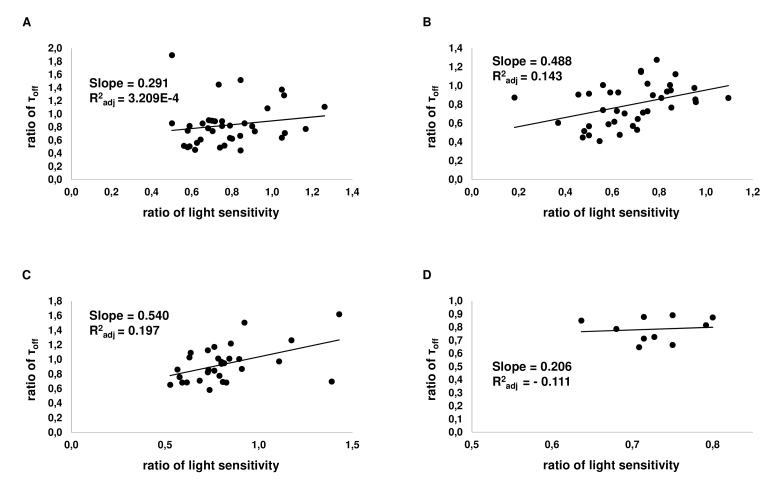
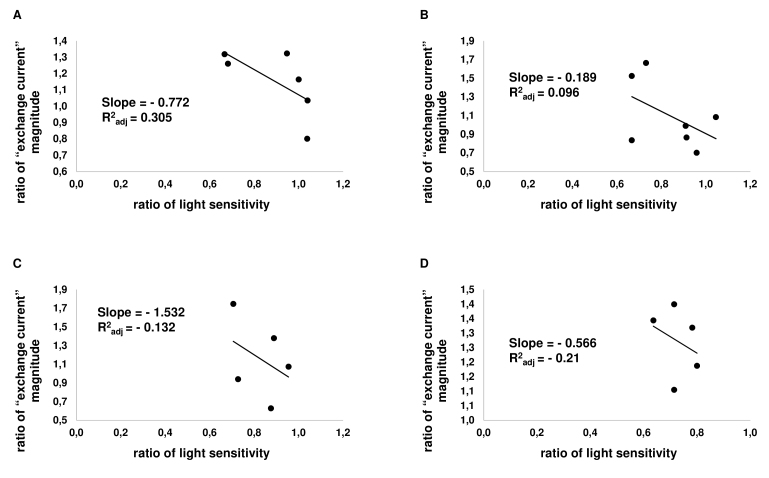
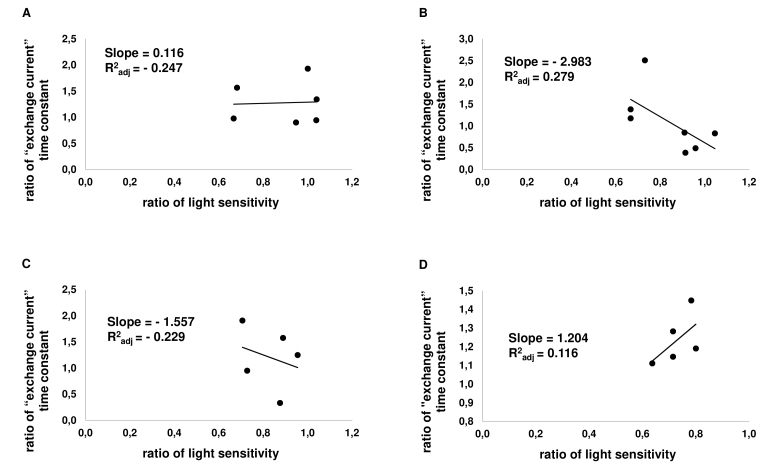
Results: We found that, when applied to the rod inner segments (RISs), dopamine and dopamine receptor agonists had no effect on photoresponses. In contrast, the rods responded to dopamine and all agonists applied to their outer segments by decreasing sensitivity to light. At the highest tested concentration (50 µM), the most prominent effect on light sensitivity was induced by D1R agonist SKF-38393, while dopamine, D2R agonist quinpirole, and D1-D2 receptor heterodimer agonist SKF-83959 produced somewhat lower and approximately equal effects. Moreover, SKF-38393 reduced sensitivity at all tested concentrations starting from the smallest one (0.1 µM), whereas dopamine and quinpirole started their action from the higher concentrations of 2.5 µM and 50 µM, respectively. In addition, dopamine, SKF-38393, and quinpirole, on average, did not change the intracellular calcium level as judged from the "exchange current", while SKF-83959 increased it by ~1.3 times.
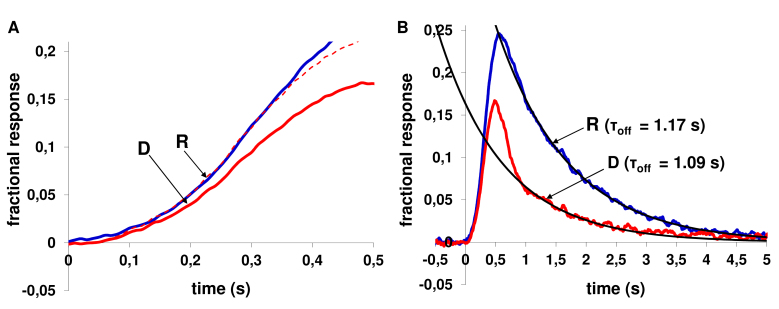
Conclusions: Dopamine induces a decrease in rod sensitivity, mostly by reducing the activation rate of the cascade, and to a much lesser extent, speeding up the turning off of the cascade. The sign of the reaction to all tested drugs, lack of selectivity of dopamine and dopamine receptor agonist action, and analysis of factors that determine sensitivity of photoreceptors suggest that, in rod outer segments (ROSs), dopamine action is mediated by D1-D2 receptor heterodimers but not D1R or D2R alone. This work supports the assumption made earlier by other authors that dopamine exercises its regulatory effect via at least two independent mechanisms, which are cAMP and Ca2+ mediated.
Figures
Similar articles
-
D2 dopamine receptor-mediated inhibition of a hyperpolarization-activated current in rod photoreceptors.J Neurophysiol. 1996 Sep;76(3):1828-35. doi: 10.1152/jn.1996.76.3.1828. J Neurophysiol. 1996. PMID: 8890295
-
Decreased striatal dopamine efflux after intrastriatal application of benzazepine-class D1 agonists is not mediated via dopamine receptors.Brain Res Bull. 2001 Apr;54(6):603-7. doi: 10.1016/s0361-9230(01)00462-2. Brain Res Bull. 2001. PMID: 11403986
-
Endogenous and exogenous dopamine depress EPSCs in rat nucleus accumbens in vitro via D1 receptors activation.J Physiol. 1996 Apr 1;492 ( Pt 1)(Pt 1):143-54. doi: 10.1113/jphysiol.1996.sp021296. J Physiol. 1996. PMID: 8730590 Free PMC article.
-
Tuning outer segment Ca2+ homeostasis to phototransduction in rods and cones.Adv Exp Med Biol. 2002;514:179-203. doi: 10.1007/978-1-4615-0121-3_11. Adv Exp Med Biol. 2002. PMID: 12596922 Review.
-
Dopamine D1 receptor signaling: does GαQ-phospholipase C actually play a role?J Pharmacol Exp Ther. 2014 Oct;351(1):9-17. doi: 10.1124/jpet.114.214411. Epub 2014 Jul 22. J Pharmacol Exp Ther. 2014. PMID: 25052835 Free PMC article. Review.
Cited by
-
Dopaminergic Modulation of Signal Processing in a Subset of Retinal Bipolar Cells.Front Cell Neurosci. 2020 Aug 14;14:253. doi: 10.3389/fncel.2020.00253. eCollection 2020. Front Cell Neurosci. 2020. PMID: 32922266 Free PMC article.
-
Dopamine D1 and D4 receptors contribute to light adaptation in ON-sustained retinal ganglion cells.J Neurophysiol. 2021 Dec 1;126(6):2039-2052. doi: 10.1152/jn.00218.2021. Epub 2021 Nov 24. J Neurophysiol. 2021. PMID: 34817291 Free PMC article.
-
Multiple Roles of cAMP in Vertebrate Retina.Cells. 2023 Apr 14;12(8):1157. doi: 10.3390/cells12081157. Cells. 2023. PMID: 37190066 Free PMC article. Review.
-
Mathematical model for rod outer segment dynamics during retinal detachment.PLoS One. 2024 Jun 7;19(6):e0297419. doi: 10.1371/journal.pone.0297419. eCollection 2024. PLoS One. 2024. PMID: 38848326 Free PMC article.
-
Impaired Light Adaptation of ON-Sustained Ganglion Cells in Early Diabetes Is Attributable to Diminished Response to Dopamine D4 Receptor Activation.Invest Ophthalmol Vis Sci. 2022 Jan 3;63(1):33. doi: 10.1167/iovs.63.1.33. Invest Ophthalmol Vis Sci. 2022. PMID: 35077550 Free PMC article.
References
-
- Witkovsky P. Dopamine and retinal function. Doc Ophthalmol. 2004;108:17–40. - PubMed
-
- Popova E. Role of dopamine in distal retina. J Comp Physiol A Neuroethol Sens Neural Behav Physiol. 2014;200:333–58. - PubMed
-
- Dacey DM. The dopaminergic amacrine cell. J Comp Neurol. 1990;301:461–89. - PubMed
-
- Gingrich JA, Caron MG. Recent advances in the molecular biology of dopamine receptors. Annu Rev Neurosci. 1993;16:299–321. - PubMed
-
- Spano PF, Govoni S, Trabucchi M. Studies on the pharmacological properties of dopamine receptors in various areas of the central nervous system. Adv Biochem Psychopharmacol. 1978;19:155–65. - PubMed
Publication types
MeSH terms
Substances
LinkOut - more resources
Full Text Sources
Miscellaneous