. 2019 Aug 28:7:e7528.
doi: 10.7717/peerj.7528. eCollection 2019.

Comparative transcriptomics reveals the difference in early endosperm development between maize with different amylose contents

Affiliations

Comparative transcriptomics reveals the difference in early endosperm development between maize with different amylose contents

Jianzhou Qu et al. PeerJ. .

Abstract

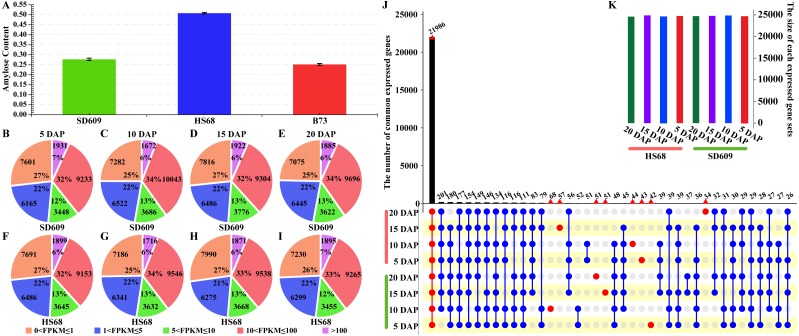
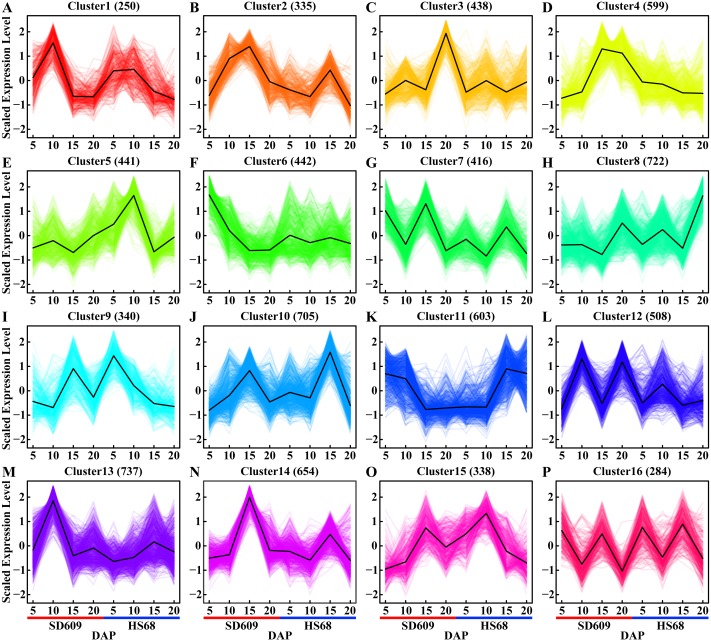
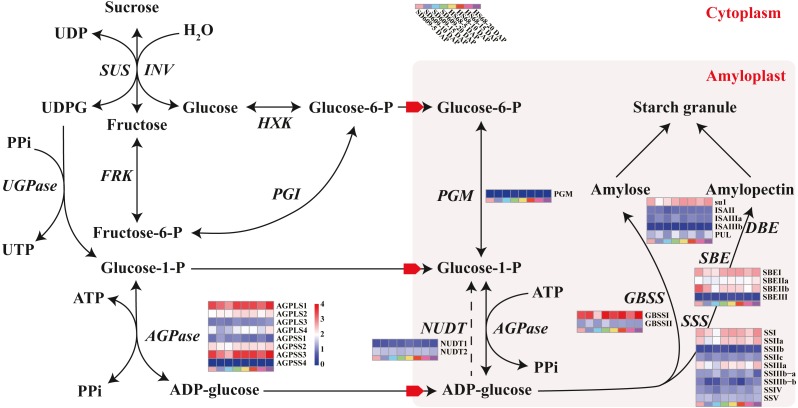
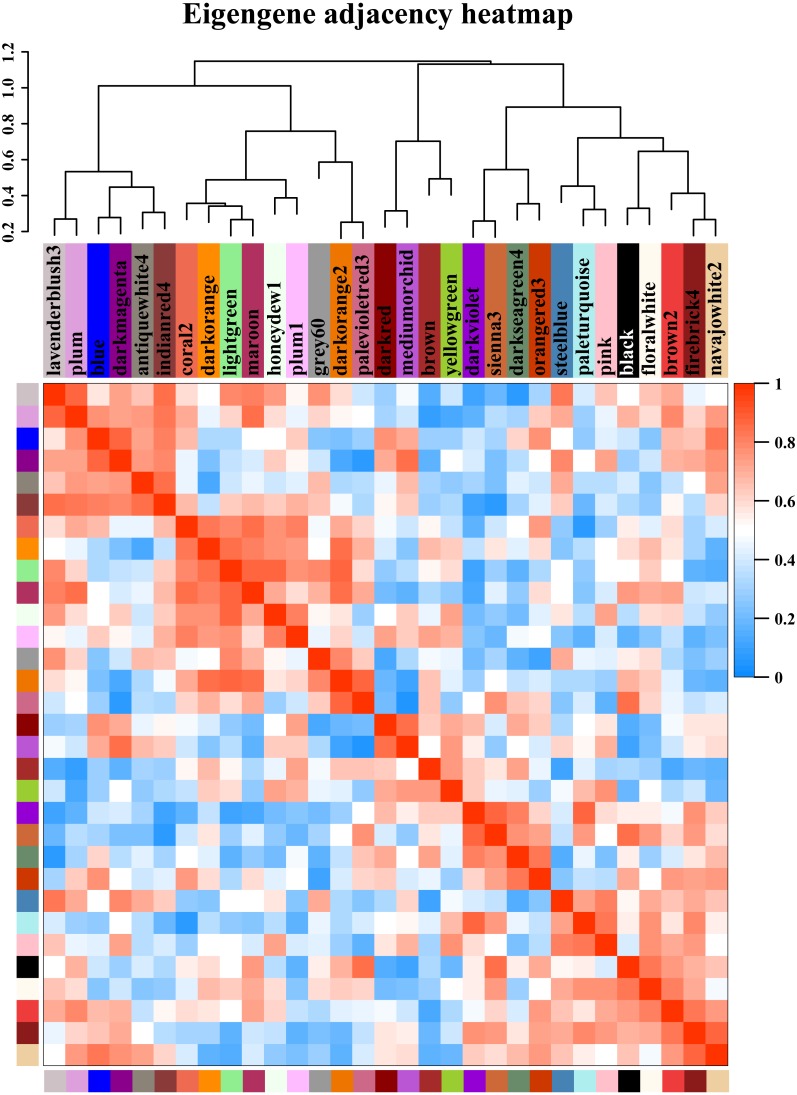
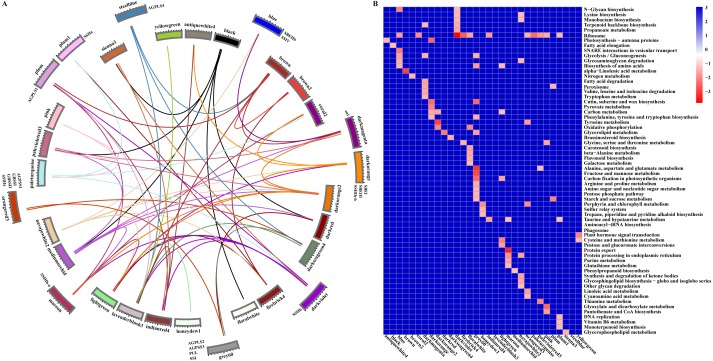
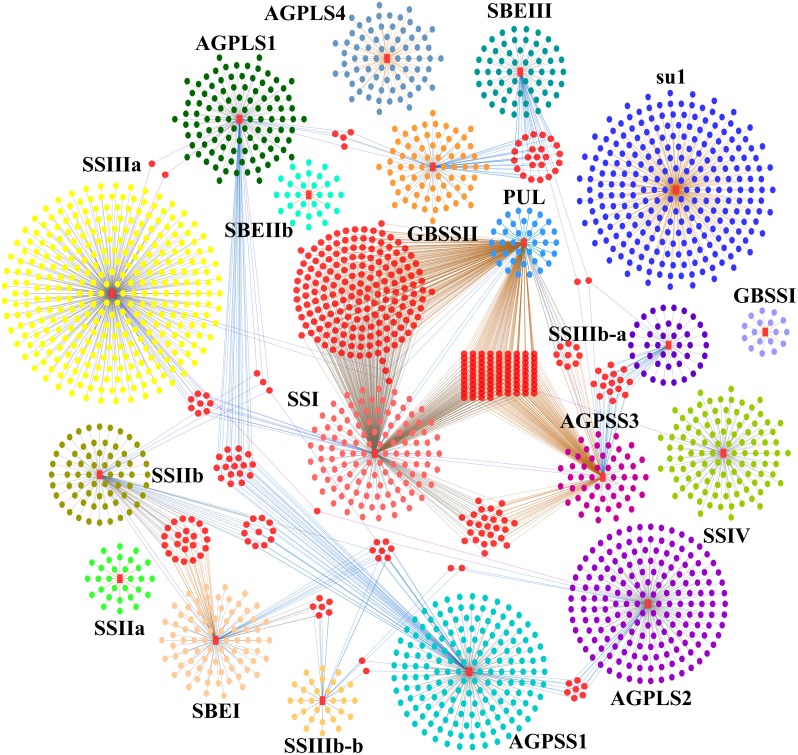
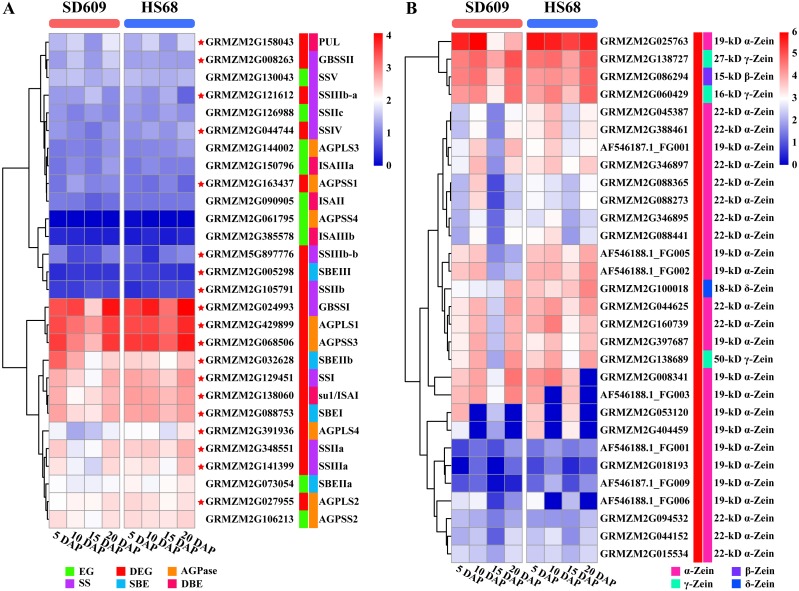
In seeds, the endosperm is a crucial organ that plays vital roles in supporting embryo development and determining seed weight and quality. Starch is the predominant storage carbohydrate of the endosperm and accounts for ∼70% of the mature maize kernel weight. Nonetheless, because starch biosynthesis is a complex process that is orchestrated by multiple enzymes, the gene regulatory networks of starch biosynthesis, particularly amylose and amylopectin biosynthesis, have not been fully elucidated. Here, through high-throughput RNA sequencing, we developed a temporal transcriptome atlas of the endosperms of high-amylose maize and common maize at 5-, 10-, 15- and 20-day after pollination and found that 21,986 genes are involved in the programming of the high-amylose and common maize endosperm. A coexpression analysis identified multiple sequentially expressed gene sets that are closely correlated with cellular and metabolic programmes and provided valuable insight into the dynamic reprogramming of the transcriptome in common and high-amylose maize. In addition, a number of genes and transcription factors were found to be strongly linked to starch synthesis, which might help elucidate the key mechanisms and regulatory networks underlying amylose and amylopectin biosynthesis. This study will aid the understanding of the spatiotemporal patterns and genetic regulation of endosperm development in different types of maize and provide valuable genetic information for the breeding of starch varieties with different contents.

Keywords: Endosperm; Gene expression; Maize; RNA-sequence; Starch metabolism.


Conflict of interest statement

The authors declare there are no competing interests.

Figures

Figure 1
Figure 1. Overview of the amylose content and distribution of the expressed genes.
(A) Amylose contents of SD609, HS68 and B73. (B–I)Distribution of transcripts at five expression levels based on the FPKM values. The pie charts show the number and percentages of transcripts at different expression levels in the SD609 (B-E) and HS68 (F–I) endosperms at different developmental stages. (J–K) Upset plot showing the number of expressed genes that were detected in SD609 and HS68 endosperms among the different development stages.
Figure 2
Figure 2. Expression patterns of shared DEGs between SD609 and HS68.
(A–P) Sixteen clusters were characterized by the fluctuating expression of the gene sets at 5, 10, 15 and 20 DAP in both SD609 and HS68. The up- and downregulated gene sets are staggered or depicted consecutively during the development of the maize endosperm, and the same DEG sets with the same or different expression patterns in two different maize materials are shown. The scaled expression levels of the DEGs are provided on the y-axis, the developmental stages are shown on the x-axis, the coloured lines represent the individual gene expression clusters, and the trend in the expression of each gene set is depicted by a black line. “n” represents the number of DEGs.
Figure 3
Figure 3. Analysis of the expression patterns of candidate genes by qRT-PCR and RNA-Seq.
(A, C, E, G, I, K, M, O, Q, S and U) The scale on the left corresponding to the box plots shows the relative gene expression levels based on the qRT-PCR results. (B, D, F, H, J, L, N, P, R, T and V) The scale on the right corresponding to the line charts indicates the gene expression level based on the RNA-Seq results. The x-axis indicates the day of endosperm sampling after pollination. The letters correspond to the genes. The red lines correspond to SD609, and the blue lines correspond to HS68.
Figure 4
Figure 4. Sucrose and starch biosynthetic pathways in non-photosynthetic cells.
In non-photosynthetic cells, sucrose is degraded via hydrolysis into hexoses (glucose and fructose) through a reaction catalysed by invertase (INV) or reversibly converted into fructose and uridine diphosphate glucose (UDPG) through a reaction catalysed by sucrose synthase (SUS). Fructose is transformed into frutcose-6-phosphate (fructose-6-P) by fructokinase (FRK) and is further metabolized to G-6-P by glucose-6-phosphate isomerase (PGI). Glucose is then transformed into glucose-6-phosphate (G-6-P) by hexokinase (HXK) and translocated into the amyloplasts via phosphate translators. UDPG is further metabolized to glucose-1-phosphate (G-1-P) by the action of UDPG pyrophosphorylase (UGPase). G-1-P, which can also be obtained from the phosphoglucomutase (PGM)-mediated transformation of G-6-P, serves as a precursor for the ADPG pyrophosphorylase (AGPase)-catalysed formation of adenosine diphosphate glucose (ADPG). Both G-1-P and G-6-P are translocated into the amyloplasts via phosphate translators, whereas ADPG is translocated via ADPG transporters. The content of ADP-glucose is also negatively regulated by Nudix hydrolases (NUDTs), which break down ADP-glucose linked to starch biosynthesis, and starch biosynthesis subsequently occurs in the amyloplast. Starch can be chemically classified into two homopolymers: amylose and amylopectin. Amylose is an almost linear α-1,4 glucan molecule synthesized by AGPase and granule-bound starch synthase (GBSS), whereas amylopectin is a highly branched glucan obtained through a coordinated series of enzymatic reactions involving AGPase, soluble starch synthase (SSS), starch branching enzyme (SBE), and starch debranching enzyme (DBE) (Qu et al., 2018). In particular, GBSS is mainly responsible for the synthesis of amylose and long amylopectin chains. Enzymes that catalyse specific reactions are shown in italics. The heat map shows the expression levels of genes encoding the corresponding enzymes, and the scale bar represents the gene expression value (log10 (FPKM +1)).
Figure 5
Figure 5. Modules from weighted gene coexpression network analysis (WGCNA).
Each module was given an arbitrary colour-based name and is summarized by a metric known as the module eigengene (ME), which is the first principal component of the module (i.e., the axis capturing the majority of the variation in expression in the module). The relationships among the modules are shown in the dendrogram and heat map. The values are based on the linear regression coefficients of determination, which were obtained using the module eigengene values from the WGCNA analysis. Higher regression scores indicate more similar expression patterns between the modules or an increased predictive power of the main effects on module expression in the dendrogram (closer clustering) and heat map (deeper red).
Figure 6
Figure 6. Relationship and functional annotation of the modules.
(A) Relationships between different modules. Only the correlation values between different modules that are greater than 0.5 are shown. (B) KEGG enrichment analysis of genes in all the modules. Only metabolic processes with a P value < 0.05 are shown.
Figure 7
Figure 7. Starch biosynthesis community networks.
The nodes correspond to genes, and the edges represent coexpression links. Only those with a weight value greater than 0.5 are shown. These networks include 2804 DEGs and were subdivided into 19 core gene modules based on the key genes of starch synthesis, and these modules are marked with a red colour and the corresponding gene names. Each core gene module is shown with different background colours, and the interactive genes in different modules are distinguished by different colours. The nodes between core gene modules are marked with a pink colour.
Figure 8
Figure 8. Expression map of core genes of starch synthesis and zein genes.
(A–B) Heat map showing the expression patterns of core genes of starch synthesis (A) and zein genes (B) in the SD609 and HS68 endosperms at different developmental stages. The scale bar shows the normalized FPKM values.
Figure 9
Figure 9. Cis-regulatory elements in promoter regions of core genes of starch synthesis.
(A–R) Heat map showing the number of regulatory elements identified in core genes of starch synthesis. The scale bar corresponds to the left side, which shows the name and classification of regulatory elements according to the PlantCARE database. The right side shows the sequence information corresponding to the element. The scale bar indicates the range of element numbers. Abbreviations: abscisic acid (ABA), salicylic acid (SA), jasmonic acid (JA), ethylene (ETH), and gibberellin (GA).

References

    1. Abe N, Asai H, Yago H, Oitome NF, Itoh R, Crofts N, Nakamura Y, Fujita N. Relationships between starch synthase I and branching enzyme isozymes determined using double mutant rice lines. BMC Plant Biology. 2014;14:80. doi: 10.1186/1471-2229-14-80. - DOI - PMC - PubMed
    1. Ai Y, Jane J-L. Chapter 3—understanding starch structure and functionality. In: Sjöö M, Nilsson L, editors. Starch in food. Second Edition. Sawston & Cambridge: Woodhead Publishing; 2018. pp. 151–178. - DOI
    1. Assenov Y, Ramírez F, Schelhorn SE, Lengauer T, Albrecht M. Computing topological parameters of biological networks. Bioinformatics. 2008;24:282–284. doi: 10.1093/bioinformatics/btm554. - DOI - PubMed
    1. Bagga S, Adams HP, Rodriguez FD, Kemp JD, Sengupta-Gopalan C. Coexpression of the maize delta-zein and beta-zein genes results in stable accumulation of delta-zein in endoplasmic reticulum-derived protein bodies formed by beta-zein. The Plant Cell. 1997;9:1683–1696. doi: 10.1105/tpc.9.9.1683. - DOI - PMC - PubMed
    1. Becraft PW, Gutierrez-Marcos J. Endosperm development: dynamic processes and cellular innovations underlying sibling altruism. Wiley Interdisciplinary Reviews: Developmental Biology. 2012;1:579–593. doi: 10.1002/wdev.31. - DOI - PubMed

LinkOut - more resources