. 2019 Sep;20(3):2597-2608.
doi: 10.3892/mmr.2019.10522. Epub 2019 Jul 24.

Identification of core genes and pathways in type 2 diabetes mellitus by bioinformatics analysis

Affiliations

Identification of core genes and pathways in type 2 diabetes mellitus by bioinformatics analysis

Linchao Ding et al. Mol Med Rep. 2019 Sep.

Abstract

Type 2 diabetes mellitus (T2DM) is a metabolic disorder. Numerous proteins have been identified that are associated with the occurrence and development of T2DM. This study aimed to identify potential core genes and pathways involved in T2DM, through exhaustive bioinformatic analyses using GSE20966 microarray profiles of pancreatic β‑cells obtained from healthy controls and patients with T2DM. The original microarray data were downloaded from the Gene Expression Omnibus database. Data were processed by the limma package in R software and the differentially expressed genes (DEGs) were identified. Gene Ontology functional analysis and Kyoto Encyclopedia of Genes and Genomes pathway analysis were carried out to identify potential biological functions and pathways of the DEGs. Key transcription factors were identified using the WEB‑based GEne SeT AnaLysis Toolkit (WebGestalt) and Enrichr. The Search Tool for the Retrieval of Interacting Genes (STRING) database was used to establish a protein‑protein interaction (PPI) network for the DEGs. In total, 329 DEGs were involved in T2DM, with 208 upregulated genes enriched in pancreatic secretion and the complement and coagulation cascades, and 121 downregulated genes enriched in insulin secretion, carbohydrate digestion and absorption, and the Toll‑like receptor pathway. Furthermore, hepatocyte nuclear factor 1‑alpha (HNF1A), signal transducer and activator of transcription 3 (STAT3) and glucocorticoid receptor (GR) were key transcription factors in T2DM. Twenty important nodes were detected in the PPI network. Finally, two core genes, serpin family G member 1 (SERPING1) and alanyl aminopeptidase, membrane (ANPEP), were shown to be associated with the development of T2DM. On the whole, the findings of this study enhance our understanding of the potential molecular mechanisms of T2DM and provide potential targets for further research.


Figures

Figure 1.
Figure 1.
Standardization of gene expression. The blue bar represents the data before normalization, and the pink bar represents the normalized data.
Figure 2.
Figure 2.
Differential expression of data between two sets of samples. Red points represent upregulated genes screened on the basis |log2 fold change|≥1 and P-value <0.05. Green points represent downregulated genes screened on the basis |log2 fold change|≥1 and P-value<0.05. Black points represent genes with no significant difference. FC, fold change.
Figure 3.
Figure 3.
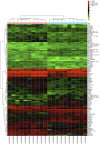
Heatmap of top 100 DEGs. Red represents the expression of genes is relatively up-regulated, green represents the expression of genes is relatively down-regulated, and black represents the expression of genes is no significant. DEGs, differential expression genes. T2DM, type 2 diabetes mellitus.
Figure 4.
Figure 4.
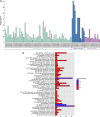
GO function analysis of DEGs in T2DM. (A) GO function analysis divide DEGs into molecular function, biological process and cell composition. (B) The significant GO enrichment items of DEGs in different functional groups. GO, gene Ontology. DEGs, differential expression genes. T2DM, type 2 diabetes mellitus.
Figure 5.
Figure 5.
Network of significant transcription factors with DEGs. Blue represents transcription factors, red represents upregulated DEGs, and green represents downregulated DEGs. DEGs, differential expression genes.
Figure 6.
Figure 6.
PPI network of DEGs. Circular nodes represent DEGs. Increasing degree is indicated by larger nodes, labels and darker color. Red represents that the nodes degree ≥20, yellow represents that the nodes degree ≥10 and <20, green represents that the nodes degree ≥2 and <10, and grey represents that nodes degree=1. PPI, protein-protein interaction. DEGs, differential expression genes.
Figure 7.
Figure 7.
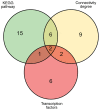
Venn diagram of core genes. Green circular represents DEGs screened on KEGG enrichment pathway analysis, yellow circular represents DEGs screened on connectivity degree≥5, and red circular represents DEGs screened on key transcription factors. DEGs, differential expression genes. KEGG, Kyoto encyclopedia of genes and genomes.
Figure 8.
Figure 8.
High glucose upregulated the expression of ANPEP and SERPING1. (A) The relative expression of ANPEP. (B) The relative expression of SERPING1. *P<0.05 and **P<0.01. ANPEP, alanyl aminopeptidase, membrane; SERPING1, serpin family G member 1.

References

    1. Ogurtsova K, da Rocha Fernandes JD, Huang Y, Linnenkamp U, Guariguata L, Cho NH, Cavan D, Shaw JE, Makaroff LE. IDF diabetes atlas: Global estimates for the prevalence of diabetes for 2015 and 2040. Diabetes Res Clin Pract. 2017;128:40–50. doi: 10.1016/j.diabres.2017.03.024. - DOI - PubMed
    1. Zhao Q, Zhang A, Zong W, An N, Zhang H, Luan Y, Sun H, Wang X, Cao H. Exploring potential biomarkers and determining the metabolic mechanism of type 2 diabetes mellitus using liquid chromatography coupled to high-resolution mass spectrometry. RSC Adv. 2017;7:44186. doi: 10.1039/C7RA05722A. - DOI
    1. Leibowitz G, Kaiser N, Cerasi E. Balancing needs and means: The dilemma of the beta-cell in the modern world. Diabetes Obes Metab. 2009;11(Suppl 4):S1–S9. doi: 10.1111/j.1463-1326.2009.01101.x. - DOI - PubMed
    1. Hoshino A, Ariyoshi M, Okawa Y, Kaimoto S, Uchihashi M, Fukai K, Iwai-Kanai E, Ikeda K, Ueyama T, Ogata T, Matoba S. Inhibition of p53 preserves Parkin-mediated mitophagy and pancreatic β-cell function in diabetes. Proc Natl Acad Sci USA. 2014;111:3116–3121. doi: 10.1073/pnas.1318951111. - DOI - PMC - PubMed
    1. Chaurasia B, Summers SA. Ceramides-lipotoxic inducers of metabolic disorders. Trends Endocrinol Metab. 2015;26:538–550. doi: 10.1016/j.tem.2015.07.006. - DOI - PubMed