. 2019 Sep 16:8:e49002.
doi: 10.7554/eLife.49002.

Dynamic turnover of centromeres drives karyotype evolution in Drosophila

Affiliations

Dynamic turnover of centromeres drives karyotype evolution in Drosophila

Ryan Bracewell et al. Elife. .

Abstract

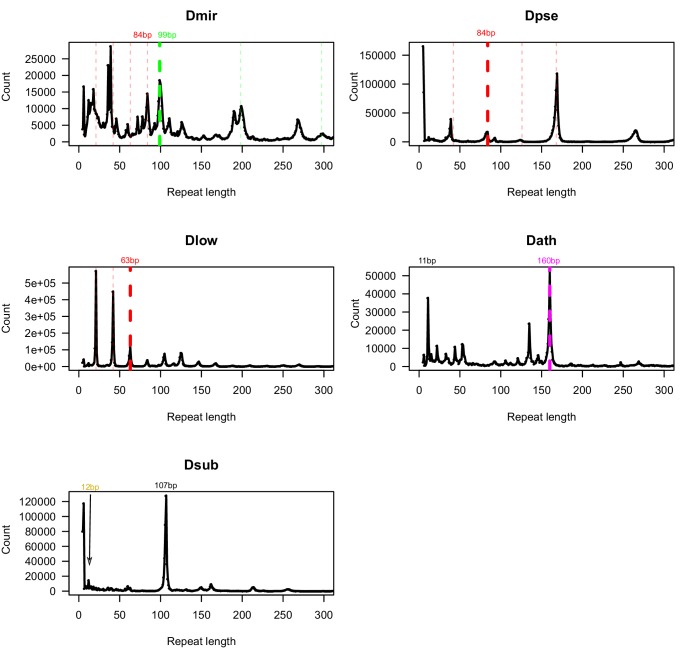
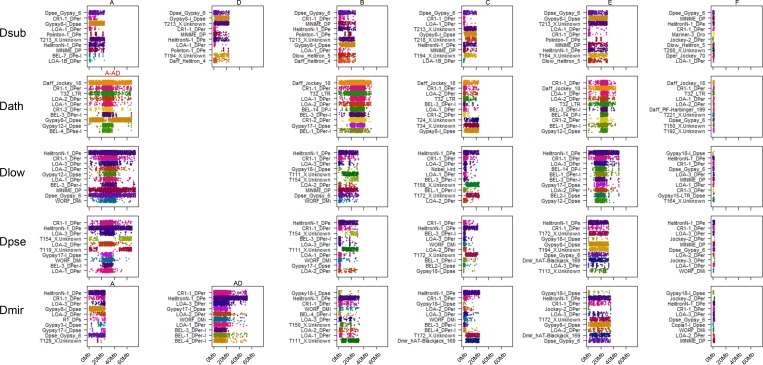
Centromeres are the basic unit for chromosome inheritance, but their evolutionary dynamics is poorly understood. We generate high-quality reference genomes for multiple Drosophila obscura group species to reconstruct karyotype evolution. All chromosomes in this lineage were ancestrally telocentric and the creation of metacentric chromosomes in some species was driven by de novo seeding of new centromeres at ancestrally gene-rich regions, independently of chromosomal rearrangements. The emergence of centromeres resulted in a drastic size increase due to repeat accumulation, and dozens of genes previously located in euchromatin are now embedded in pericentromeric heterochromatin. Metacentric chromosomes secondarily became telocentric in the pseudoobscura subgroup through centromere repositioning and a pericentric inversion. The former (peri)centric sequences left behind shrunk dramatically in size after their inactivation, yet contain remnants of their evolutionary past, including increased repeat-content and heterochromatic environment. Centromere movements are accompanied by rapid turnover of the major satellite DNA detected in (peri)centromeric regions.

Keywords: Drosophila obscura; centromere repositioning; chromosomes; evolutionary biology; gene expression; karyotype evolution.


Conflict of interest statement

RB, KC, MN, DB No competing interests declared

Figures

Figure 1.
Figure 1.. Phylogenetic relationships and karyotype evolution in the D. obscura group.
Drosophila subobscura represents the ancestral karyotype condition consisting of five large and one small pair of telocentric chromosomes (termed Muller elements A-F). Phylogeny adapted from Gao et al. (2007). Chromosomal fusions and movement of centromeres along the chromosomes has resulted in different karyotypes in different species groups (Segarra et al., 1995; Schaeffer et al., 2008). Indicated along the tree are transitions of chromosome morphology, and the different subgroups of the obscura species group are indicated by gray shading (the subobscura, obscura, pseudoobscura, and affinis subgroup). Muller elements are color coded, and centromeres are shown as black ovals.
Figure 2.
Figure 2.. Genome organization in Drosophila obscura group flies.
Shown here are the assembled chromosome sizes, scaffolding stitch points, gene density, repeat content (percentage of bases repeat-masked in 100 kb windows) and H3K9me3 enrichment (50 kb windows) across the genome assemblies of D. subobscura, D. athabasca, D. lowei, D. pseudoobscura and D. miranda. Muller elements are color coded, gene density is shown as a black to green heatmap (genes per 100 kb), H3K9me3 enrichment is shown in orange, and repeat density is shown in teal (note that H3K9me3 enrichment and repeat density are plotted semi-transparent). Scaffolding stich points are indicated as vertical lines.
Figure 2—figure supplement 1.
Figure 2—figure supplement 1.. Illumina coverage over assembled chromosomes in reference genome assemblies of D. subobscura, D pseudoobscura, D. lowei and D. athabasca.
Male (blue) and female (red) Illumina coverage (log2) shown in 5 kb non-overlapping windows along each chromosome. Scaffolding stitch point locations shown in the outermost track. Note that stitch points often coincide with aberrant patterns in Illumina coverage highlighting difficult regions to assemble.
Figure 2—figure supplement 2.
Figure 2—figure supplement 2.. Nanopore or PacBio coverage over reference genome assemblies of D. subobscura, D pseudoobscura, D. lowei and D. athabasca.
Coverage (log2) shown in 50 kb non-overlapping windows along the genome assembly with different genomic partitions highlighted. Contigs < 50 kb not shown. Note, D. lowei data was derived from males, D. subobscura and D. athabasca was derived from females, and D. pseudoobscura was derived from a combination of males and females. Therefore, coverage over A-AD is expected to be lower in D. lowei and D. pseudoobscura relative to the autosomes (Mullers B, C, E, F). Further, in D. pseudoobscura, A-AD and Y coverage is not expected to be similar due to differences in the female/male contribution to the total read pool.
Figure 2—figure supplement 3.
Figure 2—figure supplement 3.. Hi-C association heatmaps of genome assemblies for D. subobscura, D pseudoobscura, D. lowei and D. athabasca.
Lines demarcate assembled chromosomes and unplaced or Y contigs. Note that pericentromeric regions typically show weak Hi-C associations with neighboring euchromatic regions due to their repetitiveness, thus producing ‘checkerboard’ patterns in the plot. Also of note, off-diagonal associations are apparent in many euchromatic arms in our hybrid D. athabasca assembly and thus identify chromosomal inversions (see Materials and methods).
Figure 3.
Figure 3.. Chromosome synteny and evolution.
(A) Conservation of Muller elements in the Drosophila genus. Orthologous single copy Drosophila melanogaster (Dmel) BUSCOs plotted on reference genome assemblies. Muller elements are color-coded based on D. melanogaster. (B) Comparisons of synteny between our genome assemblies. Muller elements are color-coded based on the D. subobscura genome. Each line represents a protein-coding gene. Ovals denote the location of the putative centromere (based on the location of centromere-associated satellite sequences, see Figure 4).
Figure 3—figure supplement 1.
Figure 3—figure supplement 1.. Whole genome alignments (MUMmer) of our Drosophila subobscura genome assembly (strain 14011–0131.10) with (A) D.subobscura strain ch-cu and (B) D. guanche.
We show the Muller element naming scheme on the X axis and the subobscura group chromosome naming scheme on the Y axis.
Figure 3—figure supplement 2.
Figure 3—figure supplement 2.. Whole genome alignments (MUMmer) of draft Drosophila bifasciata genome contigs with (A) both Muller A and D of D. subobscura and (B) highlighting the Muller A centromere seed regions.
Many small contigs in the D. bifasciata assembly map to the D. subobscura seed region which is indicative of a highly repetitive and more poorly assembled region (i.e., pericentromere) in D. bifasciata. (C) Alignments of D. bifasciata contigs with the fused Muller A-AD of D. pseudoobscura show sequence similarity over the large metacentric pericentromere of Muller A-AD.
Figure 4.
Figure 4.. Identification of centromere-associated satellite sequences.
(A) Histograms of most abundant satellites in assembled genomes. Repeat length refer to the size of the repeat unit. For each species apart from D. subobscura, a specific satellite (or higher-order variant of it as indicated by the same colors) is enriched. In D. miranda, a 99mer (in green) and four units of a unrelated 21mer (84 bp; in red) are the most abundant satellites, in D. pseudoobscura, four units of a similar 21mer (84 bp; in red) is most common, in D. lowei, three units of a similar 21mer (63 bp; in red) is most common, in D. athabasca, an unrelated 160mer (in pink) is the most common satellite, and in the D. guanche genome (Puerma et al., 2018), an unrelated 290mer (in black) is most common. No abundant satellite was identified in the assembled genome of D. subobscura. (B) Location of putative centromere-associated repeats (from panel A) in pericentromeric regions. In D. suboobscura a 12mer is highly enriched in raw sequencing reads. Shown is a 5 Mb fragment for each chromosome with the highest density of the satellite sequence (that is the putative centromere), and all unplaced scaffolds. (C) FISH hybridization confirms centromere location of identified satellites (same color coding as in A and B). Probes corresponding to the 21mer (Cy5; red) and 99mer (Cy3; green) were hybridized to both D. miranda and D. pseudoobscura; the 21mer showed a centromere location in both species, while the 99mer hybridized only to the centromeres of D. miranda. The 160mer (6FAM; red) localized to the centromeres of D. athabasca, and the 12mer (TYE665; red) to the centromeres of D. subobscura. Stronger hybridization signal supposedly correspond to higher repeat abundance at a particular genomic location.
Figure 4—figure supplement 1.
Figure 4—figure supplement 1.. Genomic distribution of inferred centromeric satellite sequences.
Figure 4—figure supplement 2.
Figure 4—figure supplement 2.. Short satellite DNAs in obscura group flies.
Shown is a heatmap of the results from k-Sseek analyses used to identify enriched satellite sequences. Only kmers >1 bp that constitute >10% of the total short satellite sequence in any one species are shown. White = not present, red = highly enriched.
Figure 4—figure supplement 3.
Figure 4—figure supplement 3.. Identification of centromere-associated satellite sequences from Nanopore and PacBio reads.
Shown are counts of satellite lengths identified directly from raw sequencing reads for each Drosophila species. Colored lines are drawn as in Figure 4 to highlight overlap between the results from TRF analyses and TideHunter analyses.
Figure 4—figure supplement 4.
Figure 4—figure supplement 4.. Additional fluorescent in situ hybridization images.
(A) To help visualize enrichment on all chromosomes in species with variable intensities, (A) shows only the color channel that identifies the 160mer and 12mer in D. athabasca and D. subobscura, respectively. Arrows show low intensity signal on Muller C in D. athabasca and an unknown Muller element in D. subobscura. (B) Shows replicates for each species and satellite placement during cell division.
Figure 4—figure supplement 5.
Figure 4—figure supplement 5.. Nanopore and Illumina sequencing coverage over unplaced contigs (Contig_6 and Contig_7) harboring arrays of putative D. subobscura centromeric-associated satellite sequence.
Figure 5.
Figure 5.. Emergence and loss of centromeres.
(A) Shown are homologous genes between D. subobscura (telocentric), D. athabasca (metacentric) and D. pseudoobscura (metacentric and telocentric) with H3K9me3 enrichment plotted along Muller A (red), B (green) and E (purple) in 50 kb windows. Genes identified in the pericentromere of metacentric chromosomes are shown with black lines. Genes identified in pericentromeres of metacentric chromosomes can be traced to two ‘seed regions’ each on the telocentric chromosome of D. suboboscura, and to paleocentromere regions in species that secondarily lost the metacentric centromere. (B) GC-content across D. subobscura Muller A, B and E. Seed regions have significantly lower GC-content compared to genomic background (Supplementary file 7).
Figure 5—figure supplement 1.
Figure 5—figure supplement 1.. Alignments of Muller A between D. subobscura (telocentric) with D. athabasca (metacentric) and H3K9me3 enrichment plotted in 50 kb windows above each chromosome.
Pericentromeric genes in D. pseudoobscura shown in black.
Figure 5—figure supplement 2.
Figure 5—figure supplement 2.. GC-content, the percentage of bases repeat-masked, and number of genes, in 10 kb non-overlapping windows across Muller A, B and E.
Seed regions are shown bounded by dashed lines. Note the orientation for the Muller elements are shown as in Figure 5B.
Figure 5—figure supplement 3.
Figure 5—figure supplement 3.. GC-content of different functional categories in seed and non-seed regions of Muller A, B and E of D. subobscura.
Figure 6.
Figure 6.. Karyotype and centromere evolution.
(A) Models for transitions between metacentric and telocentric chromosomes, either invoking pericentric inversions (top), or centromere repositioning (bottom) via the birth of a new centromere (lightning bolt) and death of the old centromere (skull and crossbones). The pericentromere is indicated by darker shading, the centromere as a white rectangle. (B) The syntenic location of genes adjacent to the centromere can allow us to distinguish between a simple inversion model vs. centromere relocation. The genes closest to the centromere of the telocentric chromosome (30 genes in panel C) are shown by different shading. (C) Dot plots for homologous genes (semi-transparent points) between telocentric and metacentric Muller elements (orange: Muller A-AD; purple: Muller E; green: Muller B). In 4 out of 5 cases, pericentric genes in the telocentric species are found in the non-pericentric regions of the metacentric species. Only Muller B between D. athabasca and pseudoobscura group flies (D. lowei is pictured) shows that the same genes are pericentric in both species (and thus support a simple inversion model).
Figure 7.
Figure 7.. Functional consequences of becoming pericentromeric.
(A) Metagene plots showing H3K9me3 enrichment for genes located in different parts of the genome in D. subobscura (top) and D. athabasca (bottom). (B) Patterns of gene expression for homologous genes in D. subobscura and D. athabasca, classified as whether they are part of the ‘seed’ region in D. subobscura that become part of the pericentromeric heterochromatin in D. athabasca or not. Expression patterns were not found to significantly differ between D. subobscura non-pericentromeric genes and seed genes, while seed orthologs located in the pericentromere of D. athabasca showed significantly higher expression than non-pericentromeric genes (Mann-Whitney U, p<0.0001).
Figure 8.
Figure 8.. Transposable element evolution across the genome.
Shown is the fraction of bases masked in 100 kb genomic windows for different transposable element families with the total TE fraction plotted above each chromosome.
Figure 8—figure supplement 1.
Figure 8—figure supplement 1.. Genomic distribution of transposable elements by species and Muller element.
The top 10 TE’s per Muller element, per species, are shown in descending order from top to bottom and ranked by their total contribution (bp) to each element. Each point represents a genomic location masked for an element.
Figure 8—figure supplement 2.
Figure 8—figure supplement 2.. De-novo estimates (dnaPipeTE) of transposable element frequencies in D. subobscura, D. athabasca, D. lowei and D. pseudoobscura.
Appendix 1—figure 1.
Appendix 1—figure 1.. Bandage plot of a typical Drosophila genome assembly.
The left panel is a visualization of the genome graph (.gfa file) from a canu assembly with the node name for each contig and Illumina coverage displayed in text overtop each contig. Each contig in the assembly is shaded by the amount of male Illumina whole genome sequencing coverage (see Materials and methods). In this example, red contigs are likely autosomal (~40×) while darker contigs have less coverage and indicate either putative sex chromosome contigs (~20×) or putative contaminant contigs (<<20×). (B) Shown is a zoomed in image of 2 nodes (535 and 511) in the assembly with exceptionally low male (top) and female (bottom) Illumina coverage (<0.1×). By also visualizing the top BLAST hits for these contigs (not shown), we were able to identify these contigs as belonging to an Acetobacter species and were thus contaminants marked for removal from the assembly. Contigs with exceptionally high Illumina coverage were also scrutinized thoroughly but these can arise for multiple reasons, including mtDNA contigs, collapsed regions of the target genome (e.g., rDNA genes or centromeric satellite sequence), or non-target contaminant contigs.
Appendix 1—figure 2.
Appendix 1—figure 2.. BAC clone sequencing confirms centromere and pealeocentromere assembly.
Several independent BAC clones map to the assembly of our paleocentromeres in D. miranda.
Appendix 1—figure 3.
Appendix 1—figure 3.. Drosophila athabasca EB metacentric chromosome Hi-C associations and scaffolding.
Our EB assembly (Appendix 1—table 2) was superior to our EA assembly (Appendix 1—table 3) and long contigs from our EB assembly extended at least a megabase into the pericentromere for all metacentric chromosomes. Shown above are Hi-C association heatmaps from Juicebox (Durand et al., 2016a). Green boxes denote contigs. The pericentromeric region is highlighted in purple, and note the clear transition in Hi-C associations between euchromatic and heterochromatic regions. We used EA Hi-C data to scaffold the EB assembly. The EA and EB semispecies harbor inversions that differentiate the semispecies and we identified numerous inversions when mapping EA Hi-C to the EB genome assembly. Thus, the exceptionally long EB contigs that extend into the pericentromeric region allowed us to accurately scaffold chromosomes while simultaneously identifying inversions along the euchromatic arms.
Appendix 1—figure 4.
Appendix 1—figure 4.. Drosophila athabasca EA assembly Hi-C associations and scaffolding.
(A) Hi-C scaffolding of the EA assembly recovered long blocks of contigs we identified as Muller elements from our EB assembly. Blue boxes bound putative Muller element boundaries; green boxes denote contigs. Black arrows show contigs that span the euchromatic/heterochromatic transition and allow for confident scaffolding into pericentromeric regions. Blue arrows show regions where contigs failed to assemble across the transition making scaffolding based on Hi-C associations more challenging. (B) Shown is a zoomed in image of Muller C scaffolding. Here, a contig spans the euchromatic/heterochromatic transition on Muller C and we used this scaffolded in our Dath_EB_hybrid assembly. Note the lack of evidence for inversions in the Hi-C heatmaps since here we are using EA Hi-C with an EA assembly.
Appendix 1—figure 5.
Appendix 1—figure 5.. Whole genome alignment of our D. lowei assembly (Y axis) to the published Drosophila miranda genome.
Appendix 1—figure 6.
Appendix 1—figure 6.. Whole genome alignment of our assembly (Y axis) to the published Drosophila pseudoobscura genome assembly (version 3.04).
Scaffolds in the published assembly that are near chromosome length (i.e., Muller E and Muller C) largely agree with our scaffolds. However, our assembly extends the assembled length of these chromosomes with far less scaffolding. For Muller B and Muller A-AD, our scaffolded chromosomes show large stretches of collinearity with the fragmented published assembly, with the exception of a few inverted regions. Our Hi-C data and association heatmap (see RESULTS) argue that our assembly orientation is likely the correct one and provide orientation to the five large scaffolds of Muller B and 8 scaffolds of Muller A-AD in the reference genome. The paleocentromeric region on Muller E is assembled in the current reference genome, but our assembly contains additional sequence not present in the published assembly (not shown).

References

    1. Allshire RC, Karpen GH. Epigenetic regulation of centromeric chromatin: old dogs, new tricks? Nature Reviews Genetics. 2008;9:923–937. doi: 10.1038/nrg2466. - DOI - PMC - PubMed
    1. Amor DJ, Bentley K, Ryan J, Perry J, Wong L, Slater H, Choo KHA. Human centromere repositioning "in progress". PNAS. 2004;101:6542–6547. doi: 10.1073/pnas.0308637101. - DOI - PMC - PubMed
    1. Amor DJ, Choo KHA. Neocentromeres: role in human disease, evolution, and centromere study. The American Journal of Human Genetics. 2002;71:695–714. doi: 10.1086/342730. - DOI - PMC - PubMed
    1. Ashburner M. Drosophila: A Laboratory Handbook. Cold Spring Harbor Laboratory Press: Cold Spring Harbor; 1989.
    1. Bachmann L, Raab M, Sperlich D. Satellite DNA and speciation: a species specific satellite DNA of Drosophila guanchel. Journal of Zoological Systematics and Evolutionary Research. 2009;27:84–93. doi: 10.1111/j.1439-0469.1989.tb00333.x. - DOI

Publication types

LinkOut - more resources