. 2019 Oct 1;129(10):4433-4450.
doi: 10.1172/JCI125669.

IL-1β dominates the promucin secretory cytokine profile in cystic fibrosis

Affiliations

IL-1β dominates the promucin secretory cytokine profile in cystic fibrosis

Gang Chen et al. J Clin Invest. .

Abstract

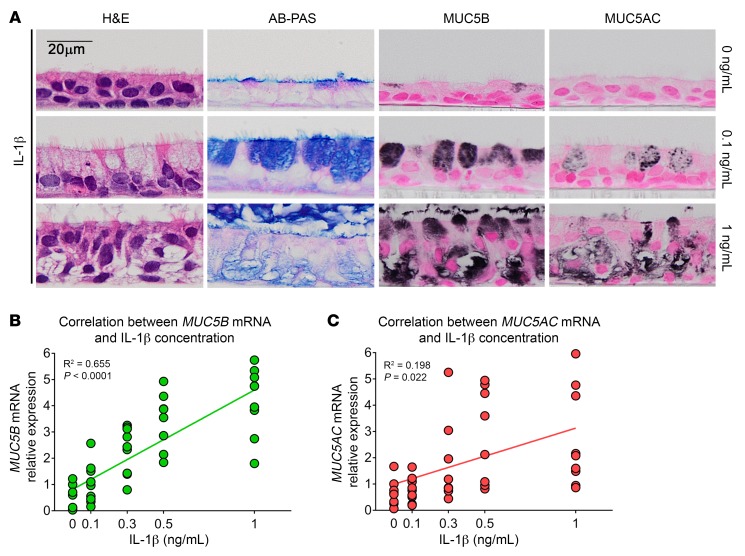
Cystic fibrosis (CF) lung disease is characterized by early and persistent mucus accumulation and neutrophilic inflammation in the distal airways. Identification of the factors in CF mucopurulent secretions that perpetuate CF mucoinflammation may provide strategies for novel CF pharmacotherapies. We show that IL-1β, with IL-1α, dominated the mucin prosecretory activities of supernatants of airway mucopurulent secretions (SAMS). Like SAMS, IL-1β alone induced MUC5B and MUC5AC protein secretion and mucus hyperconcentration in CF human bronchial epithelial (HBE) cells. Mechanistically, IL-1β induced the sterile α motif-pointed domain containing ETS transcription factor (SPDEF) and downstream endoplasmic reticulum to nucleus signaling 2 (ERN2) to upregulate mucin gene expression. Increased mRNA levels of IL1B, SPDEF, and ERN2 were associated with increased MUC5B and MUC5AC expression in the distal airways of excised CF lungs. Administration of an IL-1 receptor antagonist (IL-1Ra) blocked SAMS-induced expression of mucins and proinflammatory mediators in CF HBE cells. In conclusion, IL-1α and IL-1β are upstream components of a signaling pathway, including IL-1R1 and downstream SPDEF and ERN2, that generate a positive feedback cycle capable of producing persistent mucus hyperconcentration and IL-1α and/or IL-1β-mediated neutrophilic inflammation in the absence of infection in CF airways. Targeting this pathway therapeutically may ameliorate mucus obstruction and inflammation-induced structural damage in young CF children.

Keywords: Cytokines; Pulmonology.


Conflict of interest statement

Conflict of interest: The authors have declared that no conflict of interest exists.

Figures

Figure 1
Figure 1. Mucin secretagogue activity of SAMS is mediated by IL-1α and/or IL-1β via IL-1R1.
(A) Expression of MUC5B and MUC5AC mRNAs in non-CF HBE cells as determined by TaqMan assays after exposure to control (PBS), IL-1α, IL-1β, IL-13, or SAMS of CF lung for 5 days. IL-1α, IL-1β, and IL-13 were administered at 10 ng/ml in ALI media from basolateral side of the cells. Undiluted SAMS (50 μl) was administered to the apical surface of HBE cells, where it was maintained until the cells were utilized for assays. Scatter plots present mean ± SEM, with 1 culture of HBE cells obtained from 14 non-CF donors for each treatment condition. Data were analyzed with 1-way ANOVA followed by Dunnett’s test. (B) IL-1α and IL-1β protein concentration in SAMS was determined by ELISA. SAMS was collected from 8 CF lungs. Scatter plot presents mean ± SEM. (C) Non-CF HBE cells were infected with lentiviruses expressing EGFP (control) or IL-1R1 CRISPR guide RNA and Cas9 protein. After ALI was cultured for 4 weeks, CRISPR/Cas9 targeted cells were treated with vehicle control (PBS) or SAMS for 3 days. MUC5B, MUC5AC, SPDEF, and IL8 mRNAs in HBE cells were quantitatively measured by TaqMan assays. Scatter plots present mean ± SD. Data were derived from HBE cells from n = 6 non-CF donors analyzed with 2-tailed paired t test. *P < 0.05; **P < 0.01; ***P < 0.001. (D) Histological changes of HBE cells after cytokine treatment are shown by H&E staining. Goblet cell differentiation and mucus production are shown by AB-PAS staining. Expression of MUC5B and MUC5AC protein is demonstrated by immunohistochemical staining. Micrographs present non-CF HBE cells of 3 donors. Ψ, mucus layer; *, epithelial cell layer. Scale bar: 20 μm.
Figure 2
Figure 2. IL-1β induces goblet cell differentiation and MUC5B expression in a concentration-dependent manner.
Non-CF HBE cells were treated with IL-1β at a gradient of concentrations of 0.1, 0.3, 0.5, and 1 ng/ml from the basolateral side for 5 days. (A) Histological changes are shown by H&E staining and goblet cell differentiation by AB-PAS staining for treatment groups of 0, 0.1, and 1 ng/ml of IL-1β. Expression of MUC5AC/MUC5B protein was identified by immunohistochemical staining. Micrographs are representative of HBE cells from n = 3 donors in each treatment group. Scale bar: 20 μm. (B and C) Linear regression plots show correlations between mRNA expression of MUC5B or MUC5AC and IL-1β concentration (non-CF HBE cells; n = 9 donors).
Figure 3
Figure 3. Chronic IL-1β exposure induces MUC5B-dominated mucin production.
Non-CF HBE cells were exposed to vehicle control (PBS), IL-1β, or IL-13 (10 ng/ml, from basolateral side in media) for 5 weeks without washing off the apical secretions. (A) Morphology of mucus layers, epithelial cell layers, and goblet cell differentiation are shown by H&E and AB-PAS staining. Ψ, mucus layer; *, epithelial cell layer. (B) Expression of MUC5B and MUC5AC in HBE cells after chronic IL-1β and IL-13 exposure was determined by dual-immunofluorescent staining. (C) High-power view of mucus layers, epithelial cell layers, and goblet cell differentiation showed in A. All micrographs are representatives of HBE cells from n = 3 donors in each treatment group. (D) Apical secretions of HBE cells after 5-week chronic exposure were subjected to trypsin digestion and analyzed with liquid chromatography–tandem mass spectrometry. MUC5B and MUC5AC proteins were identified and their quantities shown by total precursor intensities. HBE cells tested in control, IL-1β, and IL-13 exposure were collected from n = 8, 4, and 8 non-CF donor lungs, respectively. Scatter plots present mean ± SD. (E) mRNA expression of MUC5B and MUC5AC was measured by TaqMan assays in the HBE cells exposed to control (PBS), IL-1β, and IL-13 for 5 weeks. Data are represented as mean ± SEM. Non-CF HBE cells from n = 8 donor lungs were tested in each treatment group. Data were analyzed with 1-way ANOVA followed by Tukey’s test (D and E). *P < 0.05; **P < 0.01; ***P < 0.001, compared with control groups. Scale bars: 100 μm (A and B); 20 μm (C).
Figure 4
Figure 4. IL-1β, but not IL-13, increases mucus percentage of solids in the apical secretions of CF HBE cells.
Fully differentiated non-CF and CF HBE cells were exposed to control (PBS), IL-1β, or IL-13 (10 ng/ml from basolateral side in media) for 1 week. (A) Apical secretions from non-CF and CF HBE cells were collected by washing the apical surface of HBE cells with PBS containing 10 mM DL-dithiothreitol (DTT) to remove mucus. Secreted MUC5B and MUC5AC proteins were identified by mucin agarose gel Western blot. HBE cells from n = 5 non-CF donors and n = 5 CF donors were used for each treatment condition. (B) MUC5B and MUC5AC protein content shown in A was semiquantified with Licor Odyssey software. Scatter plots represent mean ± SD. Data were analyzed with 1-way ANOVA followed by Dunnett’s test. (C) The percentage of mucus solids content, an index of hydration of apical secretions, was measured from HBE cells after 1 week of treatment with control, IL-1β (cells from n = 9 non-CF and n = 9 CF donors), or IL-13 (cells from n = 5 non-CF and n = 5 CF donors). Data were analyzed with 1-way ANOVA followed by Dunnett’s test.
Figure 5
Figure 5. SAMS, IL-1α, IL-1β, and IL-13 induce goblet cell differentiation and mucus production in vivo.
(A) WT adult (6 weeks) female C57BL/6J mice were exposed to sterile saline and murine recombinant IL-1α, IL-1β, IL-13, or SAMS via intratracheal instillation. Goblet cell differentiation and Muc5b and Muc5ac protein/mRNA expression in conducting airway epithelia were identified by AB-PAS and immunohistochemical staining and RNAscope (Muc5ac/Muc5b) duplex assays. Inserts show high-power view of airway epithelia. Micrographs are representatives of lung histology of n = 3 mice/treatment group. Micrographs of AB-PAS, Muc5ac, and Muc5b immunohistochemical staining were taken at the same magnification. Scale bars: 200 μm (top three rows); 20 μm (bottom row). Original magnification, ×40 (insets). (B) Secreted Muc5b and Muc5ac proteins in BAL were examined by mucin agarose gel Western blot (n = 4 mice/treatment group). (C) mRNA expression of Muc5b and Muc5ac in the whole lung was quantitatively measured by TaqMan assays after saline, IL-1α, IL-1β, and IL-13 (n = 5 mice/treatment group). (D) Muc5b and Muc5ac mRNAs in the whole lung were quantitatively measured in mice exposed to saline and SAMS (n = 6 mice/group). Scatter plots present data as mean ± SD; data were analyzed with 1-way ANOVA followed by Dunnett’s test (C) and 2-tailed, unpaired t test (D). *P < 0.05; **P < 0.01; ***P < 0.001, compared with saline groups.
Figure 6
Figure 6. Loss of IL-1R1 inhibits IL-1β–induced mucin and SPDEF gene expression.
(A) WT (Il1r1+/+) and Il1r1-deficient (Il1r1–/–) mice were exposed to sterile saline or murine recombinant IL-1β cytokine via intratracheal instillation, and mRNA expression of Muc5b, Muc5ac, and Spdef in the whole lung was quantitatively determined by TaqMan assays. n = 3–5 mice/treatment/genotype. (B) mTECs isolated from WT and Il1r1–/– mice were cultured under air-liquid interface conditions for 3 weeks to allow full differentiation prior to exposure with vehicle control (PBS) or murine recombinant cytokines IL-1α, IL-1β, and IL-13 for 1 week from basolateral media (all at 10 ng/ml). mRNA expression of Muc5b, Muc5ac, and Spdef was quantitatively measured by TaqMan assays with n = 3 independent mTEC cultures/treatment/genotype. Scatter plots in A and B present data as mean ± SD, and data were analyzed with 2-tailed unpaired t test. (C) Non-CF HBE cells were infected with lentiviruses expressing EGFP (control CRISPR) and IL-1R1-CRISPR guide RNAs and Cas9 protein. After culturing at air-liquid interface for 4 weeks, CRISPR/Cas9 targeted cells were treated with vehicle control (PBS) or IL-1β for 3 days. MUC5B, MUC5AC, and SPDEF mRNAs in HBE cells were quantitatively measured by TaqMan assays. Scatter plots present data as mean ± SD, and data were analyzed with 2-tailed paired t test with HBE cells from n = 3 donor lungs. *P < 0.05; **P < 0.01; ***P < 0.001, compared with Il1r1+/+ groups (A and B) or EGFP CRISPR groups (C).
Figure 7
Figure 7. Spdef is required for IL-1β–induced goblet cell differentiation and mucin production in vivo.
WT (Spdef+/+) and Spdef-deficient (Spdef–/–) 6-week-old mice were exposed to sterile saline or murine recombinant IL-1β cytokine via intratracheal instillation. Goblet cell differentiation was examined by AB-PAS staining (A), and Muc5ac and Muc5b protein/mRNA expression in the conducting airway epithelia was assessed by immunohistochemical staining (B and C) and RNAscope duplex assays (D). (E) Spdef mRNA expression in the conducting airway epithelia was identified by RNAscope red assays. (AE) Micrographs are representative of n = 3 mice/treatment/genotype. Scale bars: 100 μm (AD); 20 μm (E). (F) mRNA expression of Muc5ac, Muc5b, Foxa3, and Agr2 from the whole lung was quantitatively measured by TaqMan assays. In the Spdef+/+ mouse group, n = 5 and n = 6 mice were treated with saline and IL-1β, respectively. In the Spdef–/– mouse group, n = 5 and n = 7 mice were treated with saline and IL-1β, respectively. Scatter plots present data as mean ± SD, and data were analyzed with 2-tailed unpaired t test. *P < 0.05; **P < 0.01; ***P < 0.001, compared with saline groups.
Figure 8
Figure 8. SPDEF regulates ERN2 and mucin production in vivo and in vitro.
(A) WT (Spdef+/+) and Spdef-deficient (Spdef–/–) 6-week-old mice were exposed to sterile saline or murine recombinant IL-1β via intratracheal instillation. Ern2 mRNA in conducting airways was detected by RNAscope assay. Micrographs are representative of n = 3 mice/treatment/genotype. Arrows point to regions shown in inserts. (B) Ern2 and Ern1 mRNAs in whole lung were quantitatively measured by TaqMan assays. The scatter plots present data as mean ± SD; data were analyzed with 2-tailed unpaired t test. For Spdef+/+ mice, n = 5 and n = 6 mice were administered saline and IL-1β, respectively. For Spdef–/– mice, n = 5 and n = 7 mice were administered saline and IL-1β, respectively. (C) Non-CF HBE cells were infected with lentiviruses expressing GFP (control) or FLAG-Spdef fusion protein and cultured under ALI conditions for 1 week. Goblet cell differentiation and MUC5B/MUC5AC protein expression were revealed by AB-PAS and dual-immunofluorescent staining, respectively. (D) MUC5B and MUC5AC mRNA levels were quantitatively measured in GFP vs FLAG-Spdef–transduced cultures by TaqMan assays. ERN1/ERN2 mRNA expression was identified by RNAscope duplex assay and quantitatively determined by TaqMan assay (C and E). Data were analyzed with 2-way ANOVA followed by Šidák’s correction. Non-CF HBE cells from n = 5 donors (n = 3 independent cultures/donor) were used for lentiviruses infection, and the same donor cells infected with GFP or FLAG-Spdef viruses were labeled with color-matching dots. (F) Immortalized HBE cells (UNCN3T) were transfected with negative control or SPDEF-specific siRNA, and SPDEF, ERN1, ERN2, MUC5B, and MUC5AC mRNAs were quantitatively measured after 48 hours. Scatter plots present data as mean ± SD with n = 4 independent cell cultures, and data were analyzed by 2-tailed, unpaired t test. *P < 0.05; **P < 0.01; ***P < 0.001, compared with saline (B), GFP (D and E), and control siRNA (F) groups. Scale bars: 50 μm (A); 20 μm (C). Original magnification, ×60 (insets).
Figure 9
Figure 9. Expression of IL1B, SPDEF, and ERN2 mRNAs is associated with MUC5B mRNA in proximal to terminal airway epithelia in CF.
Expression of MUC5AC, MUC5B, IL1B, IL1A, SPDEF, ERN1, and ERN2 mRNAs was detected by RNA in situ hybridization in non-CF (control) and CF lung subjects. The representative histological sections contain airways ranging from the proximal (bronchial) airways (the regions containing SMG; the airway luminal diameter is around 5 mm) to intermediate (2–4 mm) and distal (1–2 mm), and further to terminal regions (≤200 μm) in each panel. Detection of expression of these genes was performed on the matched sequential sections for each assay. MUC5AC/MUC5B (A) and IL1B/IL1A (B) mRNAs were detected by RNAscope duplex assays. (C) Detection of SPDEF mRNA expression by Basescope assays. (D) ERN1/ERN2 mRNA expression was detected by RNAscope duplex assays. In B, the inserts at bottom left corners show high-power view of the selected areas of airway tissue from both non-CF and CF subjects, and the inserts at the upper right corners show high-power views of the selected area containing the cells trapped in the luminal mucus plugs in CF lung tissue. In A, C, and D, inserts show high-power view of rectangle-selected areas on airway tissues. Micrographs are representative of RNAscope assays performed with n = 4 non-CF and n = 3 CF lungs. Scale bars: 200 μm. Original magnification, ×60 (insets).
Figure 10
Figure 10. Quantification of MUC5B/MUC5AC and IL1B/IL1A mRNA expression in the distal airways of control and CF lungs.
(A) Quantification of the MUC5B/MUC5AC mRNA signals in superficial epithelia lining of the distal airways (including all the airways with luminal diameter of 1.5 mm or less, regardless of staining status; shown in Figure 9) was determined by morphometric analysis of staining volume density. Quantification of the IL1B/IL1A mRNA signal content present in the luminal areas (B) and signal volume density in the epithelial layers (C) of the distal airways (same criteria as in A) was performed by morphometric analyses. Signal volume density in A and C was normalized to the unit surface area of the basement membrane (BM), while the luminal contents of IL1B/IL1A staining in B was normalized to the unit luminal volume (LV). Measurements of n = 4 control subjects and n = 3 CF subjects were performed. Individual subjects are distinguished by color-matched dots (AC). Each color dot represents measurement from 1 airway, and the numbers of the airways used in analyses from 1 subject were annotated as n = following the color dots in the figure annotations. Of note, the scatter dots/bar graphs represent cube root–transformed values. The differences of means between the 2 groups (denoted by P values) were analyzed by linear mixed-effects model with subject identification number as random intercept variable. (D) mRNA expression of SPDEF, ERN2, MUC5B, and MUC5AC was quantitatively measured by TaqMan assays (normalized to endogenous GAPDH mRNA) from the airway epithelial cells freshly isolated (passage 0) from nonsmoker, non-CF donors (control, n = 30 codes) and CF donors (n = 24 codes). One code means the cells obtained from 1 individual donor lung. Scatter plots present data as mean ± SEM, and data were analyzed with 2-tailed unpaired Mann-Whitney U test.
Figure 11
Figure 11. IL-1Ra inhibits SAMS-induced expression of mucin and proinflammatory genes in both non-CF and CF HBE cells.
Fully differentiated non-CF and CF HBE cells were pretreated with vehicle (PBS) or IL-1 receptor antagonist IL-1Ra (at 2 μg/ml from the apical side and 400 ng/ml from the basolateral side) for 24 hours prior to exposure to diluted SAMS (1:40 dilution of stock SAMS with sterile PBS to reach 1 ng/ml of IL-1β concentration) in SAMS+IL-1Ra administration was compared with control treatment (PBS and IL-1Ra) for 3 days. mRNA expression of MUC5B (A), MUC5AC (B), SPDEF (C), AGR2 (D), and ERN2 (E) and proinflammatory mediators IL8, IL6, and CXCL1 (FH) were quantitatively measured by TaqMan assays. Graphs present data as mean ± SD with n = 2 independent HBE cell cultures of non-CF (from n = 5 donor lungs) and CF (from n = 5 donor lungs). Data were analyzed using 2-way ANOVA followed by Tukey’s test. *P < 0.05; ***P < 0.001, compared with vehicle-treated groups.
Figure 12
Figure 12. Positive feedback cycle between IL-1 cytokines/inflammation and mucus hyperconcentration in the CF airways.
(A) CF babies are born with sterile lungs. At their basal state, the ASL hydration and mucus concentration may be relatively normal. (B) Insults, e.g., aspiration (bile acids), promote mucin secretion, and due to loss of CFTR function, which limits Cl/water secretion into the ASL, the mucus becomes dehydrated. Dehydrated mucus activates local luminal macrophages and produces hypoxia in epithelia. (C) Hypoxia-induced necrotic epithelia secrete IL-1α (upper right and bottom left). In response to hyperconcentrated mucus or epithelial-released IL-1α, the luminal resident macrophages and myeloid cells in mucosa are then activated to release IL-1β (upper left and bottom left, respectively). Secreted IL-1α and IL-1β activate IL-1R1 on apical or basolateral side of the epithelia to (a) induce SPDEF and ERN2-mediated mucin transcription and secretion and (b) increase expression of proinflammatory mediators, e.g., IL-8 and CXCL1. Prior to bacterial infection occurrence in CF infants/young children, the dehydrated secreted mucin exacerbates existing mucus hyperconcentration on CF airways that further activates the luminal macrophages leading to a “vicious” positive feedback cycle. Note, each step of this positive feedback cycle is denoted by a red cross. Secretion of proinflammatory mediators induces a parallel polymorphonuclear neutrophil–mediated inflammation, which persists in early CF lungs. Elastase secreted by neutrophils also activates mucin production by CF epithelia, which further contributes to mucus hyperconcentration and obstruction in the distal airways, another positive feedback cycle (not shown). pO2, partial pressure of oxygen.

Comment in

References

    1. Abman SH, Ogle JW, Butler-Simon N, Rumack CM, Accurso FJ. Role of respiratory syncytial virus in early hospitalizations for respiratory distress of young infants with cystic fibrosis. J Pediatr. 1988;113(5):826–830. doi: 10.1016/S0022-3476(88)80008-8. - DOI - PubMed
    1. Tarran R, et al. Normal and cystic fibrosis airway surface liquid homeostasis. The effects of phasic shear stress and viral infections. J Biol Chem. 2005;280(42):35751–35759. doi: 10.1074/jbc.M505832200. - DOI - PMC - PubMed
    1. Esther CR, et al. Mucus accumulation in the lungs precedes structural changes and infection in children with cystic fibrosis. Sci Transl Med. 2019;11(486):eaav3488. doi: 10.1126/scitranslmed.aav3488. - DOI - PMC - PubMed
    1. Montgomery ST, et al. Interleukin-1 is associated with inflammation and structural lung disease in young children with cystic fibrosis. J Cyst Fibros. 2018;17(6):715–722. doi: 10.1016/j.jcf.2018.05.006. - DOI - PubMed
    1. Boucher RC. New concepts of the pathogenesis of cystic fibrosis lung disease. Eur Respir J. 2004;23(1):146–158. doi: 10.1183/09031936.03.00057003. - DOI - PubMed

Publication types

MeSH terms