. 2019 Oct 1;129(10):4464-4476.
doi: 10.1172/JCI127046.

Immune overdrive signature in colorectal tumor subset predicts poor clinical outcome

Affiliations

Immune overdrive signature in colorectal tumor subset predicts poor clinical outcome

Marwan Fakih et al. J Clin Invest. .

Abstract

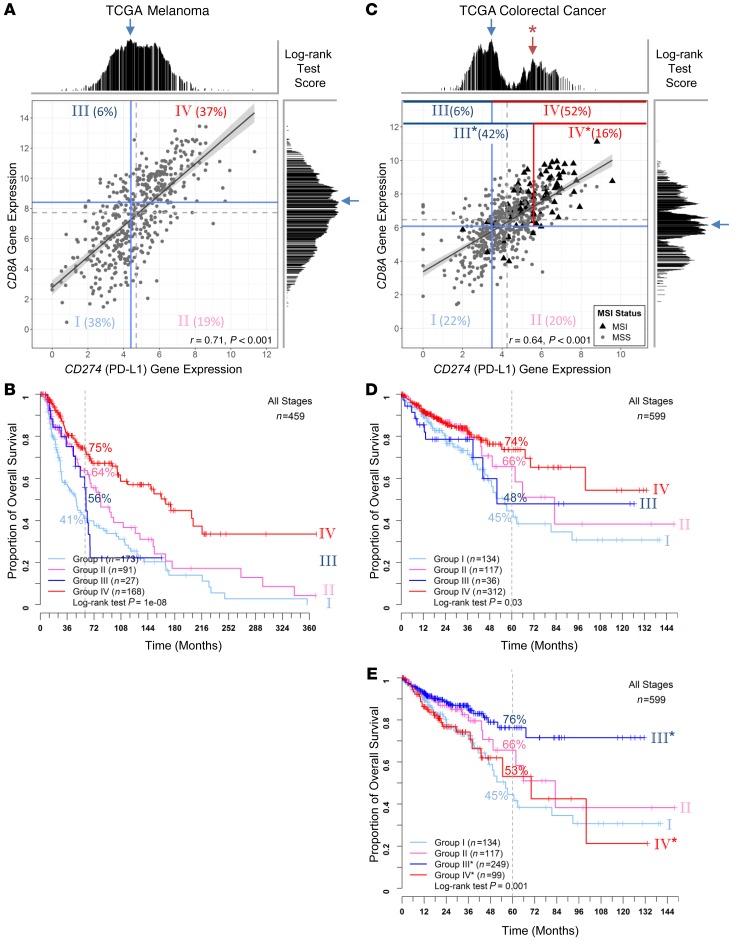
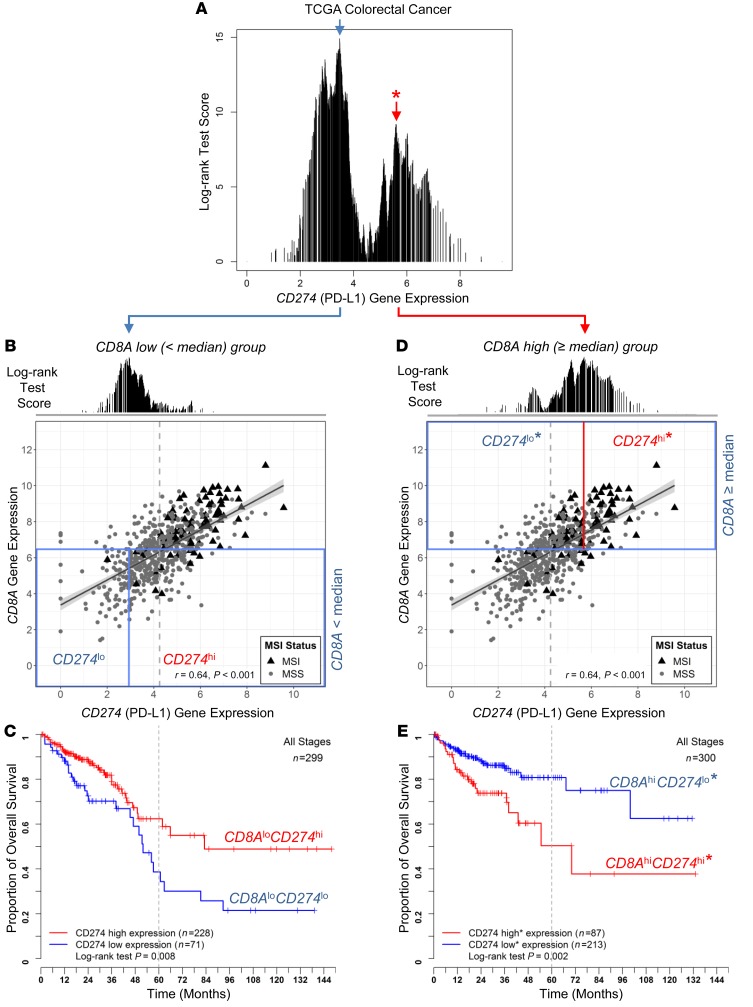
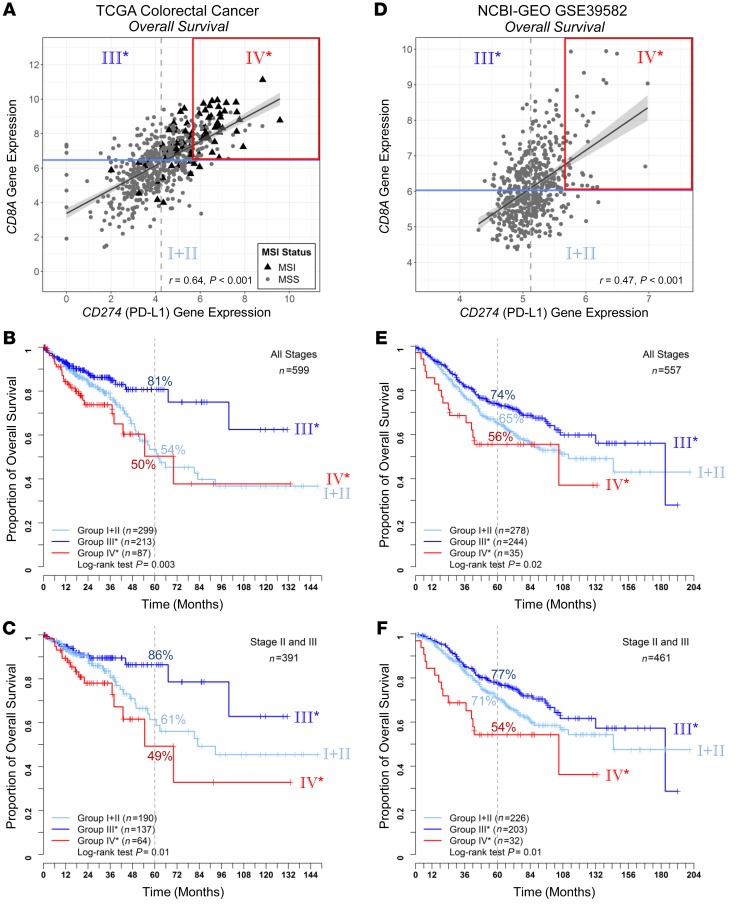
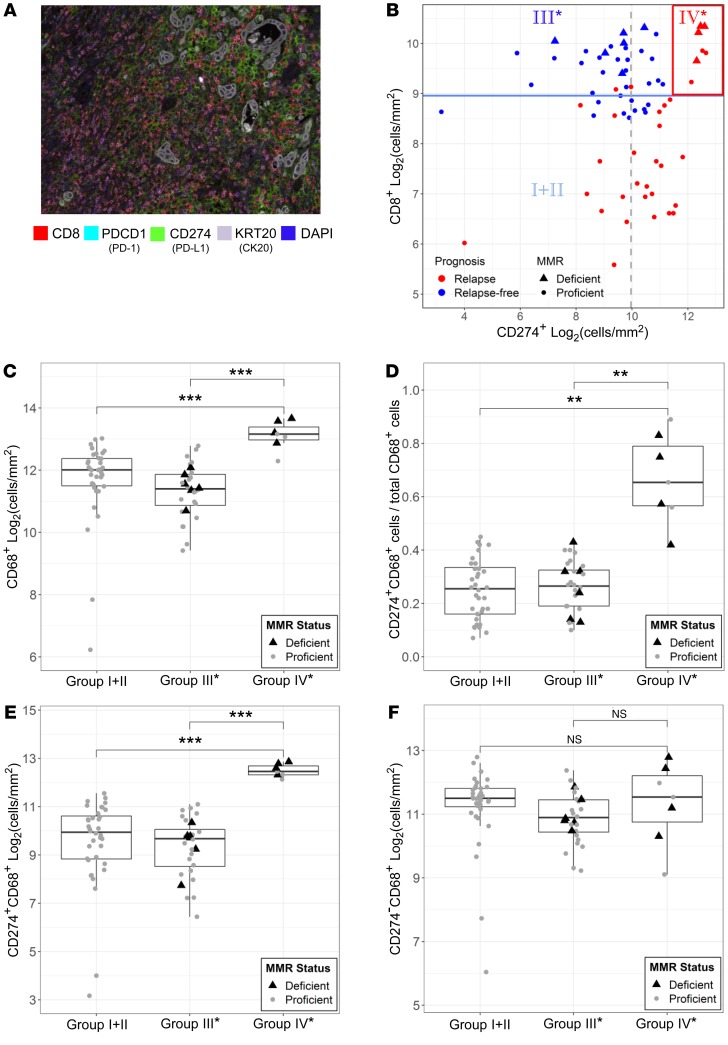
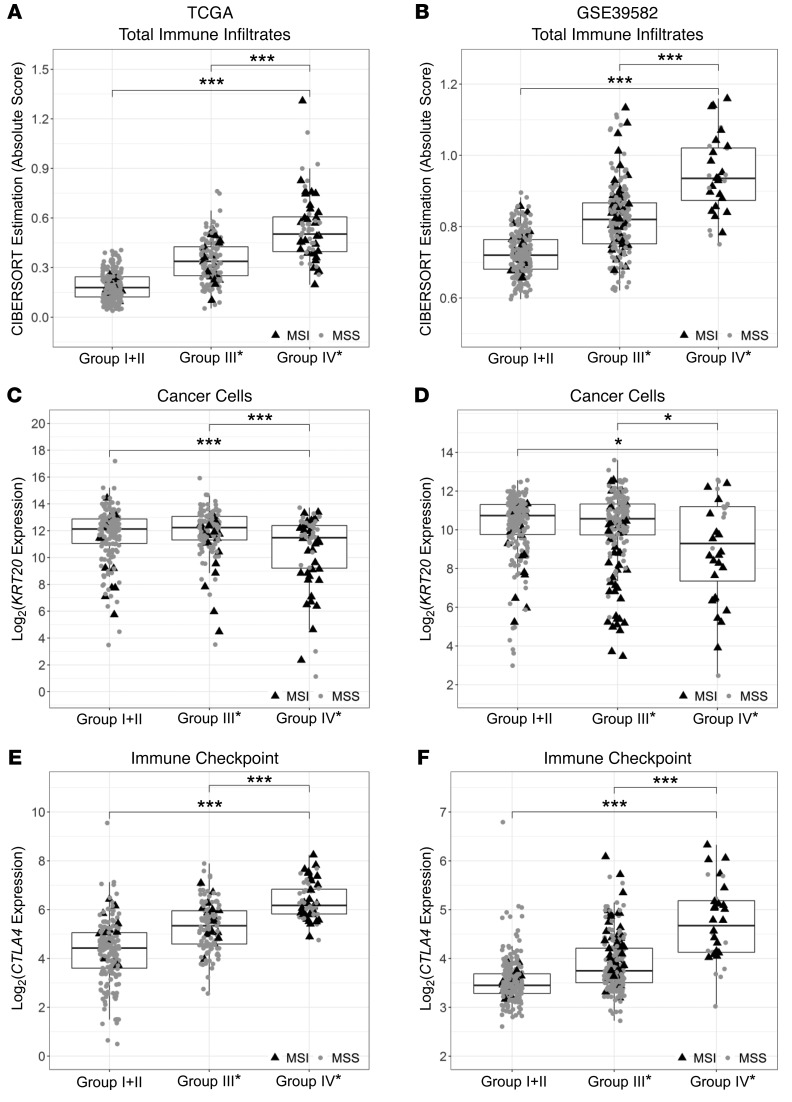
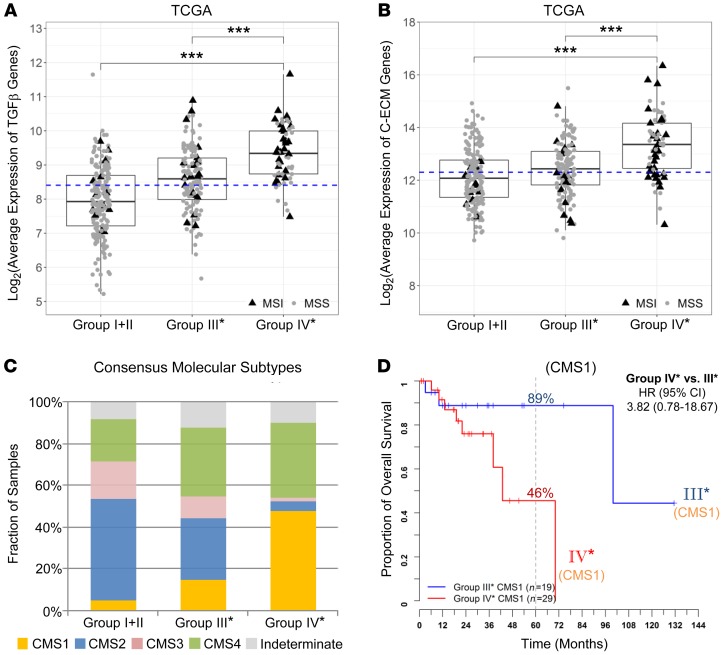
The prognostic value of immune cell infiltration within the tumor microenvironment (TME) has been extensively investigated via histological and genomic approaches. Based on the positive prognostic value of T cell infiltration, Immunoscore has been developed and validated for predicting risk of recurrence for colorectal cancer (CRC). Also, association between a consensus T helper 1 (Th-1) immune response and favorable clinical outcomes has been observed across multiple cancer types. Here, we reanalyzed public genomic data sets from The Cancer Genome Atlas (TCGA) and NCBI Gene Expression Omnibus (NCBI-GEO) and performed multispectral immunohistochemistry (IHC) on a cohort of colorectal tumors. We identified and characterized a risk group, representing approximately 10% of CRC patients, with high intratumoral CD8+ T cell infiltration, but poor prognosis. These tumors included both microsatellite instable (MSI) and stable (MSS) phenotypes and had a high density of tumor-associated macrophages (TAMs) that expressed CD274 (programmed death-ligand 1 [PD-L1]), TGF-β activation, and an immune overdrive signature characterized by the overexpression of immune response and checkpoint genes. Our findings illustrate that CRC patients may have poor prognosis despite high CD8+ T cell infiltration and provide CD274 as a simple biomarker for identifying these patients.

Keywords: Cancer; Immunology; Macrophages; Oncology; T cells.


Conflict of interest statement

Conflict of interest: The authors have declared that no conflict of interest exists.

Figures

Figure 1
Figure 1. Comparison of TME stratification based on CD8A and CD274 gene expression between TCGA melanoma and CRC.
Scatter plots of log2-transformed CD8A and CD274 gene expression values are shown (A and C) for melanoma (n = 459) and CRC (n = 599), respectively. A linear regression line is plotted with the gray shaded region showing the 95% confidence interval. Pearson’s correlation coefficient r and P values are given at the bottom. MSI (black triangles) and MSS (gray circles) statuses are labeled for CRC samples. Median values of CD8A and CD274 expression are indicated with dashed gray lines. log-rank statistics were applied to identify the optimal cut-off for transforming the continuous variable of gene expression into categorical high- and low-expression groups in a survfit model. The test score at each candidate cut-off across the log-transformed gene expression values was plotted. The highest test score (indicated with a blue arrow) was applied for best separating patients into 4 different risk groups (using solid blue lines; named groups I to IV). To compare risk groups between melanoma and CRC, we also applied a secondary peak of test scores (red arrow with an asterisk, which revealed a reverse pattern of survival in CRC as shown in Supplemental Figure 2) for CD274 stratification (indicated with a solid red line instead of a blue line; named groups I, II, III* and IV*). Each stratified risk group is labeled with its population fraction in percentages. Kaplan-Meier survival curves for the 4 risk groups are plotted for melanoma (B) and CRC (D and E). The log-rank test P values are shown for each plot.
Figure 2
Figure 2. Prognostic significance of CD274 is dependent on CD8A gene expression levels in CRC.
The log-rank test score at each candidate cut-off across the log-transformed CD274 gene expression values was plotted (A). A bimodal score distribution was observed, and 2 cut-offs (indicated with blue and red arrows) were tested for dichotomizing the patients for survival analysis (as shown in Figure 1 and Supplemental Figure 2). Scatter plots of log2-transformed CD8A and CD274 gene expression values are shown for TCGA data set (B and D). Median value of CD8A expression was applied to test prognostic significance of CD274 expression in CD8Alo (B) and CD8Ahi (D) populations (n = 299 and 300, respectively; boxed by blue lines). Kaplan-Meier survival curves are plotted (C and E) for the risk groups stratified by optimal CD274 cut-offs shown (B and D). THe log-rank test P values are shown for each plot.
Figure 3
Figure 3. Validation of the CRC risk subpopulation using NCBI-GEO data set.
Scatter plots of log2-transformed CD8A and CD274 gene expression values are shown for TCGA (A) and NCBI-GEO GSE39582 (D) data sets, with risk groups indicated (group I+II as CD8Alo, III* and IV* as CD8Ahi dichotomized by CD274 expression as shown in Figure 2). For OS analysis, Kaplan-Meier survival curves for the 3 risk groups are plotted for TCGA stages I to IV (B) (n = 599) and TCGA stages II to III samples (C) (n = 391), NCBI-GEO GSE39582 stages I to IV (E) (n = 557) and GSE39582 stages II to III samples (F) (n = 461). The log-rank test P values are shown for each plot.
Figure 4
Figure 4. Histological analysis of archival CRC tumors.
(A) Representative multiplex fluorescent image of a stage III colorectal tumor using a panel of markers including CD8, PD-1, CD274, KRT20 (CK20), and DAPI on FFPE tumor specimen in a City of Hope cohort (n = 71). Original magnification, ×200. (B) Scatter plot of log2-transformed CD8 and CD274 (Stroma) cell density (cells/mm2) across the entire cohort. Median values of CD8 and CD274 cell density are indicated with solid blue and dashed gray lines, respectively, along with relapse and MMR status. CD68+ TAM infiltration and the CD274 expression among CRC risk groups were quantified using a second panel of markers, including CD68 (representative images shown in Supplemental Figure 4). Standard boxplots (horizontal lines at the 25th percentile, the median, and the 75th percentile) are applied to visualize the distribution of log2-transformed cell density (cells/mm2) of (C) CD68+ macrophages, (E) CD274+CD68+ macrophages, and (F) CD274CD68+ macrophages across the 3 observed risk groups. Fraction of CD68+ macrophages with CD274 expression for samples across the 3 observed risk groups is compared in D. MMR-deficient (black triangles) and -proficient (gray circles) samples are labeled. Statistical P values between groups were determined by Welch’s t tests after Bonferroni’s correction for multiple comparisons. ***P < 0.001; **P < 0.01; *P < 0.05.
Figure 5
Figure 5. Comparisons of total immune infiltrates and expression levels of cancer cell and representative checkpoint markers across the CRC OS risk groups in TCGA and NCBI-GEO GSE39582 stage II and III samples.
Standard boxplots (horizontal lines at the 25th percentile, the median, and the 75th percentile) are applied to visualize total immune infiltrates and overall gene expression of cancer cells and representative checkpoint markers for each risk group, with MSI (black triangles) and MSS (gray circles) samples labeled. Total immune infiltrates estimated by the tumor deconvolution algorithm CIBERSORT (sum of absolute scores across 22 immune cell types) are shown in panels A and B. KRT20 is applied to represent CRC cells (C and D), and CTLA4 represents immune checkpoint genes (E and F). Statistical P values between groups were determined by Welch’s t tests after Bonferroni’s correction for multiple comparisons: ***P < 0.001, **P < 0.01, *P < 0.05. (A, C, and E) TCGA, n = 391; (B, D, and F) NCBI-GEO GSE39582, n = 461.
Figure 6
Figure 6. Expression of TGF-β–encoding and C-ECM signature genes and the distribution of CMSs across the CRC OS risk groups in TCGA stage II and III samples.
Standard boxplots (horizontal lines at the 25th percentile, the median, and the 75th percentile) are applied to visualize the expression levels of (A) TGF-β–encoding genes (log2-transformed averages of TGFB1, TGFB2, TGFB3 genes) and (B) C-ECM genes (log2-transformed average of 30 upregulated signature genes). Median expression value is indicated with a dashed line. Statistical P values between groups were determined by Welch’s t tests after Bonferroni’s correction for multiple comparisons: ***P < 0.001. (C) Fractions of CMS subtypes (CMS1, MSI immune; CMS2, canonical; CMS3, metabolic; CMS4, mesenchymal) in each of our stratified risk groups. (D) Kaplan-Meier survival curves for CMS1 patients further separated into CD8Ahi risk groups III* and IV*. (AC) TCGA, n = 301; (D) TCGA CMS1, n = 48.

References

    1. Pagès F, et al. Effector memory T cells, early metastasis, and survival in colorectal cancer. N Engl J Med. 2005;353(25):2654–2666. doi: 10.1056/NEJMoa051424. - DOI - PubMed
    1. Jochems C, Schlom J. Tumor-infiltrating immune cells and prognosis: the potential link between conventional cancer therapy and immunity. Exp Biol Med (Maywood) 2011;236(5):567–579. doi: 10.1258/ebm.2011.011007. - DOI - PMC - PubMed
    1. Fridman WH, Pagès F, Sautès-Fridman C, Galon J. The immune contexture in human tumours: impact on clinical outcome. Nat Rev Cancer. 2012;12(4):298–306. doi: 10.1038/nrc3245. - DOI - PubMed
    1. Galon J, Angell HK, Bedognetti D, Marincola FM. The continuum of cancer immunosurveillance: prognostic, predictive, and mechanistic signatures. Immunity. 2013;39(1):11–26. doi: 10.1016/j.immuni.2013.07.008. - DOI - PubMed
    1. Norton SE, Ward-Hartstonge KA, Taylor ES, Kemp RA. Immune cell interplay in colorectal cancer prognosis. World J Gastrointest Oncol. 2015;7(10):221–232. doi: 10.4251/wjgo.v7.i10.221. - DOI - PMC - PubMed

Publication types

MeSH terms