

Automated and Interpretable Patient ECG Profiles for Disease Detection, Tracking, and Discovery
- PMID: 31525078
- PMCID: PMC6951431
- DOI: 10.1161/CIRCOUTCOMES.118.005289
Automated and Interpretable Patient ECG Profiles for Disease Detection, Tracking, and Discovery
Abstract
Background: The ECG remains the most widely used diagnostic test for characterization of cardiac structure and electrical activity. We hypothesized that parallel advances in computing power, machine learning algorithms, and availability of large-scale data could substantially expand the clinical inferences derived from the ECG while at the same time preserving interpretability for medical decision-making.
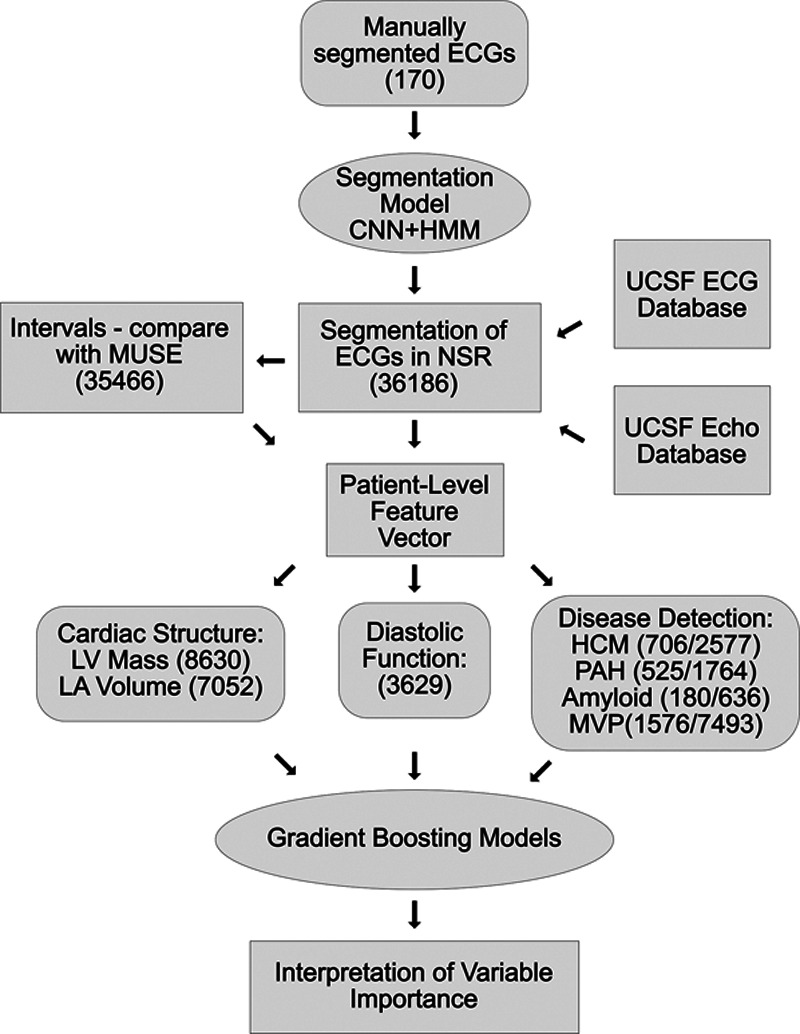
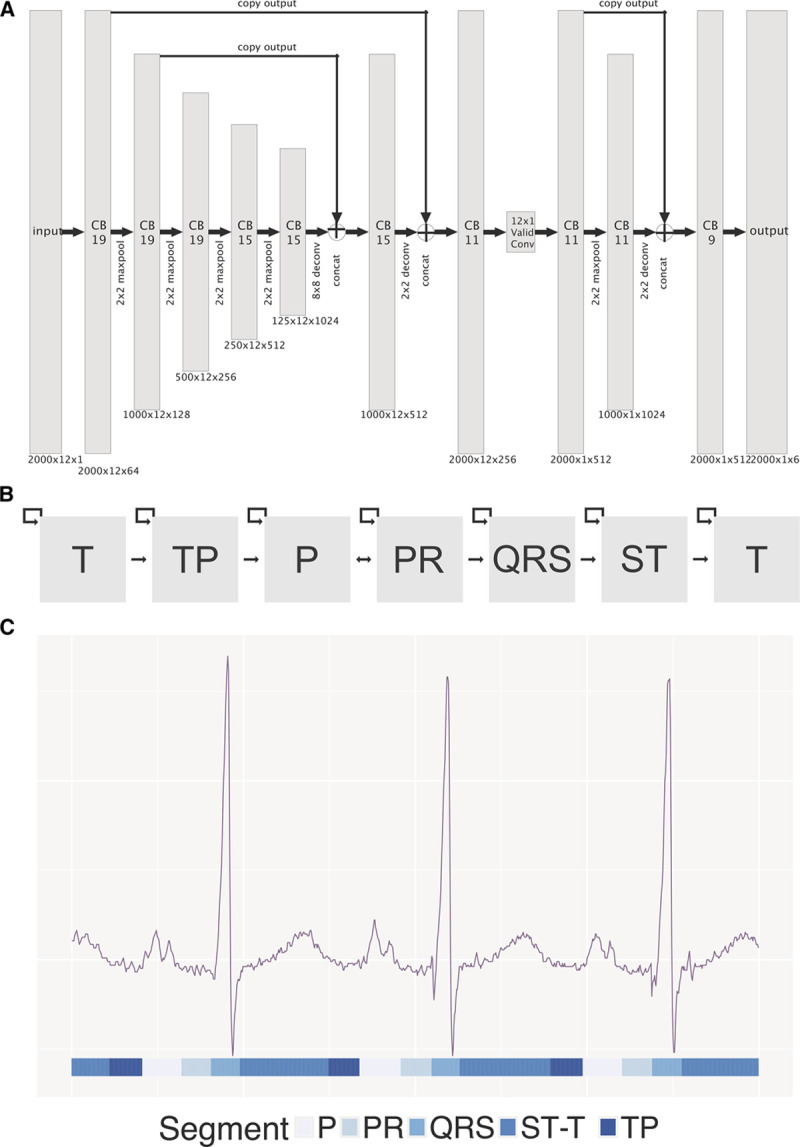
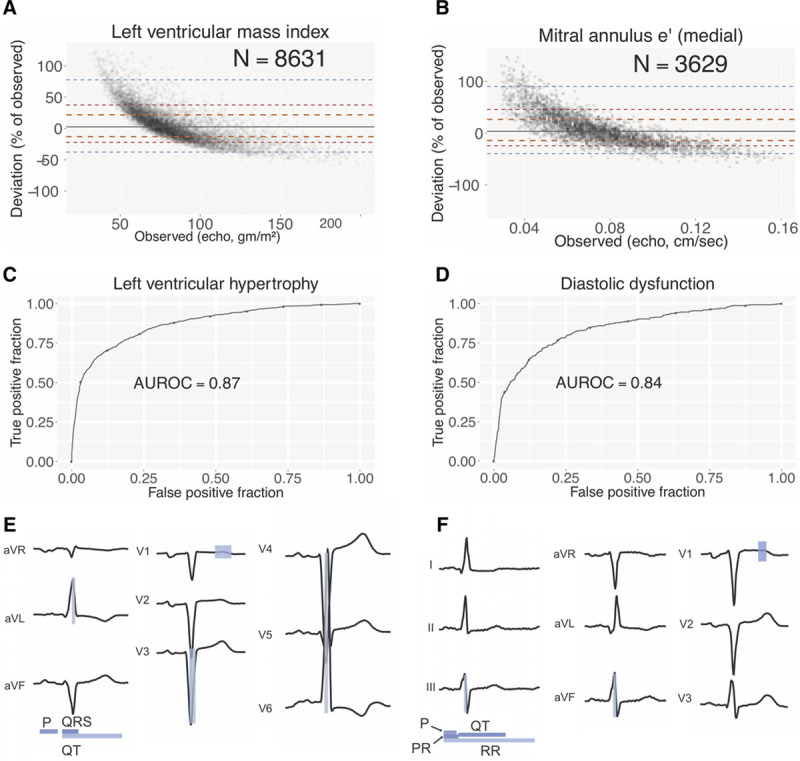
Methods and results: We identified 36 186 ECGs from the University of California, San Francisco database that would enable training of models for estimation of cardiac structure or function or detection of disease. We segmented the ECG into standard component waveforms and intervals using a novel combination of convolutional neural networks and hidden Markov models and evaluated this segmentation by comparing resulting electrical intervals against 141 864 measurements produced during the clinical workflow. We then built a patient-level ECG profile, a 725-element feature vector and used this profile to train and interpret machine learning models for examples of cardiac structure (left ventricular mass, left atrial volume, and mitral annulus e-prime) and disease (pulmonary arterial hypertension, hypertrophic cardiomyopathy, cardiac amyloid, and mitral valve prolapse). ECG measurements derived from the convolutional neural network-hidden Markov model segmentation agreed with clinical estimates, with median absolute deviations as a fraction of observed value of 0.6% for heart rate and 4% for QT interval. Models trained using patient-level ECG profiles enabled surprising quantitative estimates of left ventricular mass and mitral annulus e' velocity (median absolute deviation of 16% and 19%, respectively) with good discrimination for left ventricular hypertrophy and diastolic dysfunction as binary traits. Model performance using our approach for disease detection demonstrated areas under the receiver operating characteristic curve of 0.94 for pulmonary arterial hypertension, 0.91 for hypertrophic cardiomyopathy, 0.86 for cardiac amyloid, and 0.77 for mitral valve prolapse.
Conclusions: Modern machine learning methods can extend the 12-lead ECG to quantitative applications well beyond its current uses while preserving the transparency that is so fundamental to clinical care.
Keywords: heart rate; hypertension; machine learning; mitral valve prolapse; work flow.
Figures


Comment in
-
Intelligent Artificial Intelligence: Present Considerations and Future Implications of Machine Learning Applied to Electrocardiogram Interpretation.Circ Cardiovasc Qual Outcomes. 2019 Sep;12(9):e006021. doi: 10.1161/CIRCOUTCOMES.119.006021. Epub 2019 Sep 5. Circ Cardiovasc Qual Outcomes. 2019. PMID: 31525077 Free PMC article. No abstract available.
References
-
- Drazen E, Mann N, Borun R, Laks M, Bersen A. Survey of computer-assisted electrocardiography in the United States. J Electrocardiol. 1988;21(suppl):S98–104. - PubMed
-
- Bhatia RS, Bouck Z, Ivers NM, Mecredy G, Singh J, Pendrith C, Ko DT, Martin D, Wijeysundera HC, Tu JV, Wilson L, Wintemute K, Dorian P, Tepper J, Austin PC, Glazier RH, Levinson W. Electrocardiograms in low-risk patients undergoing an annual health examination. JAMA Intern Med. 2017;177:1326–1333. doi: 10.1001/jamainternmed.2017.2649. - PMC - PubMed
-
- Pitts SR, Niska RW, Xu J, Burt CW. National hospital ambulatory medical care survey: 2006 emergency department summary. Natl Health Stat Report. 2008;7:1–38. - PubMed
-
- Schläpfer J, Wellens HJ. Computer-interpreted electrocardiograms: benefits and limitations. J Am Coll Cardiol. 2017;70:1183–1192. doi: 10.1016/j.jacc.2017.07.723. - PubMed
-
- Blackburn H, Keys A, Simonson E, Rautaharju P, Punsar S. The electrocardiogram in population studies. A classification system. Circulation. 1960;21:1160–1175. doi: 10.1161/01.cir.21.6.1160. - PubMed
Publication types
MeSH terms
Grants and funding
LinkOut - more resources
Full Text Sources
Other Literature Sources
