Review
. 2019 Sep 15:5:317-339.
doi: 10.1146/annurev-vision-091517-034407.

The Visual Cortex in Context

Affiliations
Review

The Visual Cortex in Context

Emmanouil Froudarakis et al. Annu Rev Vis Sci. .

Abstract

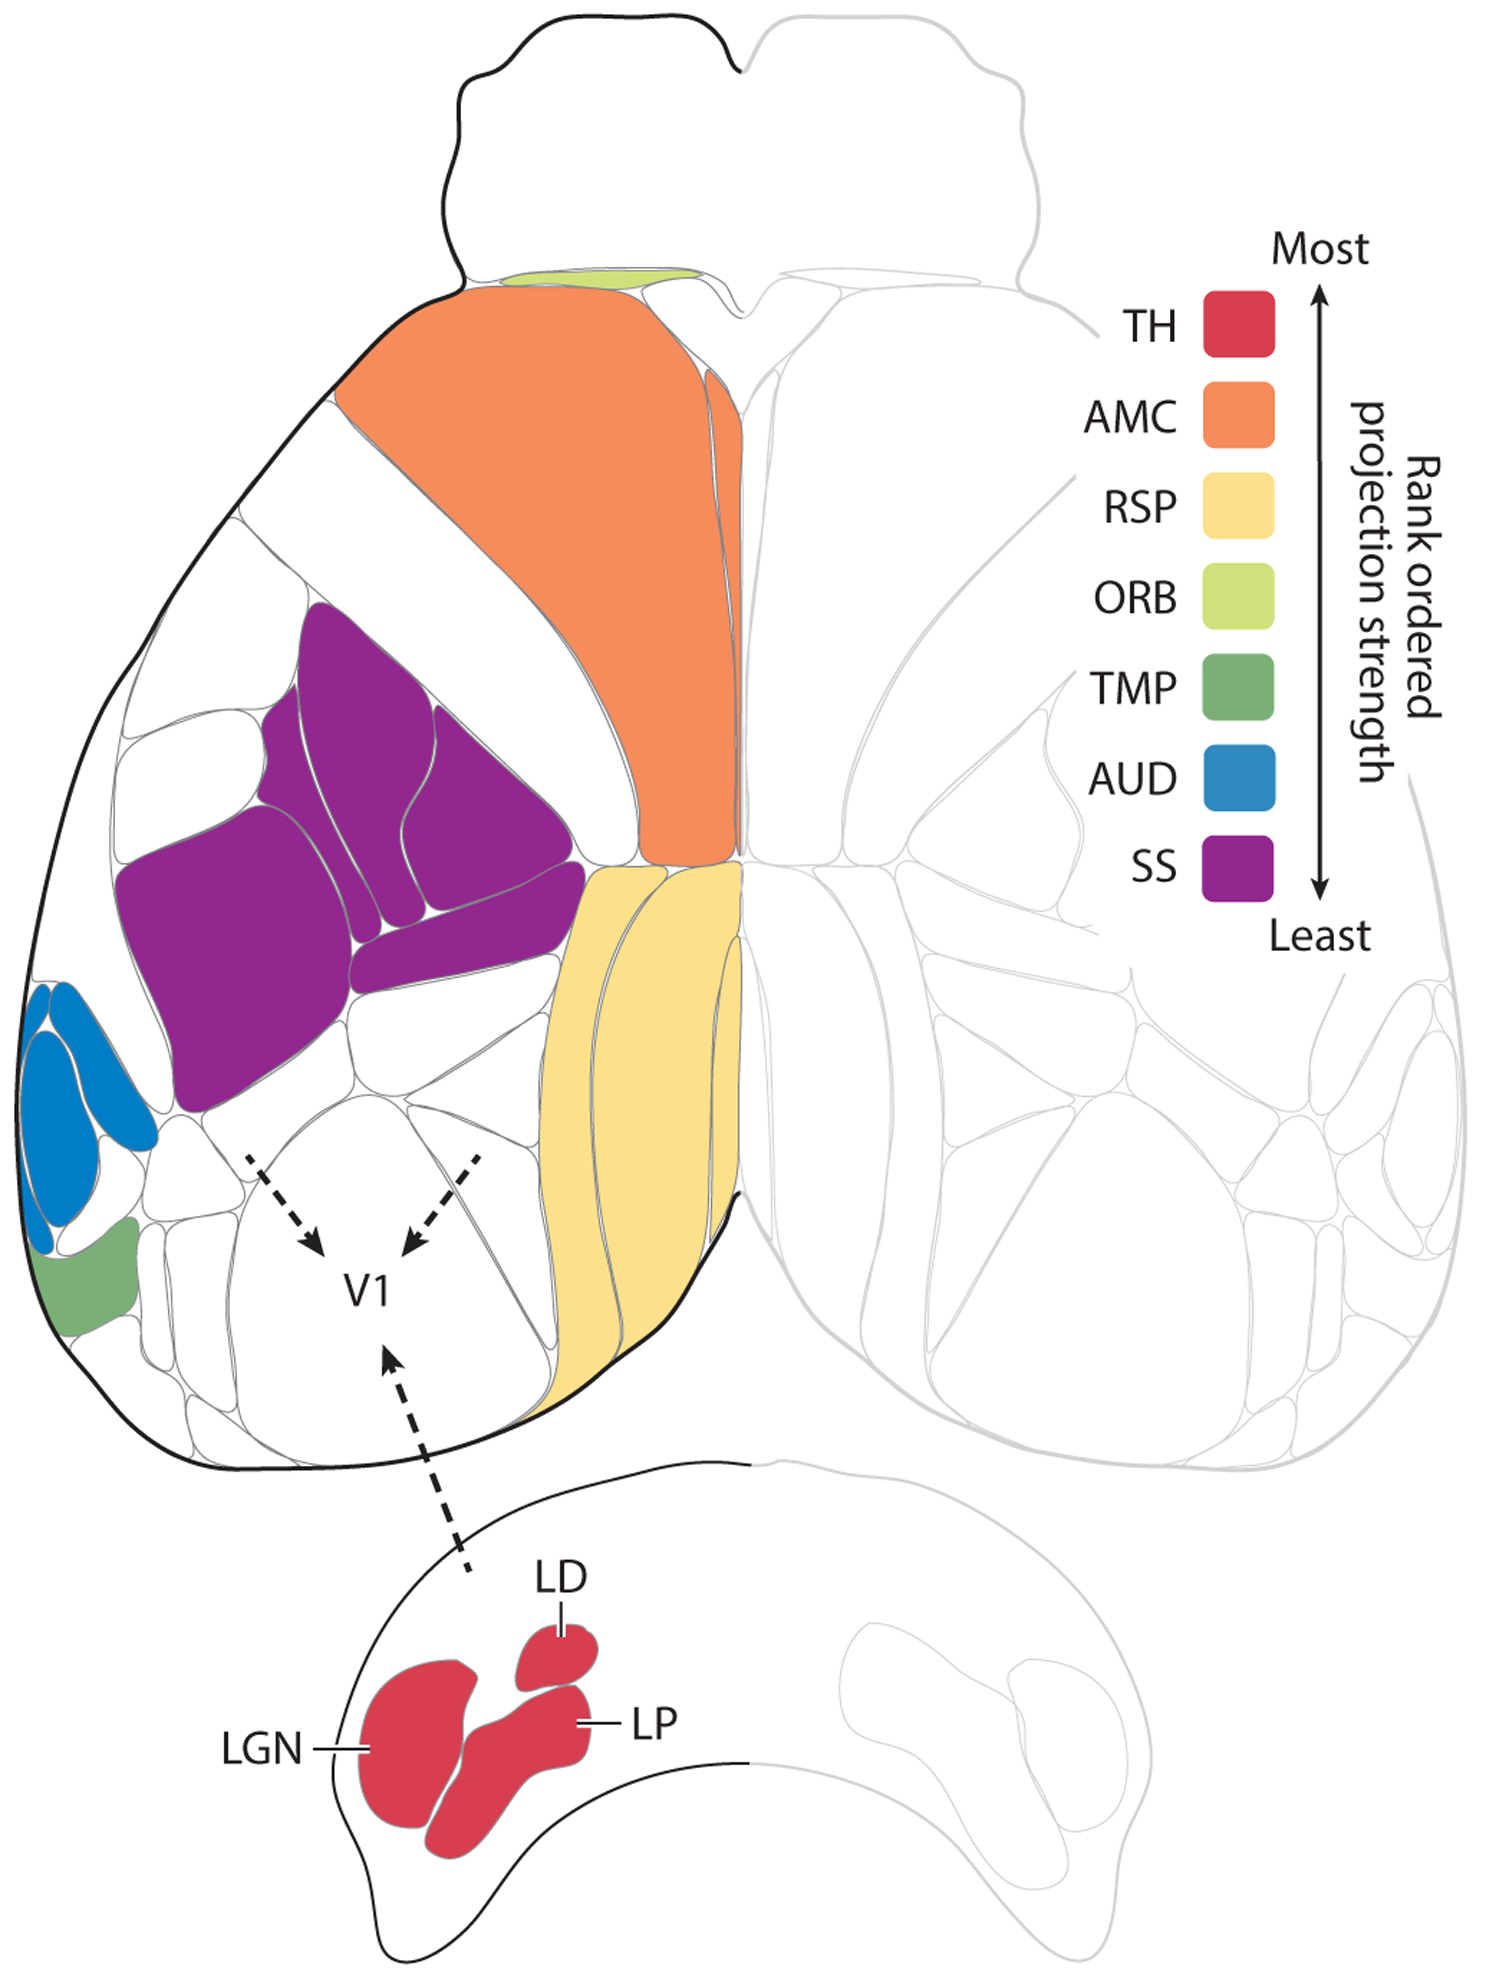
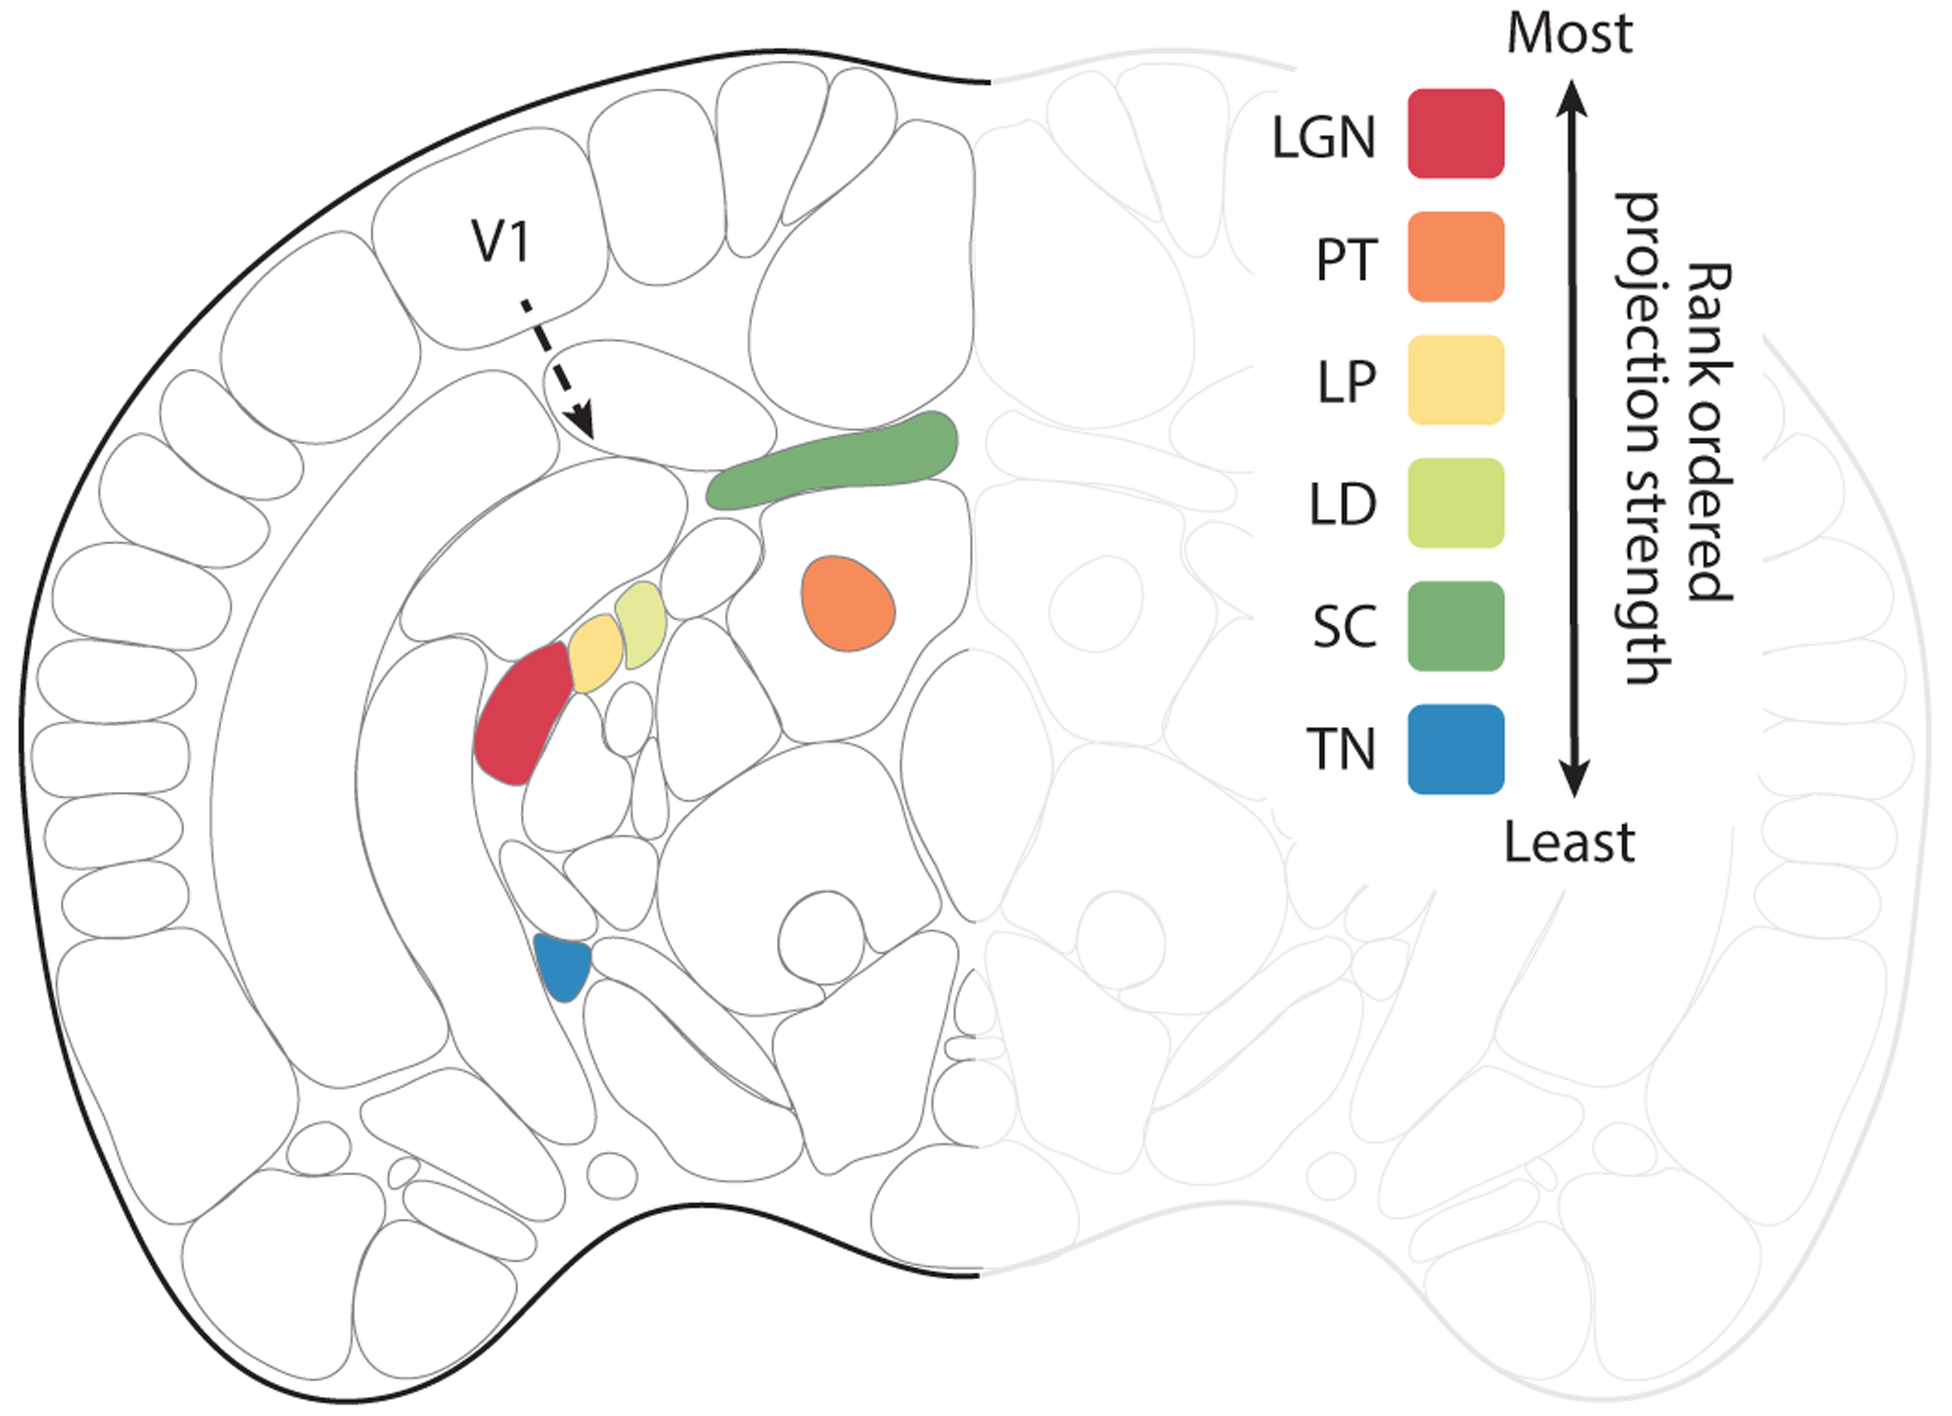
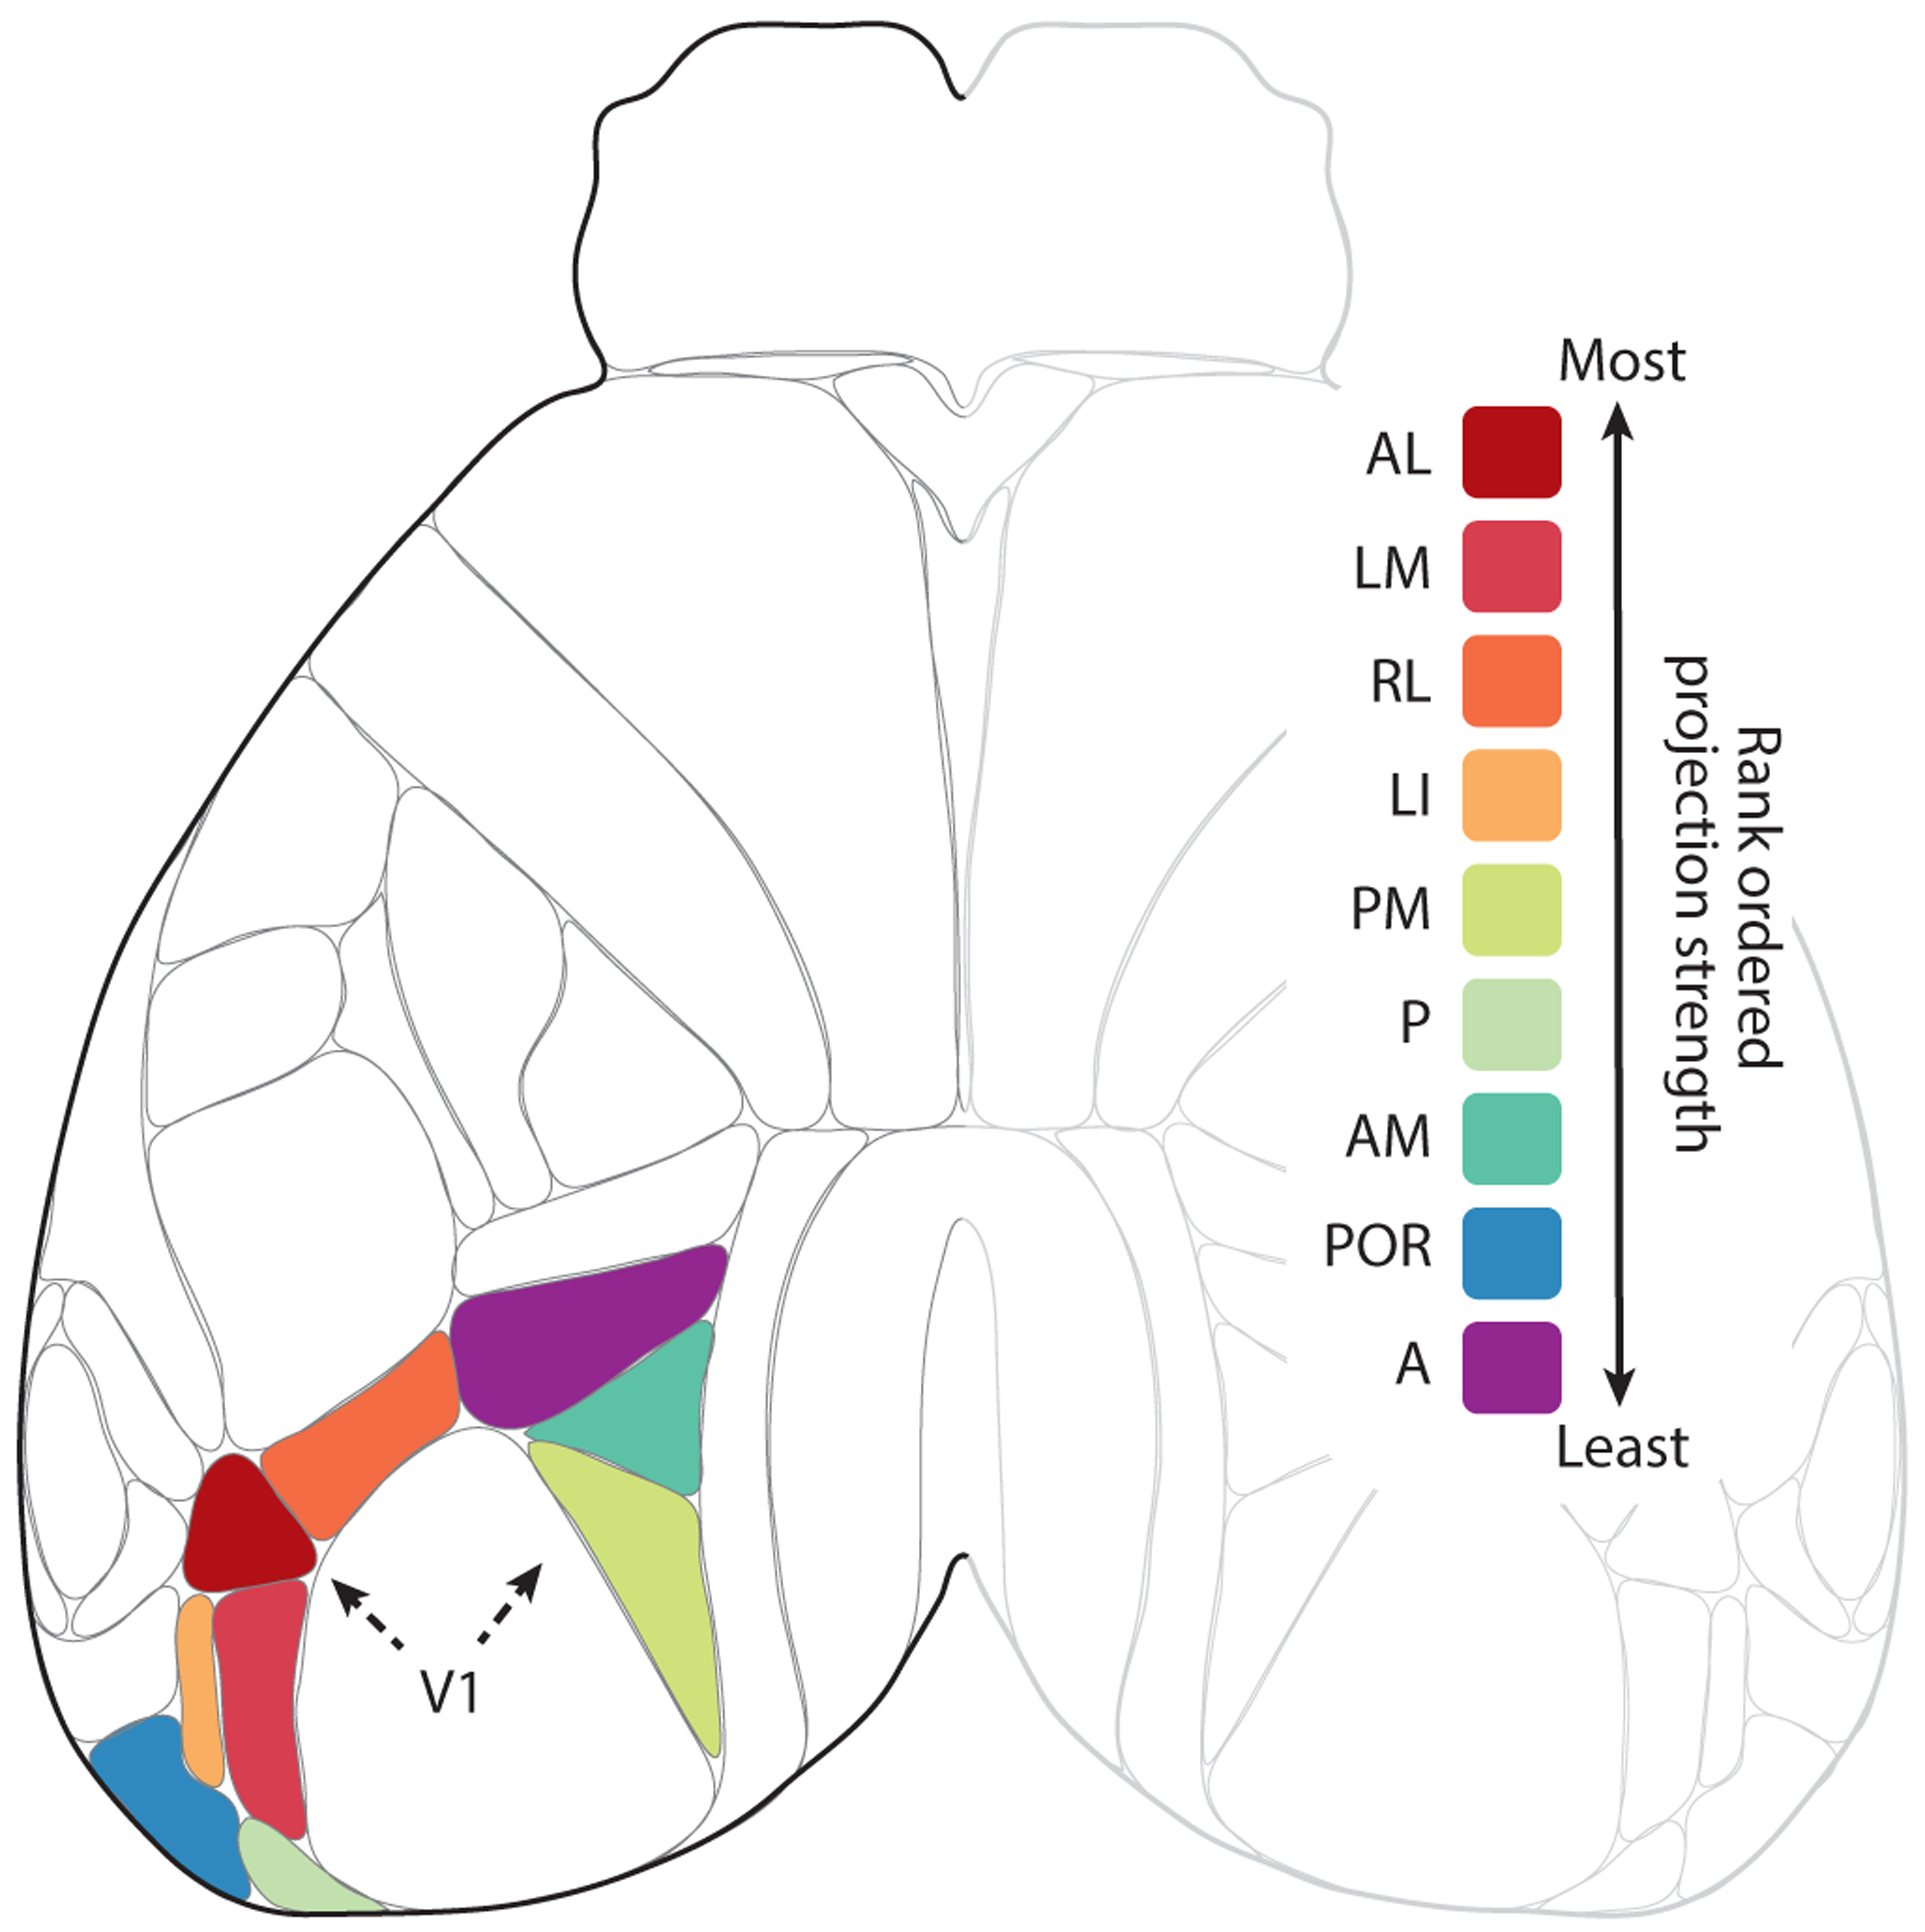
In this article, we review the anatomical inputs and outputs to the mouse primary visual cortex, area V1. Our survey of data from the Allen Institute Mouse Connectivity project indicates that mouse V1 is highly interconnected with both cortical and subcortical brain areas. This pattern of innervation allows for computations that depend on the state of the animal and on behavioral goals, which contrasts with simple feedforward, hierarchical models of visual processing. Thus, to have an accurate description of the function of V1 during mouse behavior, its involvement with the rest of the brain circuitry has to be considered. Finally, it remains an open question whether the primary visual cortex of higher mammals displays the same degree of sensorimotor integration in the early visual system.

Keywords: V1 circuits; behavioral state; corticofugal projections; corticopetal projections; sensorimotor control; transcortical projections.


Figures

Figure 1
Figure 1
Afferent projections to V1. Shown is a top view of the mouse neocortex based on the Allen common coordinate framework v.3 plus the thalamic nuclei that project to V1. Robustness of afferent projections outside of the visual cortex to V1 is shown rank ordered according to the density of projections adjusted for injection size. The inputs from most robust to least robust were: (1) the dorsal and ventral part of the lateral geniculate nucleus (LGN), lateral posterior (LP) and lateral dorsal nuclei (LD) of the thalamus (TH); (2) the secondary motor and anterior cingulate areas (AMC); (3) the retrosplenial areas and postsubiculum (RSP); (4) the orbital areas (ORB) (note that, for visibility reasons, only the area just anterior to AMC is indicated as part of the orbital areas); (5) the temporal, ectorhinal, perirhinal, entorhinal, postrhinal, subiculum, and CA1 areas (TMP) (note that only parts of the areas are visible); (6) the auditory areas (AUD); and (7) the somatosensory areas, including the whisker representation (SS). Details regarding the injections: We examined recombinant adeno-associated virus injections into wild-type mice from the Allen dataset into visual and non-visual areas and used a combination of projection pixel density and intensity (weighted by injection volume) to develop a qualitative ranking of projection strength (robustness) between areas. For V1 afferent connectivity, injections that also infected visual areas were discarded.
Figure 2
Figure 2
Efferent subcortical projections from V1. Coronal view of the mouse brain. Based on the Allen common coordinate framework v.3 to include the lateral dorsal nucleus of the thalamus (LD) plus efferent projection zones of V1 (area 17). Robustness of efferent projections outside of the visual cortex is shown for the wild-type mouse, rank ordered according to the density of projections adjusted for injection size. The inputs from most robust to least robust were: (1) the lateral geniculate nucleus (LGN), (2) the pretectal nuclei (PT), (3) the lateral posterior nucleus of thalamus (LP), (4) the LD, (5) the superior colliculus (SC), and (6) the terminal nuclei (TN).
Figure 3
Figure 3
Efferent cortico-visual projections from V1. Shown is a top view of mouse neocortex based on the Allen common coordinate framework v.3. Robustness of efferent projections to and from V1 is illustrated for the wild-type mouse, rank ordered according to the density of projections of visual cortex adjusted for injection size. The inputs from most robust to least robust were: (1) the anterolateral visual area (VISal/AL), (2) the lateromedial visual area (VISlm/LM), (3) the rostrolateral visual area (VISrl/RL), (4) the lateral intermediate visual area (VISli/LI), (5) the posteromedial visual area (VISpm/PM), (6) the posterior visual area (VISp/P), (7) the anteromedial visual area (VISam/AM), (8) the postrhinal visual area (VISpor/POR), and (9) the anterior visual area (VISa/A).

References

    1. Aggleton JP, Keen S, Warburton EC, Bussey TJ. 1997. Extensive cytotoxic lesions involving both the rhinal cortices and area TE impair recognition but spare spatial alternation in the rat. Brain Res. Bull 43:279–87 - PubMed
    1. Agster KL, Burwell RD. 2009. Cortical efferents of the perirhinal, postrhinal, and entorhinal cortices of the rat. Hippocampus 19:1159–86 - PMC - PubMed
    1. Ahmadlou M, Zweifel LS, Heimel JA. 2018. Functional modulation of primary visual cortex by the superior colliculus in the mouse. Nat. Commun 9:3895. - PMC - PubMed
    1. Alexander AS, Nitz DA. 2015. Retrosplenial cortex maps the conjunction of internal and external spaces. Nat. Neurosci 18:1143–51 - PubMed
    1. Andermann ML, Kerlin AM, Roumis DK, Glickfeld LL, Reid RC. 2011. Functional specialization of mouse higher visual cortical areas. Neuron 72:1025–39 - PMC - PubMed

Publication types

MeSH terms

LinkOut - more resources