. 2019 Sep 16;15(9):e1007284.
doi: 10.1371/journal.pcbi.1007284. eCollection 2019 Sep.

Fast and near-optimal monitoring for healthcare acquired infection outbreaks

Affiliations

Fast and near-optimal monitoring for healthcare acquired infection outbreaks

Bijaya Adhikari et al. PLoS Comput Biol. .

Abstract

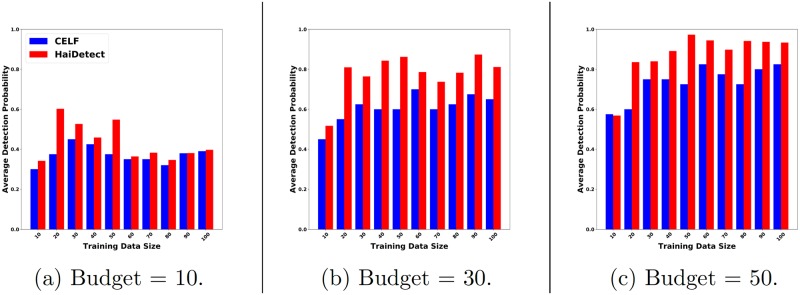
According to the Centers for Disease Control and Prevention (CDC), one in twenty five hospital patients are infected with at least one healthcare acquired infection (HAI) on any given day. Early detection of possible HAI outbreaks help practitioners implement countermeasures before the infection spreads extensively. Here, we develop an efficient data and model driven method to detect outbreaks with high accuracy. We leverage mechanistic modeling of C. difficile infection, a major HAI disease, to simulate its spread in a hospital wing and design efficient near-optimal algorithms to select people and locations to monitor using an optimization formulation. Results show that our strategy detects up to 95% of "future" C. difficile outbreaks. We design our method by incorporating specific hospital practices (like swabbing for infections) as well. As a result, our method outperforms state-of-the-art algorithms for outbreak detection. Finally, a qualitative study of our result shows that the people and locations we select to monitor as sensors are intuitive and meaningful.


Conflict of interest statement

The authors have declared that no competing interests exist.

Figures

Fig 1
Fig 1. Visualization of a possible HAI spread.
The only healthcare worker in the example is marked with a ‘+’ sign. The rest of the humans are patients and visitors. Each individual is assigned a unique combination of color and silhouette pair. Infected humans are indicated by the green emoji and contaminated locations are indicated by the bacteria emoji. As human agents move through various locations, they infect other agents and contaminate the locations.
Fig 2
Fig 2. Human infection model for C. difficile.
Each state in the finite state machine shown above indicates the stages in the infection/recovery process. The arrows indicate possible transition in state and the weight on the arrows indicate the transition probability. The dashed arrows represent transition under medication.
Fig 3
Fig 3. Fomite contamination model for C. difficile.
Each state in the finite state machine shown above indicates the stages in the contamination/decay process. The solid arrows indicate possible transition in state. The transition between the states depend on number of infected people in the location. The dashed arrows represent transition assuming cleaning.
Fig 4
Fig 4. Infection distribution for various categories of agents.
Note that “EV” stands for external visitors. (a) Infection for each agent category averaged across simulation instances. (b) Average infection normalized by the number of agents in each category. High susceptibility of healthcare workers can be attributed to their high mobility. Patients have the highest number of infections on average despite having a low normalized infection rate as they are the largest population group.
Fig 5
Fig 5. The objective value due to the solution returned by HaiDetect and the bounds for various budgets.
The region in the dashed box shows where HaiDetect is optimal.
Fig 6
Fig 6. Probability of detecting future outbreaks (normalized) for different budgets.
HaiDetect significantly outperforms Celf implying that monitoring sensors selected by HaiDetect have higher chance of detecting an outbreak.
Fig 7
Fig 7. Average probability of detecting future outbreaks for sensors computed using T simulations (training) for different values of T, and tested on the remaining simulations for a budgets of (a) 10, (b) 30, and (c) 50.
Note that HaiDetect required only 20 simulation instances to detect future outbreak with probability of 0.8.
Fig 8
Fig 8. Average probability of detecting future outbreaks for sensor sets computed using T simulations (training), and evaluated using the remaining simulations for different budget values.
Fig 9
Fig 9. Average dectection time (in days) for various budgets.
The flat lines are the detection time for monitoring all members of different categories of agents. Note that for a budget of 1000, monitoring sensors selected by HaiEarlyDetect detect future outbreaks earlier than monitoring all nurses.
Fig 10
Fig 10. Variation in detection time (in days) for various budgets.
As budget increases, the variation decreases.
Fig 11
Fig 11. Variation of sensor set distribution for HaiDetect with budget.
HaiDetect selects intuitively meaningful sensors even for lower budgets.
Fig 12
Fig 12. Distribution of allocation for different rates.
Since most of the sensors selected by HaiDetect have low rates, they have to be monitored only sporadically.

References

    1. Stone P. W., “Economic burden of healthcare-associated infections: an american perspective,” Expert review of pharmacoeconomics & outcomes research, vol. 9, no. 5, pp. 417–422, 2009. 10.1586/erp.09.53 - DOI - PMC - PubMed
    1. Cassini A., Plachouras D., Eckmanns T., Sin M. A., Blank H.-P., Ducomble T., Haller S., Harder T., Klingeberg A., Sixtensson M., et al., “Burden of six healthcare-associated infections on european population health: estimating incidence-based disability-adjusted life years through a population prevalence-based modelling study,” PLoS medicine, vol. 13, no. 10, p. e1002150, 2016. 10.1371/journal.pmed.1002150 - DOI - PMC - PubMed
    1. Leclère B., Buckeridge D. L., Boëlle P.-Y., Astagneau P., and Lepelletier D., “Automated detection of hospital outbreaks: A systematic review of methods,” PloS one, vol. 12, p. e0176438, April 2017. 10.1371/journal.pone.0176438 - DOI - PMC - PubMed
    1. Lewis B., Eubank S., Abrams A. M., and Kleinman K., “In silico surveillance: evaluating outbreak detection with simulation models.,” BMC medical informatics and decision making, vol. 13, p. 12, January 2013. 10.1186/1472-6947-13-12 - DOI - PMC - PubMed
    1. Lofgren E. T., Moehring R. W., Anderson D. J., Weber D. J., and Fefferman N. H., “A mathematical model to evaluate the routine use of fecal microbiota transplantation to prevent incident and recurrent clostridium difficile infection,” Infection Control and Hospital Epidemiology, 2013. - PMC - PubMed

Publication types

MeSH terms