. 2019 Nov;76(11-12):532-548.
doi: 10.1002/cm.21565. Epub 2019 Oct 31.

Organization of associating or crosslinked actin filaments in confinement

Affiliations

Organization of associating or crosslinked actin filaments in confinement

Maral Adeli Koudehi et al. Cytoskeleton (Hoboken). 2019 Nov.

Abstract

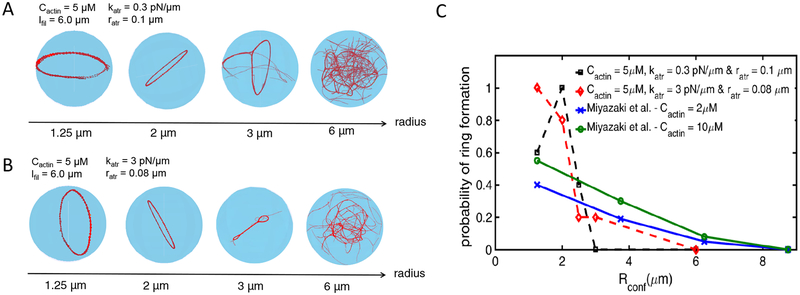
A key factor of actin cytoskeleton organization in cells is the interplay between the dynamical properties of actin filaments and cell geometry, which restricts, confines and directs their orientation. Crosslinking interactions among actin filaments, together with geometrical cues and regulatory proteins can give rise to contractile rings in dividing cells and actin rings in neurons. Motivated by recent in vitro experiments, in this work we performed computer simulations to study basic aspects of the interplay between confinement and attractive interactions between actin filaments. We used a spring-bead model and Brownian dynamics to simulate semiflexible actin filaments that polymerize in a confining sphere with a rate proportional to the monomer concentration. We model crosslinking, or attraction through the depletion interaction, implicitly as an attractive short-range potential between filament beads. In confining geometries smaller than the persistence length of actin filaments, we show rings can form by curving of filaments of length comparable to, or longer than the confinement diameter. Rings form for optimal ranges of attractive interactions that exist in between open bundles, irregular loops, aggregated, and unbundled morphologies. The probability of ring formation is promoted by attraction to the confining sphere boundary and decreases for large radii and initial monomer concentrations, in agreement with prior experimental data. The model reproduces ring formation along the flat plane of oblate ellipsoids.

Keywords: actin; computational modeling; confinement.


Figures

Figure 1:
Figure 1:
Simulation of attractive actin network in confinement. (A) A semi-flexible actin filament is described by a bead-spring model with spring and bending forces. The beads are separated by equilibrium distance l0 = 0.1 μm. (B) Attractive or crosslink interactions are represented by a force between two non-neighboring beads at distance r (when r < ratr) with spring constant katr and equilibrium length r0. (C) Plot of attractive potential for the indicated values of l0, katr, and ratr for r0 = 12 nm. (D) Example of actin ring formation in a confining droplet at indicated parameter values. In this simulation 140 filaments start to polymerize at t = 0 at a rate corresponding to the calculated concentration of remaining actin monomers in the bulk, reaching a final length of 3.8 μm after approximately 100 s. In snapshots of this and following figures, yellow beads are at the barbed ends.
Figure 2:
Figure 2:
Attraction influences configuration of confined actin filaments. (A) Snapshots of simulations with 60 non-interacting filaments after 1500 s in a sphere of radius Rconf = 2.5 μm. The three cases show filaments of length lfil = 1.2, 4.5, and 20 μm. (B) Radial bead density plotted as function of distance from sphere center for the three cases in panel A. (C) Snapshots of simulations at 1500 s, for Rconf = 2.5 μm and 60 filaments with lfil = 20 μm without and with attraction (katr = 3 pN/μm, ratr = 0.06 μm). Here the initial concentration of actin monomers was 11 μM. (D) Radial bead density plotted as function of distance from sphere center for the two cases of panel C. In panels B and D the average is calculated by sampling beads in all 60 filaments from 500 s to 1500 s every 5 s. The curves in panels B and D become noisier close to r = 0 (and thus not plotted very close to 0) due to fluctuations in the number of beads over a small volume, as well as the irregular structure of the collapsed filaments in panel C.
Figure 3:
Figure 3:
Simulations of polymerizing and associating actin filaments in the bulk. (A–C) Snapshots of simulation for a square box of size 5μm, periodic boundary conditions, and 265 filaments polymerizing from an initial 5 μM monomer concentration. Filaments reach length lfil = 3.8 μm. Beads in range (not in range) to interact with neighboring beads are shown in black (red). In all cases ratr = 0.06 μm. As katr is varied, a transition from an unbundled phase to a network of bundles occurs at around katr = 1.5 pN/μm. Simulations in panels B and C are terminated before the network starts to deform in an unphysical manner as a result of the periodic boundary conditions. (D) Normalized distribution of thickness (measured in number of filaments, see Model and Methods section) of actin filament bundles for various values of katr, at the indicated times, which correspond to the times at which the simulations were terminated. The fraction of beads interacting with other beads is 0.035, 0.027, 0.028, 0.035, 0.526, 0.527 for katr = 0.3, 0.5, 1.0, 1.5, 2.0, and 3.0 pN/μm respectively.
Figure 4:
Figure 4:
Actin network morphology for filaments that elongate to lengths shorter than the diameter of the confinement. The final configuration depends on the strength of attraction katr and range of interaction ratr. (A) Snapshots of simulation at 1500 s for Cactin = 5 μM, Rconf = 2.5 μm, 420 filaments, and final filament length lfil = 1.2 μm for four values of ratr and four values of katr as indicated. (B) Average radius, sampled from 1000 to 1500 s every 10 s, as a function of ratr and katr, averaged over 3 separate runs. (C) Average planar order parameter, sampled as in panel B. (D) Snapshots of the case of katr = 3.0 pN/μm and ratr = 0.06 μm over time.
Figure 5:
Figure 5:
Actin network morphology for filaments that elongate to lengths comparable to the diameter of the confinement. Similar to Fig. 4, with the addition of panel B showing the probability of ring formation. (A) Snapshots of simulation at 1500 s for Cactin = 5 μM and Rconf = 2.5 μm, and 140 filaments reaching lfil = 3.8 μm. Snapshots show representative examples; results can vary in each run, with rings, open bundles, or both occuring with different probability for the same parameter values. (B) Plot of probability of ring formation for 5 runs. (C) Average radius, sampled from 1000 to 1500 s every 10 s for 5 runs. (C) As panel D, but for planar order parameter. (E) Snapshots of the case katr = 2 pN/μm and ratr = 0.1 μm showing ring formation and shrinkage.
Figure 6:
Figure 6:
Actin network morphology for filaments that elongate to lengths longer than the diameter of the confinement. (A)-(D) Results for Cactin = 5 μM, Rconf = 2.5 μm presented in the same way as in Fig. 5 but for 26 filaments reaching lfil = 20 μm. Snapshots show representative examples; results can vary in each run. The averages in panels B-D are over 5 runs. (E) Snapshots of the case of katr = 3 pN/μm and ratr = 0.1 μm showing the development of an aggregated structure over time.
Figure 7:
Figure 7:
Summary diagrams of confined actin structures, as a function of the strength of attraction katr, range of interaction ratr, for varying final filament length and confining radius. All cases are for Cactin = 5μM. (A)-(C) Results for Rconf = 2.5 μm from Figs. 4–6. (D)-(F) Results for Rconf = 2.0 μm from Figs. S4–S6. Labels indicate the dominant structures for each parameter value.
Figure 8:
Figure 8:
Probability of ring formation vs. size of the confinement. (A) Snapshots of simulation at 200 s for Cactin = 5μM, using parameter set PS1 (katr = 0.3 pN/μm, ratr = 0.1 μm) and varying confining radius Rconf as shown. The corresponding number of filaments in the four cases were 11, 45, 153, and 1227 such that the final filament length is always lfil = 6 μm. (B) Same as panel A, for PS2 (katr = 3 pN/μm, ratr = 0.08 μm). (C) Probability of ring formation as function of confinement radius (out of 5 runs) for PS1 (dashed black line) and PS2 (dashed red line) compared to experiment data reproduced from Miyazaki et al. [Miyazaki et al., 2015] for Cactin = 2 μM (blue solid line) and Cactin = 10 μM (green solid line).
Figure 9:
Figure 9:
Probability of ring formation vs. actin concentration (A) Snapshots of simulation at 500 s for Rconf = 2.5μm, using parameter set PS1 (katr = 0.3 pN/μm, ratr = 0.1 μm) and varying concentration Cactin as shown. The corresponding number of filaments in the four cases were 36, 54, 89, and 142 such that the final filament length is always lfil = 6 μm. (B) Same as panel A, for PS2 (katr = 3 pN/μm, ratr = 0.08 μm). (C) Probability of ring formation as function of actin concentration (out of 5 runs) for PS1 (black) and PS2 (red).
Figure 10:
Figure 10:
Ring formation and orientation in spheres and ellipsoids. Results of simulations (near 1000 s) for Cactin = 5 μM, all at the same volume, with 45 filaments reaching length lfil = 6 μm for PS1 (katr = 0.3 pN/μm, ratr = 0.1 μm). (A) Snapshots of simulations. Left: sphere with Rconf = 2 μm. Right: oblate ellipsoid with same volume as sphere, semi-major axis 2.54 μm and semi-minor axis 1.24 μm. (B) Normalized distribution of angle between the average binormal vector shown in panel A and the x axis, for sphere (black, 17 runs) and ellipsoids (color, 7 runs each). Black line shows normalized sin function and inset labels indicate length of minor axis. (C) Snapshots of simulation for prolate ellipsoids with same volume as sphere in panel A. Top: semi-major axis 2.45 μm and semi-minor axis 1.8 μm. Bottom: semi-major axis 3.2 μm and semi-minor axis 1.57 μm. (D) Probability of ring formation for the two prolate ellipsoid geometries in panel C. A ring is formed in all simulations with spheres and oblate ellipsoids in panels A and B.
Figure 11:
Figure 11:
Simulations with surface attraction enhancing ring formation. (A) Snapshots of simulation at 1500 s for Rconf = 2.5 μm and Cactin = 5 μM with filaments reaching lfil = 20 μm, katr = 3.0pN/μm, and ratr = 0.1μm in the absence and presence of surface attraction. (B) Probability of ring or ring-like structure formation with and without surface attraction, out of 15 runs for each case. The difference is statistically significant (p = 0.035, Fisher’s exact test). Snapshots for all runs shown in Fig. S7

References

    1. Balasubramanian MK, Srinivasan R, Huang Y, and Ng K-H (2012). Comparing contractile apparatus-driven cytokinesis mechanisms across kingdoms. Cytoskeleton, 69(11):942–956. - PubMed
    1. Bathe M, Heussinger C, Claessens MMAE, Bausch AR, and Frey E (2008). Cytoskeletal bundle mechanics. Biophys J, 94(8):2955–2964. - PMC - PubMed
    1. Bidone TC, Tang H, and Vavylonis D (2014). Dynamic network morphology and tension buildup in a 3d model of cytokinetic ring assembly. Biophysical Journal, 107(11):2618–2628. - PMC - PubMed
    1. Broedersz CP and MacKintosh FC (2014). Modeling semiflexible polymer networks. Reviews of Modern Physics, 86(3):995.
    1. Claessens MMAE, Bathe M, Frey E, and Bausch AR (2006a). Actin-binding proteins sensitively mediate f-actin bundle stiffness. Nat Mater, 5(9):748–753. - PubMed

Publication types

LinkOut - more resources