

Categorization in the Perception of Breathy Voice Quality and Its Relation to Voice Production in Healthy Speakers
- PMID: 31525305
- PMCID: PMC7201331
- DOI: 10.1044/2019_JSLHR-S-19-0048
Categorization in the Perception of Breathy Voice Quality and Its Relation to Voice Production in Healthy Speakers
Abstract
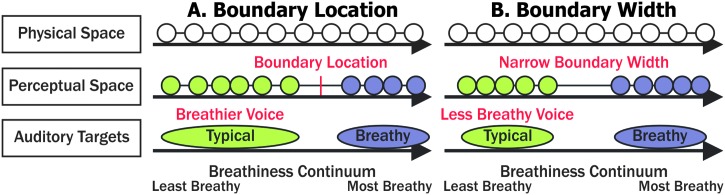
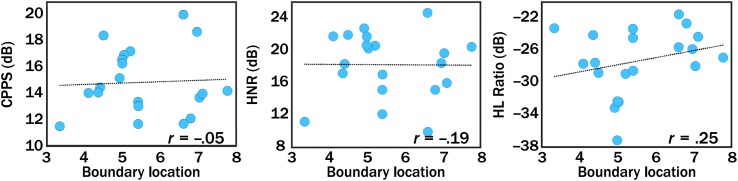
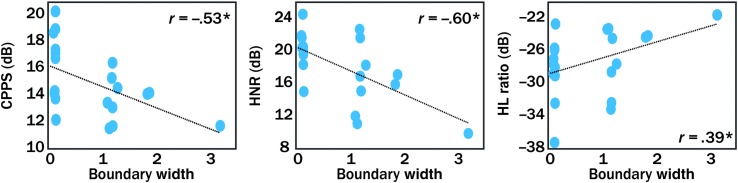
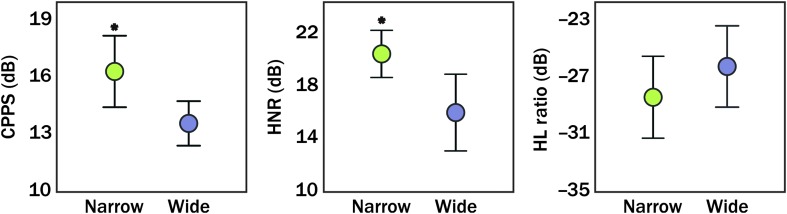
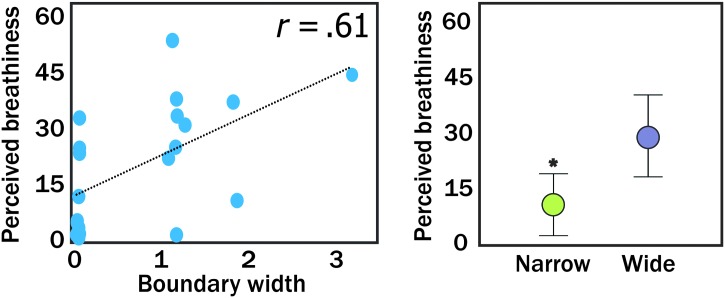
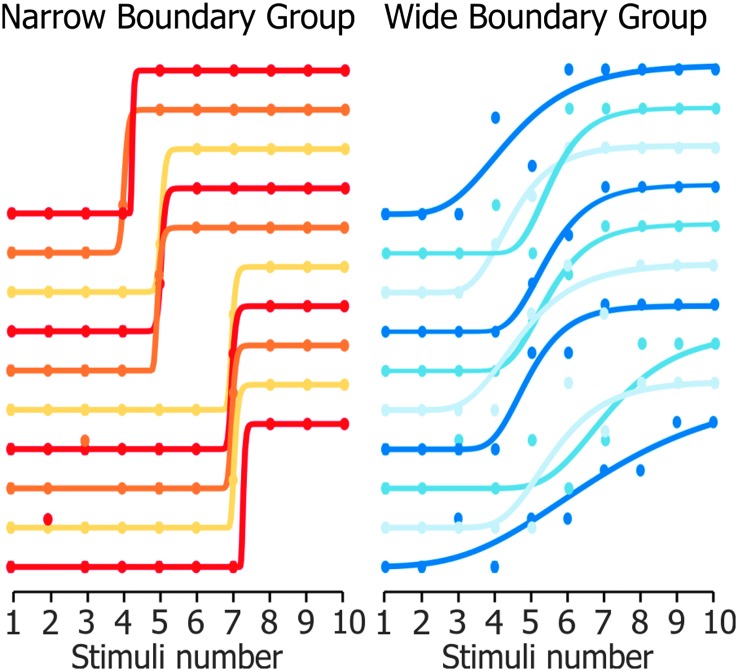
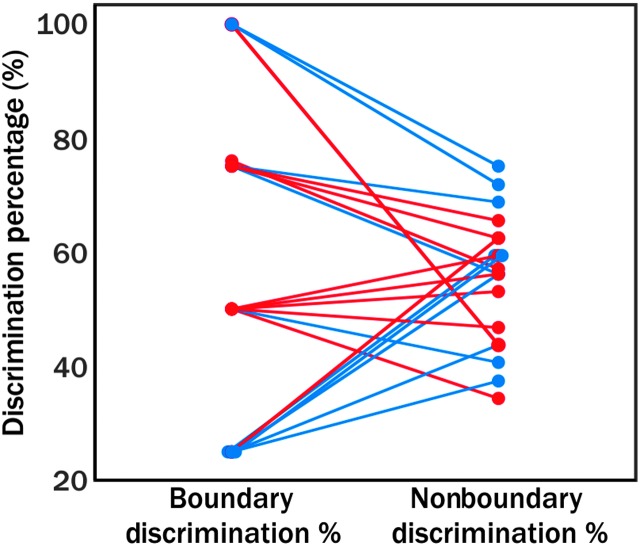
Purpose Previous studies of speech articulation have shown that individuals who can perceive smaller differences between similar-sounding phonemes showed larger contrasts in their productions of those phonemes. Here, a similar relationship was examined between the perception and production of breathy voice quality. Method Twenty females with healthy voices were recruited to participate in both a voice production and a perception experiment. Each participant produced repetitions of a sustained vowel, and acoustic correlates of breathiness were calculated. Identification and discrimination tasks were performed with a series of synthetic stimuli along a breathiness continuum. Categorical boundary location and boundary width were obtained from the identification task as a measurement of perception of breathiness. Spearman's correlation analysis was performed to estimate associations between values of boundary location and width and the acoustic correlates of breathiness from the participants' voices. Results Significant correlations between boundary width (r = -.53 to -.6) and some acoustic correlates were found, but no significant relationships were observed between boundary location and the acoustic correlates. Conclusions Speakers with small boundary widths, which suggest higher perceptual precision in differentiating breathiness, had typical voices that were less breathy, as estimated with acoustic measures, compared to speakers with large boundary widths. Our findings may support a link between perception and production of breathy voice quality. Supplemental Material https://doi.org/10.23641/asha.9808478.
Figures
References
-
- American Speech-Language-Hearing Association. (2002). Consensus Auditory–Perceptual Evaluation of Voice (CAPE-V): ASHA Special Interest Division 3, Voice and Voice Disorders. Retrieved from https://www.asha.org/uploadedFiles/members/divs/D3CAPEVprocedures.pdf
-
- American Speech-Language-Hearing Association. (2005). Guidelines for manual pure-tone threshold audiometry [Guidelines]. Retrieved from http://www.asha.org/policy
-
- Arai T. (2006). Cue parsing between nasality and breathiness in speech perception. Acoustical Science and Technology, 27, 298–301.
-
- Belafsky P. C., Postma G. N., & Koufman J. A. (2002). Validity and reliability of the Reflux Symptom Index (RSI). Journal of Voice, 16(2), 274–277. - PubMed
-
- Best C. T., & Strange W. (1992). Effects of phonological and phonetic factors on cross-language perception of approximants. Journal of Phonetics, 20(3), 305–330.
Publication types
MeSH terms
Grants and funding
LinkOut - more resources
Full Text Sources
