Degronomics: Mapping the Interacting Peptidome of a Ubiquitin Ligase Using an Integrative Mass Spectrometry Strategy
- PMID: 31525912
- PMCID: PMC6959985
- DOI: 10.1021/acs.analchem.9b02331
Degronomics: Mapping the Interacting Peptidome of a Ubiquitin Ligase Using an Integrative Mass Spectrometry Strategy
Abstract
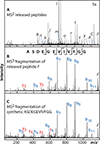
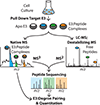
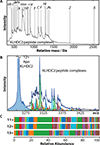
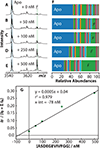
Human cells make use of hundreds of unique ubiquitin E3 ligases to ensure proteome fidelity and control cellular functions by promoting protein degradation. These processes require exquisite selectivity, but the individual roles of most E3s remain poorly characterized in part due to the challenges associated with identifying, quantifying, and validating substrates for each E3. We report an integrative mass spectrometry (MS) strategy for characterizing protein fragments that interact with KLHDC2, a human E3 that recognizes the extreme C-terminus of substrates. Using a combination of native MS, native top-down MS, MS of destabilized samples, and liquid chromatography MS, we identified and quantified a near complete fraction of the KLHDC2-binding peptidome in E. coli cells. This degronome includes peptides that originate from a variety of proteins. Although all identified protein fragments are terminated by diglycine or glycylalanine, the preceding amino acids are diverse. These results significantly expand our understanding of the sequences that can be recognized by KLHDC2, which provides insight into the potential substrates of this E3 in humans. We anticipate that this integrative MS strategy could be leveraged more broadly to characterize the degronomes of other E3 ligase substrate receptors, including those that adhere to the more common N-end rule for substrate recognition. Therefore, this work advances "degronomics," i.e., identifying, quantifying, and validating functional E3:peptide interactions in order to determine the individual roles of each E3.
Conflict of interest statement
Conflicts of Interest
The authors declare no competing financial interest.
Figures


Similar articles
-
Co-opting the E3 ligase KLHDC2 for targeted protein degradation by small molecules.Nat Struct Mol Biol. 2024 Feb;31(2):311-322. doi: 10.1038/s41594-023-01146-w. Epub 2024 Jan 4. Nat Struct Mol Biol. 2024. PMID: 38177675
-
Recognition of the Diglycine C-End Degron by CRL2KLHDC2 Ubiquitin Ligase.Mol Cell. 2018 Dec 6;72(5):813-822.e4. doi: 10.1016/j.molcel.2018.10.021. Mol Cell. 2018. PMID: 30526872 Free PMC article.
-
Isolation, characterization, and partial purification of a novel ubiquitin-protein ligase, E3. Targeting of protein substrates via multiple and distinct recognition signals and conjugating enzymes.J Biol Chem. 1996 Jan 5;271(1):302-10. doi: 10.1074/jbc.271.1.302. J Biol Chem. 1996. PMID: 8550577
-
How the ends signal the end: Regulation by E3 ubiquitin ligases recognizing protein termini.Mol Cell. 2022 Apr 21;82(8):1424-1438. doi: 10.1016/j.molcel.2022.02.004. Epub 2022 Mar 4. Mol Cell. 2022. PMID: 35247307 Free PMC article. Review.
-
Characterizing ubiquitination sites by peptide-based immunoaffinity enrichment.Mol Cell Proteomics. 2012 Dec;11(12):1529-40. doi: 10.1074/mcp.R112.019117. Epub 2012 Jun 23. Mol Cell Proteomics. 2012. PMID: 22729469 Free PMC article. Review.
Cited by
-
Co-opting the E3 ligase KLHDC2 for targeted protein degradation by small molecules.Nat Struct Mol Biol. 2024 Feb;31(2):311-322. doi: 10.1038/s41594-023-01146-w. Epub 2024 Jan 4. Nat Struct Mol Biol. 2024. PMID: 38177675
-
High-Throughput Discovery of Substrate Peptide Sequences for E3 Ubiquitin Ligases Using a cDNA Display Method.Chembiochem. 2024 Dec 16;25(24):e202400617. doi: 10.1002/cbic.202400617. Epub 2024 Nov 25. Chembiochem. 2024. PMID: 39512024 Free PMC article.
-
Higher-order structural characterisation of native proteins and complexes by top-down mass spectrometry.Chem Sci. 2020 Oct 20;11(48):12918-12936. doi: 10.1039/d0sc04392c. Chem Sci. 2020. PMID: 34094482 Free PMC article. Review.
-
Dissecting the structural heterogeneity of proteins by native mass spectrometry.Protein Sci. 2023 Apr;32(4):e4612. doi: 10.1002/pro.4612. Protein Sci. 2023. PMID: 36851867 Free PMC article. Review.
-
An artificial intelligence accelerated virtual screening platform for drug discovery.Nat Commun. 2024 Sep 5;15(1):7761. doi: 10.1038/s41467-024-52061-7. Nat Commun. 2024. PMID: 39237523 Free PMC article.
References
Publication types
MeSH terms
Substances
Grants and funding
LinkOut - more resources
Full Text Sources

