

Methods, availability, and applications of PM2.5 exposure estimates derived from ground measurements, satellite, and atmospheric models
- PMID: 31526242
- PMCID: PMC7072999
- DOI: 10.1080/10962247.2019.1668498
Methods, availability, and applications of PM2.5 exposure estimates derived from ground measurements, satellite, and atmospheric models
Abstract
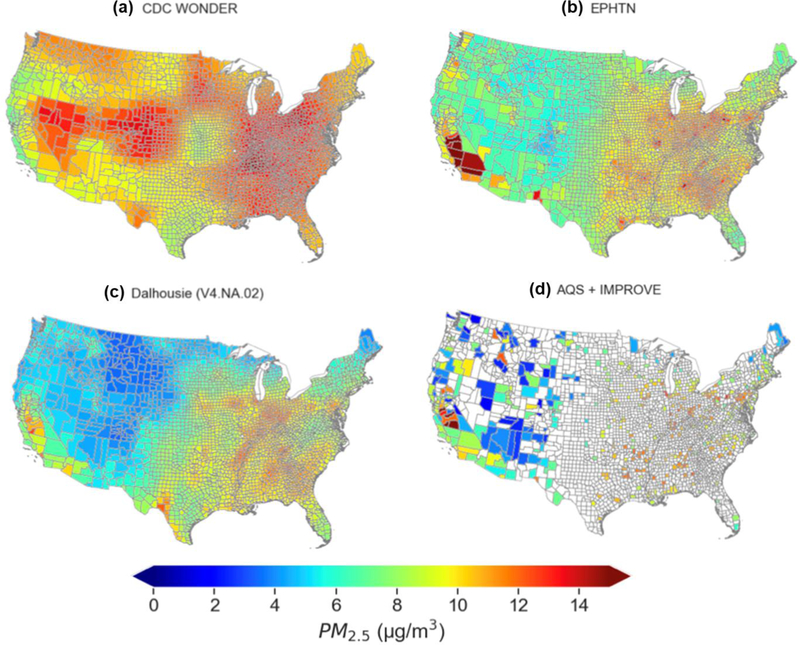
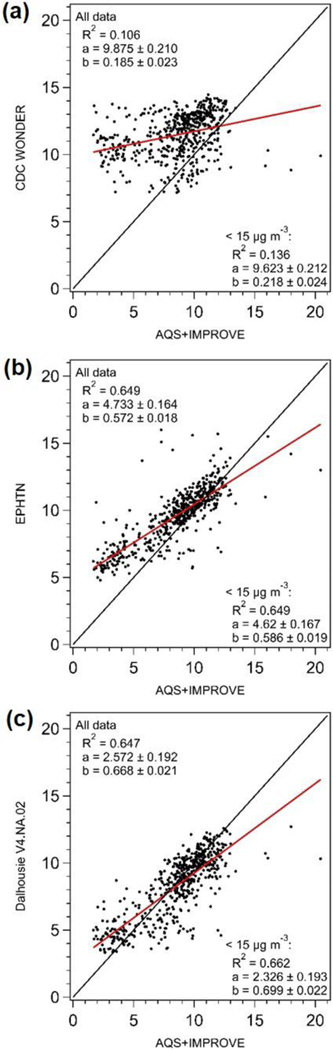
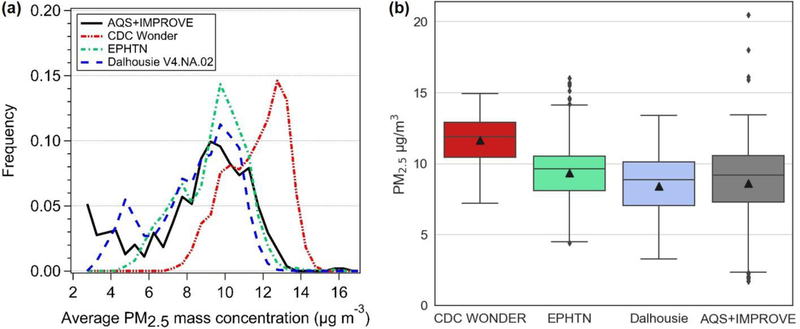
Fine particulate matter (PM2.5) is a well-established risk factor for public health. To support both health risk assessment and epidemiological studies, data are needed on spatial and temporal patterns of PM2.5 exposures. This review article surveys publicly available exposure datasets for surface PM2.5 mass concentrations over the contiguous U.S., summarizes their applications and limitations, and provides suggestions on future research needs. The complex landscape of satellite instruments, model capabilities, monitor networks, and data synthesis methods offers opportunities for research development, but would benefit from guidance for new users. Guidance is provided to access publicly available PM2.5 datasets, to explain and compare different approaches for dataset generation, and to identify sources of uncertainties associated with various types of datasets. Three main sources used to create PM2.5 exposure data are ground-based measurements (especially regulatory monitoring), satellite retrievals (especially aerosol optical depth, AOD), and atmospheric chemistry models. We find inconsistencies among several publicly available PM2.5 estimates, highlighting uncertainties in the exposure datasets that are often overlooked in health effects analyses. Major differences among PM2.5 estimates emerge from the choice of data (ground-based, satellite, and/or model), the spatiotemporal resolutions, and the algorithms used to fuse data sources.Implications: Fine particulate matter (PM2.5) has large impacts on human morbidity and mortality. Even though the methods for generating the PM2.5 exposure estimates have been significantly improved in recent years, there is a lack of review articles that document PM2.5 exposure datasets that are publicly available and easily accessible by the health and air quality communities. In this article, we discuss the main methods that generate PM2.5 data, compare several publicly available datasets, and show the applications of various data fusion approaches. Guidance to access and critique these datasets are provided for stakeholders in public health sectors.
Figures
References
-
- Ahangar FE, Freedman FR, and Venkatram A. 2019. Using Low-Cost Air Quality Sensor Networks to Improve the Spatial and Temporal Resolution of Concentration Maps. Int. J. Environ. Res. Public Health 16 (7). Multidisciplinary Digital Publishing Institute (MDPI). doi:10.3390/ijerph16071252. - DOI - PMC - PubMed
-
- Al-Hamdan AZ, Albashaireh RN, Al-Hamdan MZ, and Crosson WL. 2017. The Association of Remotely Sensed Outdoor Fine Particulate Matter with Cancer Incidence of Respiratory System in the USA. J. Environ. Sci. Heal Part A 52 (6). Taylor & Francis: 547–554. doi:10.1080/10934529.2017.1284432. - DOI - PubMed
-
- Al-Hamdan AZ, Preetha PP, Al-Hamdan MZ, Crosson WL, and Albashaireh RN. 2018a. Reconnoitering the Linkage between Cardiovascular Disease Mortality and Long-Term Exposures to Outdoor Environmental Factors in the USA Using Remotely-Sensed Data. J. Environ. Sci. Heal Part A, March Taylor & Francis, 1–10. doi:10.1080/10934529.2018.1445083. - DOI - PubMed
-
- Al-Hamdan AZ, Preetha PP, Albashaireh RN, Al-Hamdan MZ, and Crosson WL. 2018b. Investigating the Effects of Environmental Factors on Autism Spectrum Disorder in the USA Using Remotely Sensed Data. Environ. Sci. Pollut. Res 25 (8). Springer Berlin Heidelberg: 7924–7936. doi:10.1007/s11356-017-1114-8. - DOI - PubMed
-
- Al-Hamdan MZ, Crosson WL, Economou SA, Estes MG, Estes SM, Hemmings SN, Kent ST, Puckett M., Quattrochi DA, Rickman DL, Wade GM, and McClure LA 2014. Environmental public health applications using remotely sensed data. Geocarto Int 29 (1) NIH Public Access: 85–98. doi: 10.1080/10106049.2012.715209 - DOI - PMC - PubMed
Publication types
MeSH terms
Substances
Grants and funding
LinkOut - more resources
Full Text Sources
Medical