. 2019 Sep 16;36(3):319-336.e7.
doi: 10.1016/j.ccell.2019.08.003.

Epithelial NOTCH Signaling Rewires the Tumor Microenvironment of Colorectal Cancer to Drive Poor-Prognosis Subtypes and Metastasis

Affiliations

Epithelial NOTCH Signaling Rewires the Tumor Microenvironment of Colorectal Cancer to Drive Poor-Prognosis Subtypes and Metastasis

Rene Jackstadt et al. Cancer Cell. .

Abstract

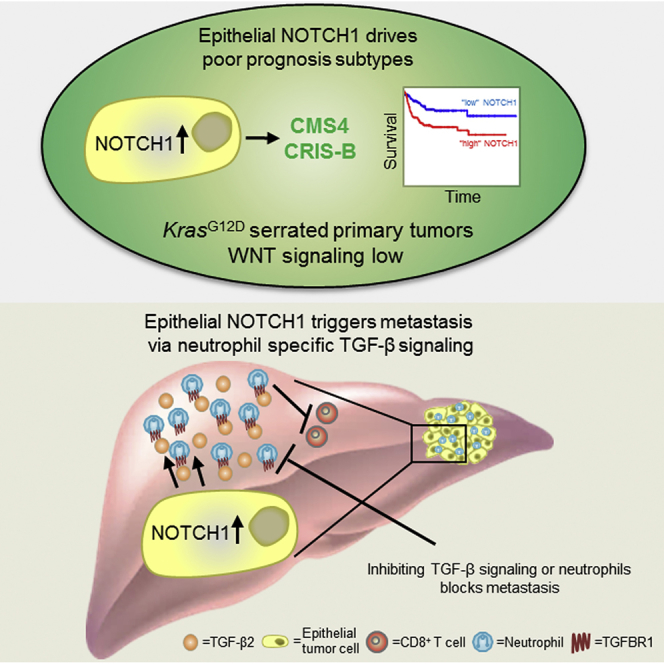
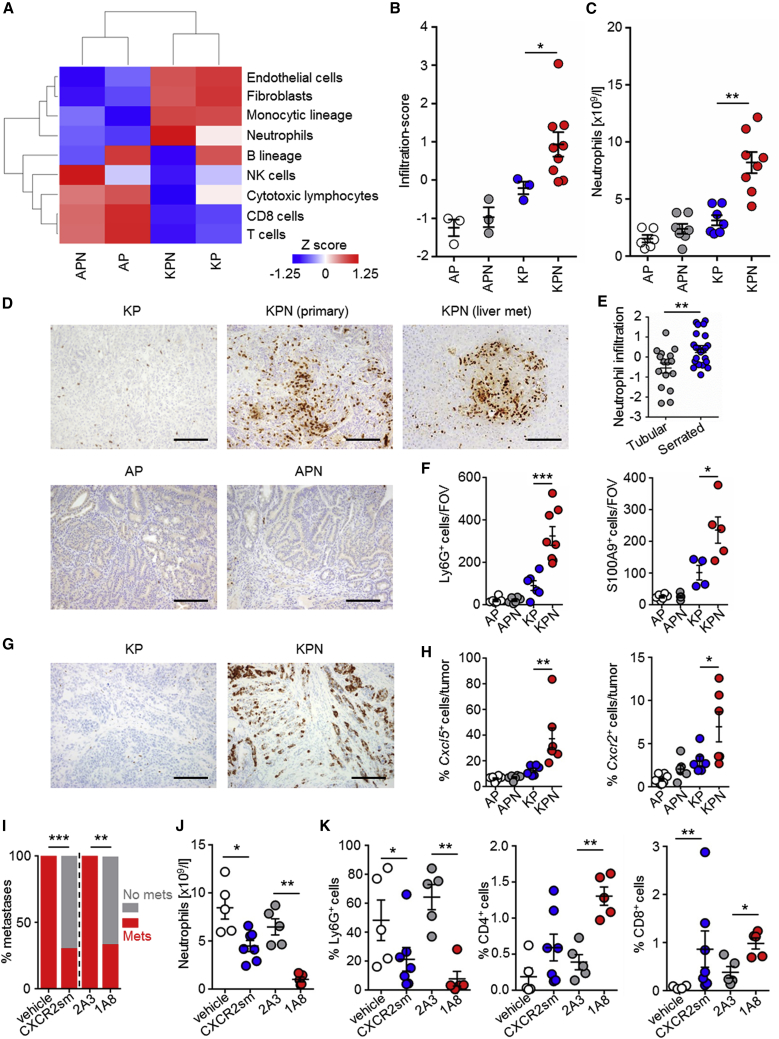
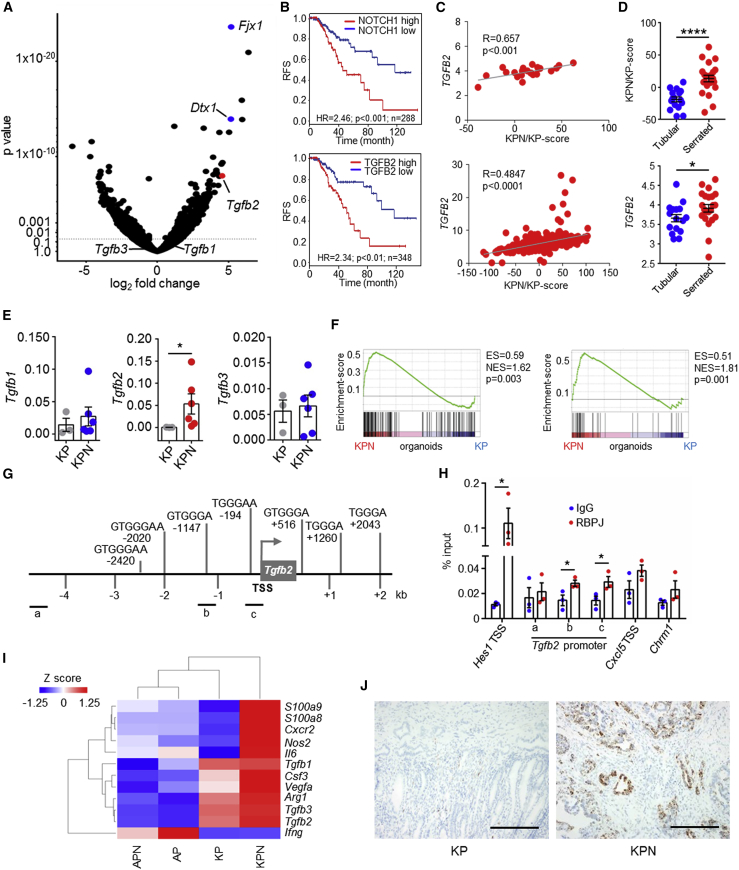
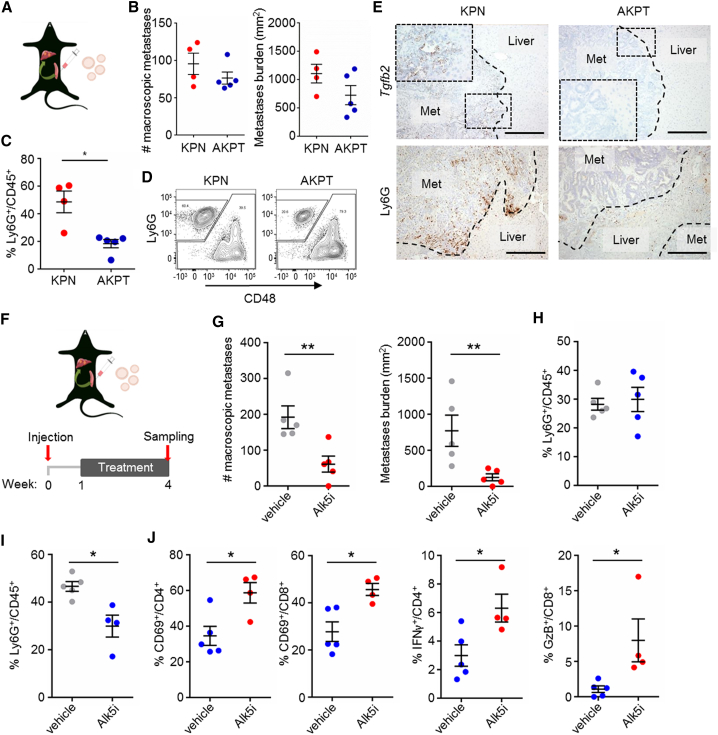
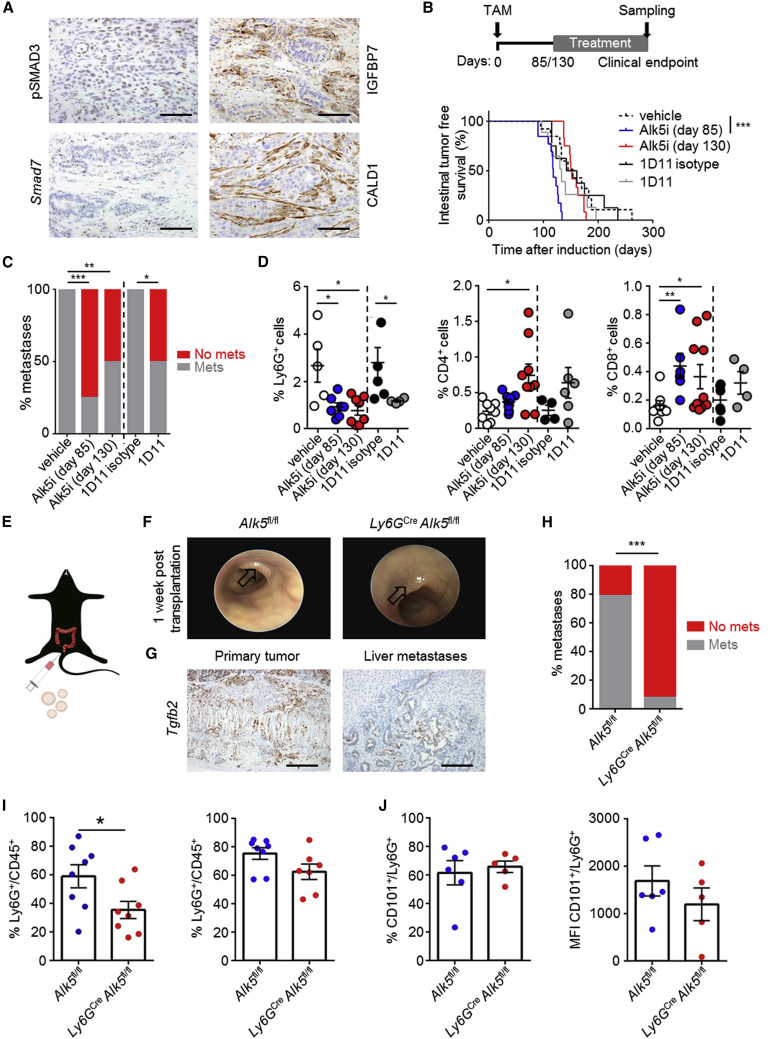
The metastatic process of colorectal cancer (CRC) is not fully understood and effective therapies are lacking. We show that activation of NOTCH1 signaling in the murine intestinal epithelium leads to highly penetrant metastasis (100% metastasis; with >80% liver metastases) in KrasG12D-driven serrated cancer. Transcriptional profiling reveals that epithelial NOTCH1 signaling creates a tumor microenvironment (TME) reminiscent of poorly prognostic human CRC subtypes (CMS4 and CRIS-B), and drives metastasis through transforming growth factor (TGF) β-dependent neutrophil recruitment. Importantly, inhibition of this recruitment with clinically relevant therapeutic agents blocks metastasis. We propose that NOTCH1 signaling is key to CRC progression and should be exploited clinically.

Keywords: CRC intrinsic subtypes (CRIS); NOTCH1; TGF-β; colorectal cancer (CRC); consensus molecular subtype (CMS); metastasis; molecular subtyping; neutrophils; serrated CRC; tumor microenviroment (TME).


Conflict of interest statement

Simon T. Barry is an employee and shareholder of AstraZeneca.

Figures

None
Graphical abstract
Figure 1
Figure 1
NOTCH1 Drives Intestinal Metastasis in an Autochthonous Model (A) Schematic description of genetic crossing strategies. Cre, cre-recombinase; ER, estrogen receptor; loxP, Cre-Lox recombination site; IRES, internal ribosome entry site. (B) Kaplan-Meier survival curves of intestinal tumor free survival; PN, n = 21; AP, n = 10; APN, n = 12; KP, n = 15; KPN, n = 31. (C) Incidence of metastases (%) per genotype; PN, n = 21; AP, n = 10; APN, n = 12; KP, n = 14; KPN, n = 29. DIA, diaphragm; LN, lymph-node; Peri, peritoneal carcinomatosis. (D and E) Number (D) and burden (E) of macroscopic metastases of KPN mice. Error bars represent mean ± SEM. (F) Left image: representative image of macroscopic liver metastatic burden of KPN mice. Right images: representative H&Es of KPN metastases. Scale bars, 100 μm. See also Figures S1 and S2.
Figure 2
Figure 2
Morphological Analysis of Primary Tumors (A) Representative H&E images of primary tumors. Scale bars, 100 μm. Arrows indicate serrated morphology. (B) Representative images of indicated markers on primary tumors. Scale bars, 100 μm. (C and D) Tumor stage (C) and differentiation at endpoint (D). (E) Macroscopic primary tumors per mouse. (F) Macroscopic primary tumor burden per mouse. In (C–F): AP, n = 10; APN, n ≥ 11; KP, n = 14; KPN, n ≥ 22. Error bars in (E and F) represent mean ± SEM. See also Figure S3.
Figure 3
Figure 3
Role of WNT Signaling in Metastatic KPN Tumors (A) Expression of WNT targets in human tubular or serrated adenoma. (B) Heatmap of a human serrated signature versus mouse primary tumor signatures. (C) β-Catenin IHC of primary tumors. M, metastases; L, liver; PT, primary tumor. Scale bars, 100 μm. Right bottom: quantification of nuclear β-catenin in primary tumors (n ≥ 10). (D) Quantification of in situ hybridization (ISH) for positive cells on primary tumors (APN, n ≥ 5; KPN, n ≥ 7). (E) Schematic representation of LGK974 treatments started 85 days after induction. (F) Kaplan-Meier survival curves of KPN mice after treatment as indicated in (E). (G) Incidence of metastases per treatment; in (F) and (G): vehicle, n = 7; LGK974, n = 8. (H) Representative pictures of organoid cultures. R, R-spondin; E, EGF; N, Noggin. Scale bars, 100 μm. (I) Organoid size or number 7 days after single-cell seeding under the indicated conditions. Samples were generated from individual tumors, n = 3. (J) Organoid size or number 7 days after single-cell seeding under the indicated conditions. Samples were generated from individual tumors, n = 4. (K) Analysis of the consequences of somatic mutations identified by whole-genome sequencing of KPN primary tumor-derived organoids. Error bars in (A), (D), (I), and (J) represent mean ±SEM. Data in (A) and (D) analyzed by Mann-Whitney U test, two-tailed. See also Figures S3 and S4 and Tables S1 and S2.
Figure 4
Figure 4
Cross-Comparison and Subtyping of GEMMs to Human CRC (A) Recurrence-free survival (RFS) of CRC patients stratified using a KPN versus APN tumor signature, for patients of all four CMSs. (B) RFS of CRC patients stratified using a KPN versus APN organoid signature, for patients of all four CMSs. In (A) and (B), the blue line shows correlation ≤0.1 (low), the red line shows correlation >0.1 (high). (C) Heatmap showing expression correlation of intestinal cancer GEMMs with patient-derived CMSs. p value for CMS4-KPN versus CMS4-KP correlation (p = 0.003) was obtained using a Fisher r-z transformation. (D) Heatmap showing expression correlation of intestinal cancer GEMMs with patient-derived CRISs. (E) GSEA results for GEMMs and CMS1-4 CRC patient tumors. Replicates in (A–E), AP (tumors), n = 3; APN (tumors), n = 3; APN (organoids), n = 4; KP (tumors), n = 3; KPN (tumors), n = 9; KPN (organoids), n = 3. See also Figures S3 and S4 and Tables S3, S4, and S5.
Figure 5
Figure 5
Epithelial NOTCH1 Controls Neutrophil Recruitment to Drive Metastasis (A) Heatmap showing standardized infiltration-scores (calculated with MCPcounter) in GEMM tumors; AP, n = 3; APN, n = 3; KP, n = 3; KPN, n = 9. (B) Dot-plots showing standardized infiltration scores of neutrophils (calculated with MCPcounter); replicates as in (A). (C) Blood neutrophil count at endpoint of indicated genotype (n ≥ 6). (D) Representative Ly6G IHC. Scale bars, 100 μm. (E) Neutrophil infiltration-score in human adenoma. (F) Quantification of Ly6G+ and S100A9+ cells per field of view (FOV); AP, n = 6; APN, n ≥ 5; KP, n ≥ 4; KPN, n ≥ 5. (G) Representative ISH of Cxcl5 expression. Scale bars, 100 μm. (H) Quantification of Cxcl5+ and Cxcr2+ cells; AP, n = 8; APN, n = 6; KP, n = 6; KPN, n ≥ 6. (I) Incidence of metastases at endpoint for KPN mice treated with: vehicle, n = 11; CXCR2sm, n = 10; 2A3, n = 10; 1A8, n = 9; analyzed by chi-square test, two-tailed. (J) Blood neutrophil count after 1 week of indicated treatments: vehicle, n = 5; CXCR2sm, n = 7; 2A3, n = 5; 1A8, n = 5; analyzed by Mann-Whitney U test, one-tailed. (K) Quantification of IHC on primary tumors of KPN mice after 1 week of indicated treatments: vehicle, n ≥ 4; CXCR2sm, n = 7; 2A3, n = 5; 1A8, n = 5. Error bars in (B), (C), (E), (F), (H), (J), and (K) represent mean ± SEM. Data in (B), (C), (E), (F), (H), and (K) analyzed by Mann-Whitney U test, two-tailed. See also Figures S5 and S6 and Tables S1 and S6.
Figure 6
Figure 6
Epithelial NOTCH1 Drives Poor Prognosis Signatures and TGF-β2 Expression (A) Volcano-plot of organoid KPN (n = 3) versus KP (n = 3) mRNA expression. (B) RFS of CRC patients (TCGA), stratified using the KPN/KP-score as in (A) or TGFB2 expression. The blue line shows expression ≤ median score (low), the red line shows expression > median score (high). (C) Correlation of the KPN/KP-score and TGFB2 expression in human serrated adenoma (top) or in TCGA data (bottom), p values were calculated by Pearson correlation. (D) KPN/KP-score or expression of TGFB2 in human adenoma. (E) qPCR from KP or KPN organoids (n ≥ 3); normalized to Actb. (F) GSEA plots of TGF-β activation (left, GSE15871; right, GSE39397) in KP versus KPN organoids. ES, enrichment score; NES, normalized enrichment score. (G) Schematic representation of RBPJ binding sites at the mouse Tgfb2 promoter. TSS, transcription start site. (H) Chromatin immunoprecipitation of RBPJ and IgG control in KPN organoids; n = 3 biological replicates of technical duplicates, analyzed by Student’s t test, two-tailed. (I) Heatmap of marker expression across primary tumors. (J) Representative images of Tgfb2 ISH in primary tumors. Scale bars, 100 μm. Error bars in (D), (E), and (H) represent mean ± SEM. Data in (D) and (E) analyzed by Mann-Whitney U test, two-tailed. See also Figure S7 and Tables S7 and S8.
Figure 7
Figure 7
TGF-β or CXCR2 Inhibition Attenuates KPN Metastasis via T Cell Activation (A) Cartoon illustrating organoid isograft transplantation in the spleen. (B) Quantification of macroscopic liver metastases 4 weeks post-transplantation; KPN, n = 4; AKPT, n = 5. (C) Quantification of neutrophils in liver metastases by flow cytometry as in (B). (D) Representative contour plots of the analysis performed in (C). (E) Representative images for ISH analysis of Tgfb2 expression or IHC for Ly6G on liver metastases (n ≥ 3). Scale bars, 100 μm. (F) Schematic representation of the treatment regimen after organoid transplantation. (G) Number and burden of macroscopic liver metastases 4 weeks post-KPN organoid transplantation; vehicle, n = 5; Alk5i, n = 5. (H and I) Quantification of flow cytometry analysis for neutrophils in blood (H) or liver metastases 4 weeks post-KPN organoid transplantation (I); vehicle, n = 5; Alk5i, n ≥ 4. (J) Quantification of flow cytometry analysis for T cell subsets in liver metastases 4 weeks post-KPN organoid transplantation; vehicle, n = 5; Alk5i, n = 4. Error bars in (B), (C), (G), (H), (I), and (J) represent mean ± SEM. Data in (C), (G), (I), and (J) analyzed by Mann-Whitney U test, two-tailed. See also Figure S7.
Figure 8
Figure 8
Inhibition of Neutrophilic TGF-β Signaling Attenuates Metastasis (A) Representative images of indicated markers on KPN primary tumors. Scale bars, 100 μm. (B) Schematic representation of treatment regime and Kaplan-Meier survival curves of KPN mice treated with: vehicle day 85, n = 13; Alk5i day 85, n = 13; Alk5i day 130, n = 12; 1D11 isotype day 85, n = 8; 1D11 day 85, n = 9; analyzed by log rank (Mantel-Cox) test. (C) Incidence of metastasis per indicated treatments: vehicle day 85, n = 11; Alk5i day 85, n = 12; Alk5i day 130, n = 12; 1D11 isotype day 85, n = 8; 1D11 day 85, n = 8. Analyzed by chi-square test, two-tailed. (D) Quantification of IHC for Ly6G+, CD4+, and CD8+ cells per KPN liver at endpoint (n ≥ 4). (E) Cartoon illustrating intra-colonic transplantation of KPN organoids. (F) Representative colonoscopy images 1 week post-transplantation. Arrows indicate tumors. (G) Representative ISH on transplanted KPN organoids. Scale bars, 100 μm. (H) Incidence of metastases at endpoint; Alk5fl/fl, n = 14; Ly6GCreAlk5fl/fl, n = 13. Analyzed by chi-square test, two-tailed. (I) Flow cytometry analysis of neutrophils in primary tumors (left) and peripheral blood (right); Alk5fl/fl, n = 8; Ly6GCreAlk5fl/fl, n ≥ 7. (J) Flow cytometry analysis of CD101+ neutrophils in primary tumors; Alk5fl/fl, n = 6; Ly6GCreAlk5fl/fl, n = 5; MFI, mean fluorescence intensity. Error bars in (D), (I), and (J) represent mean ± SEM, analyzed by Mann-Whitney U test, two-tailed. See also Figure S8 and Table S1.

Comment in

References

    1. Anders S., Huber W. Differential expression analysis for sequence count data. Genome Biol. 2010;11:R106. - PMC - PubMed
    1. Andersson E.R., Lendahl U. Therapeutic modulation of Notch signalling–are we there yet? Nat. Rev. Drug Discov. 2014;13:357–378. - PubMed
    1. Anderton M.J., Mellor H.R., Bell A., Sadler C., Pass M., Powell S., Steele S.J., Roberts R.R., Heier A. Induction of heart valve lesions by small-molecule ALK5 inhibitors. Toxicol. Pathol. 2011;39:916–924. - PubMed
    1. Arcaroli J.J., Tai W.M., McWilliams R., Bagby S., Blatchford P.J., Varella-Garcia M., Purkey A., Quackenbush K.S., Song E.K., Pitts T.M. A NOTCH1 gene copy number gain is a prognostic indicator of worse survival and a predictive biomarker to a Notch1 targeting antibody in colorectal cancer. Int. J. Cancer. 2016;138:195–205. - PMC - PubMed
    1. Babaei-Jadidi R., Li N., Saadeddin A., Spencer-Dene B., Jandke A., Muhammad B., Ibrahim E.E., Muraleedharan R., Abuzinadah M., Davis H. FBXW7 influences murine intestinal homeostasis and cancer, targeting Notch, Jun, and DEK for degradation. J. Exp. Med. 2011;208:295–312. - PMC - PubMed

Publication types

MeSH terms