. 2019 Oct 15;476(19):2797-2813.
doi: 10.1042/BCJ20190315.

Centrosomal cohesion deficits as cellular biomarker in lymphoblastoid cell lines from LRRK2 Parkinson's disease patients

Affiliations

Centrosomal cohesion deficits as cellular biomarker in lymphoblastoid cell lines from LRRK2 Parkinson's disease patients

Belén Fernández et al. Biochem J. .

Abstract

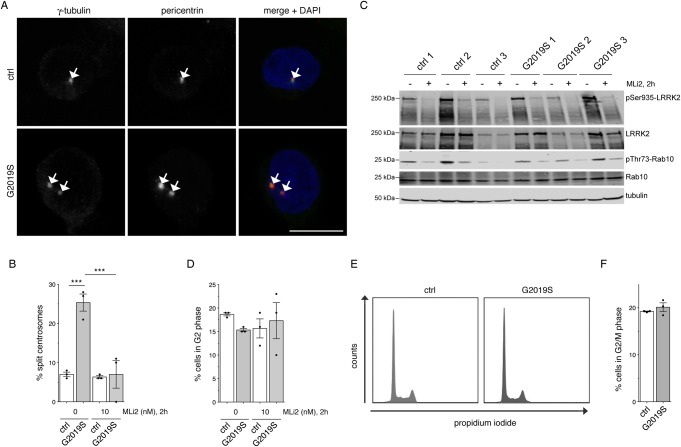
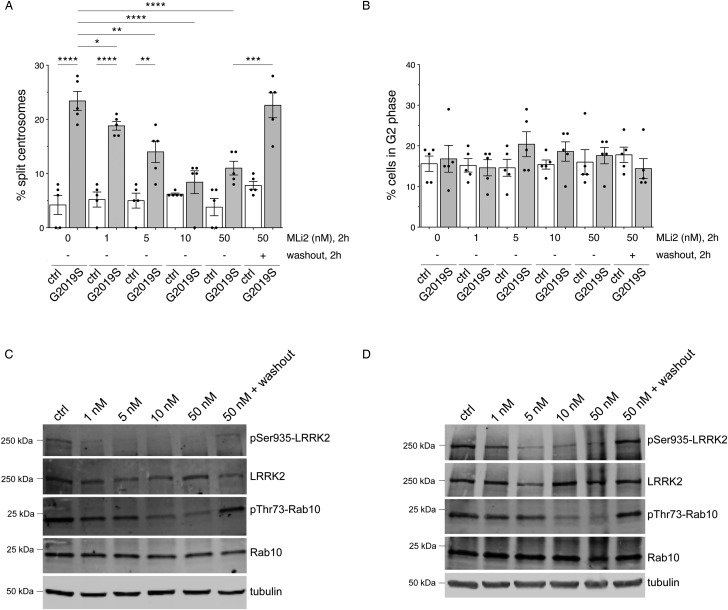
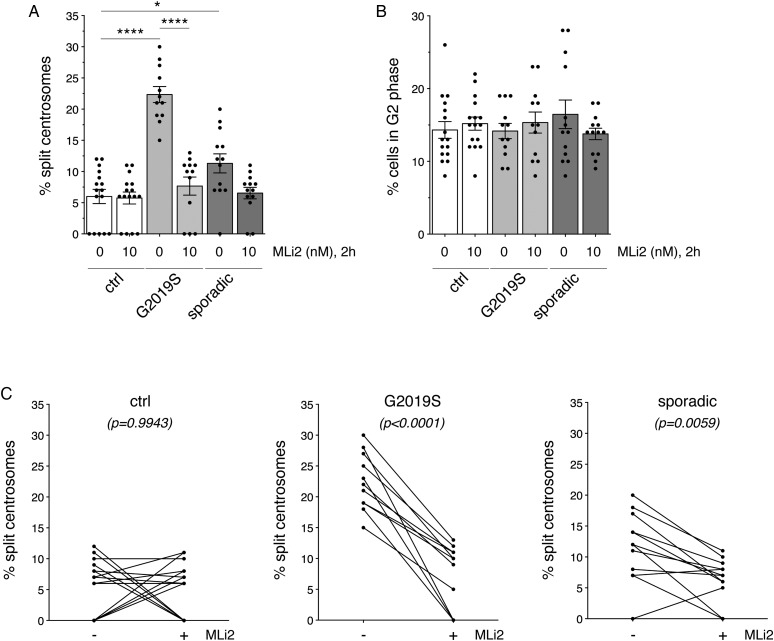
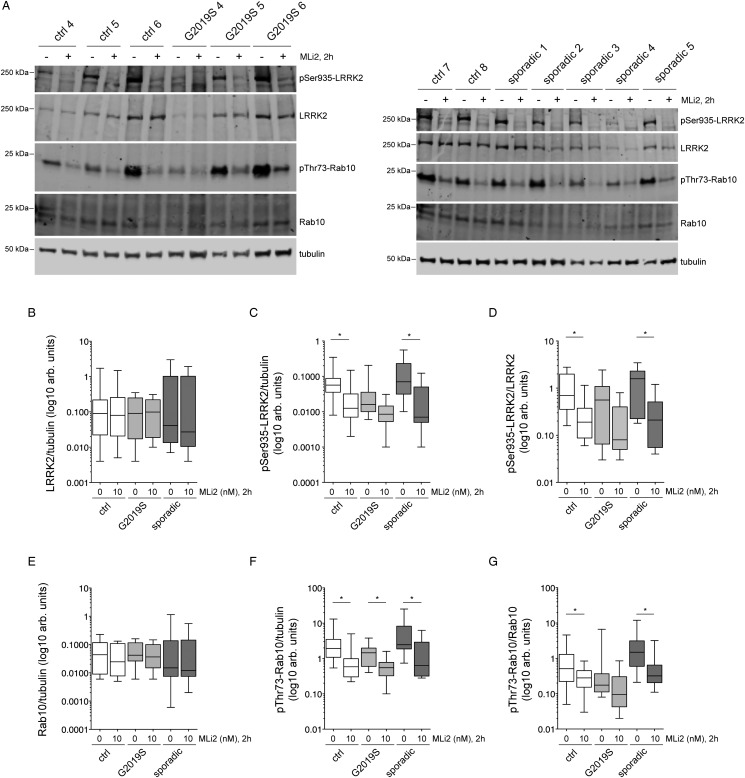
Leucine-rich repeat kinase 2 (LRRK2) is a promising therapeutic target for the treatment of Parkinson's disease (PD), and orally bioavailable, brain penetrant and highly potent LRRK2 kinase inhibitors are in early stages of clinical testing. Detection of LRRK2 phosphorylation, as well as phosphorylation of Rab10, a LRRK2 kinase substrate, have been proposed as target engagement biomarkers for LRRK2 inhibitor clinical trials. However, these readouts do not seem able to stratify patients based on enhanced LRRK2 kinase activity. Here, we describe a robust cell biological assay based on centrosomal cohesion alterations which were observed in peripheral blood mononuclear cell-derived lymphoblastoid cell lines (LCLs) from patients with G2019S LRRK2 mutations as compared with healthy controls, and could also be detected in a subset of sporadic PD patient samples. We suggest that LCLs may be a valuable resource for LRRK2 research, and that determination of centrosomal cohesion deficits may assist in the stratification of a subset of sporadic PD patients.

Keywords: Rab protein; centrosome cohesion; leucine-rich repeat kinase; protein phosphorylation.


Conflict of interest statement

The Authors declare that there are no competing interests associated with the manuscript.

Figures

Figure 1.
Figure 1.. Monitoring centrosomal cohesion deficits and cell cycle alterations in a subset of healthy control and G2019S LRRK2-PD LCLs.
(A) Example of healthy control (ctrl) or G2019S LRRK2 PD-derived LCLs (G2019S) stained for two centrosomal markers (γ-tubulin and pericentrin) and DAPI. Scale bar, 10 µm. (B) The centrosome phenotype was quantified from 100 cells per line, and from three control and three G2019S LRRK2 LCL lines. Control or G2019S LRRK2 LCLs were treated with MLi2 (10 nM) for 2 h as indicated. Bars represent mean ± s.e.m.; *** P < 0.005 (one-way ANOVA with Tukey's post-hoc test). (C) Cells were incubated either in the presence or absence of 10 nM MLi2 for 2 h as indicated, and extracts analyzed for LRRK2 Ser935, LRRK2, Rab10 Thr73, Rab10, or tubulin as loading control. Membranes were developed using the Odyssey CLx scan Western blot imaging system, and antibodies multiplexed as described in Materials and methods. (D) Quantification of the percentage of cells displaying duplicated centrosomes, a phenotype mainly reflecting cells in G2 phase (% cells in G2 phase). A total of 100 cells per line were quantified from the three control and three G2019S LRRK2 LCL lines in the absence or presence of MLi2 (10 nM) for 2 h as indicated. (E) Example of flow cytometry traces of one control and one G2019S line upon propidium iodide staining as indicated. (F) Quantification of the percentage of cells displaying duplicated DNA content as assessed by propidium iodide staining (% cells in G2/M phase) from three control and three G2019S LRRK2 LCL lines.
Figure 2.
Figure 2.. Dose response and reversibiltiy analysis of centrosomal cohesion deficits and Rab10 phosphorylation in control and G2019S LRRK2 LCLs.
(A) The centrosome phenotype was quantified from five distinct control and five G2019S LRRK2 LCL lines, in either the presence or absence of the indicated concentrations of MLi2 for 2 h. In addition, cells were treated with 50 nM MLi2 for 2 h, followed by incubation in medium without MLi2 for an additional 2 h (washout) before quantification. Bars represent mean ± s.e.m.; * P < 0.05; ** P < 0.01; *** P < 0.005; **** P < 0.001 (one-way ANOVA with Tukey's post-hoc test). (B) Quantification of the percentage of cells displaying duplicated centrosomes, a phenotype mainly reflecting cells in G2 phase, from a total of 100 cells per line, for each of the five control and five G2019S LRRK2 lines. (C) Control LCL was incubated in either the presence or absence of the indicated concentrations of MLi2 for 2 h as indicated, or treated with 50 nM MLi2 for 2 h followed by incubation in medium without inhibitor for an additional 2 h (washout), and extracts analyzed for LRRK2 Ser935, LRRK2, Rab10 Thr73, Rab10 or tubulin as loading control. Membranes were developed using the Odyssey CLx scan Western blot imaging system, and antibodies multiplexed as described in Materials and methods. (D) Same as (C), but performed with G2019S LRRK2 LCL. Similar results were obtained in two independent experiments.
Figure 3.
Figure 3.. Centrosomal cohesion deficits in LCLs from control, G2019S LRRK2-PD and sporadic PD patients.
(A) Centrosomal cohesion deficits were quantified from a total of 16 age- and sex-matched control, 12 G2019S LRRK2-PD and 13 sporadic PD LCLs in either the absence or presence of 10 nM MLi2 for 2 h as indicated. Bars represent mean ± s.e.m.; ** P < 0.01; **** P < 0.001 (one-way ANOVA with Tukey's post-hoc test). (B) Quantification of the percentage of cells displaying duplicated centrosomes from a total of 100 cells per LCL line. (C) Paired t-test analysis of centrosomal cohesion deficits from control, G2019S LRRK2 and sporadic PD LCLs for each cell line in the absence or presence of MLi2 as indicated. Note that differences in the values between 0 and 10% are not significant given the small number of cells displaying a duplicated split centrosome phenotype.
Figure 4.
Figure 4.. Analysis of LRRK2, LRRK2 Ser935, Rab10 and Rab10 Thr73 phosphorylation in LCLs from control, G2019S LRRK2-PD and sporadic PD patients.
(A) Example of three control and three G2019S LRRK2 LCL lines (left), or two distinct control and five sporadic PD LCL lines (right), treated with or without 10 nM MLi2 for 2 h. Cells were subsequently lysed and extracts subjected to quantitative immunoblot analysis with the indicated antibodies, and membranes developed using Odyssey CLx scan Western Blot imaging system. Note that ‘sporadic 2’ and ‘sporadic 4' are two out of the three sporadic PD LCLs which display a centrosomal cohesion deficit. (B) Control, G2019S LRRK2 and sporadic PD LCL extracts were analyzed as described in (A), and immunoblots quantified for full-length LRRK2/tubulin ratio. (C) Immunoblots of the type depticted in (A) were quantified for LRRK2 Ser935/tublin ratio. * P < 0.05. (D) Immunoblots were quantified for LRRK2 Ser935/LRRK2 ratio. * P < 0.05 (E) Immunoblots were quantified for Rab10/tubulin ratio. (F) Immunoblots were quantified for Rab10 Thr73/tubulin ratio. * P < 0.05. (G) Immunoblots were quantified for Rab10 Thr73/Rab10 ratio. * P < 0.05. Statistical analysis was performed with Kruskal–Wallis test with Dunn's multiple comparison. All data are presented as whisker plots.
Figure 5.
Figure 5.. Correlation analysis between levels of LRRK2 or LRRK2 Ser935 and Rab10 Thr73 in LCLs from control, G2019S LRRK2-PD and sporadic PD patients.
(A) Spearman correlation analysis revealed a significant association between LRRK2 levels and Rab10 Thr73 levels in sporadic PD patients. (B) Spearman correlation analysis revealed a significant association between LRRK2 Ser935 levels and Rab10 Thr73 levels in sporadic PD samples. The maximal datapoint value in each genotype was normalized to 1. Rho and P values including all data sets (top), or excluding the outlying datapoint (bottom, *) are indicated for each correlation analysis. Red datapoints indicate the three sporadic PD samples which display a centrosomal cohesion deficit.
Figure 6.
Figure 6.. Detection of active LRRK2 by PLAs in LCLs from control and G2019S PD patients.
(A) Example of proximity ligation signal as a readout for LRRK2 kinase activity in control and G2019S LRRK2-PD LCL cells stained for DAPI. Scale bar, 10 µm. (B) Quantification of the proximity ligation signal (PL-pSer1292-LRRK2) from three control and three G2019S LRRK2-PD LCLs in either the presence or absence of MLi2 (10 nM). Four different control proximity ligation reactions were analyzed on one G2019S LRRK2 LCL line (G2019S 3), which included omission of either one of the two primary antibodies (total LRRK2 antibody (LRRK2) or pSer1292 antibody (pSer1292)), or of either one of the two secondary antibodies (PLUS or MINUS), respectively. Note that there was significant nonspecific proximity ligation signal when omitting the pSer1292 antibody, and this signal was used as background against which the assay signals were evaluated (grey line). Around 300 cells were quantified per condition and experiment. Bars represent mean ± s.e.m. (two independent experiments). (C) Proximity ligation signal based on the means from each line as depicted in (B), from control and G2019S LRRK2 LCLs in either the presence or absence of MLi2 (10 nM) as indicated. Grey line depicts background signal when omitting the pSer1292 antibody. Bars represent mean ± s.e.m. (n = 3 independent lines); **** P < 0.001. (D) Proximity ligation signal was determined in LCLs from three distinct age-matched control, two distinct G2019S LRRK2, three sporadic PD without a cohesion phenotype, and three sporadic PD with a cohesion phenotype (blue), respectively. The nonspecific proximity ligation signal obtained when omitting the pSer1292 antibody is indicated as grey line. Bars represent mean ± s.e.m.; * P < 0.05.

References

    1. Kalia L.V. and Lang A.E. (2015) Parkinson's disease. Lancet 386, 896–912 10.1016/S0140-6736(14)61393-3 - DOI - PubMed
    1. Nalls M.A., Pankratz N., Lill C.M., Do C.B., Hernandez D.G., Saad M. et al. (2014) Large-scale meta-analysis of genome-wide association data identifies six new risk loci for Parkinson's disease. Nat. Genet. 46, 989–993 10.1038/ng.3043 - DOI - PMC - PubMed
    1. Brás J., Guerreiro R. and Hardy J. (2015) Snapshot: genetics of Parkinson's disease. Cell 160, 570–570.e1 10.1016/j.cell.2015.01.019 - DOI - PubMed
    1. Hernandez D.G., Reed X. and Singleton A.B. (2016) Genetics in Parkinson disease: Mendelian versus non-Mendelian inheritance. J. Neurochem. 139, 59–74 10.1111/jnc.13593 - DOI - PMC - PubMed
    1. Healy D.G., Falchi M., O'Sullivan S.S., Bonifati V., Durr A., Bressman S. et al. (2008) Phenotype, genotype, and worldwide genetic penetrance of LRRK2-associated Parkinson's disease: a case-control study. Lancet Neurol. 7, 583–590 10.1016/S1474-4422(08)70117-0 - DOI - PMC - PubMed

Publication types

MeSH terms

Substances