. 2019 Sep 16;2(5):e201900489.
doi: 10.26508/lsa.201900489. Print 2019 Oct.

The huntingtin inclusion is a dynamic phase-separated compartment

Affiliations

The huntingtin inclusion is a dynamic phase-separated compartment

Fahmida Aktar et al. Life Sci Alliance. .

Abstract

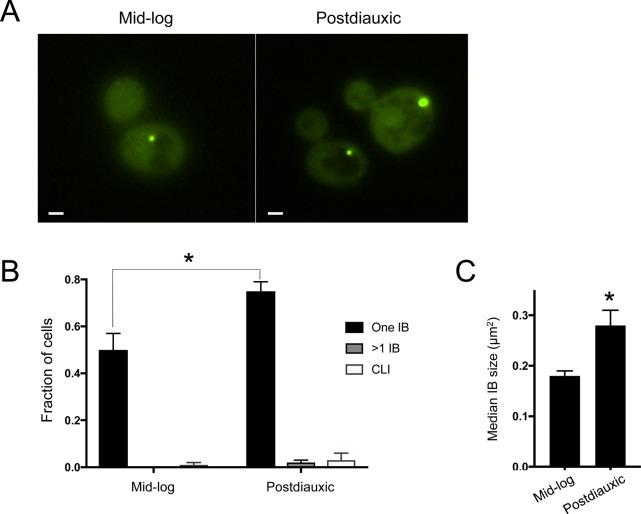
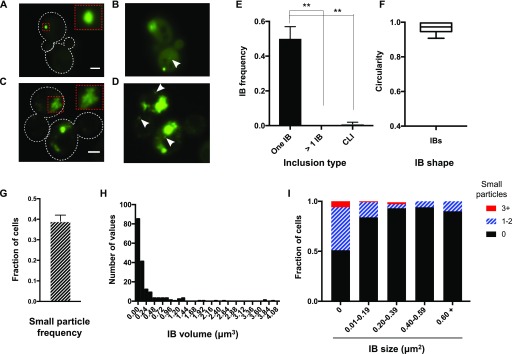
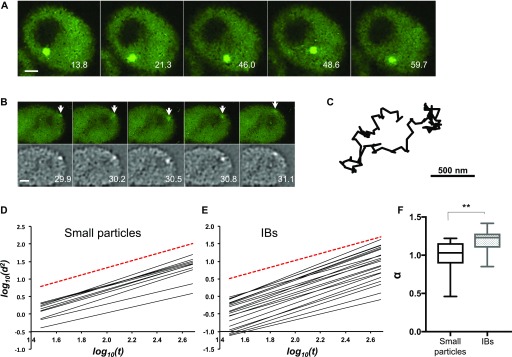
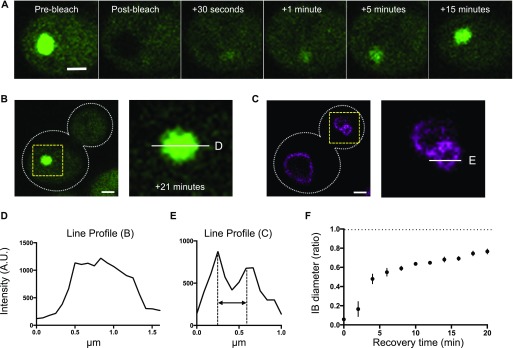
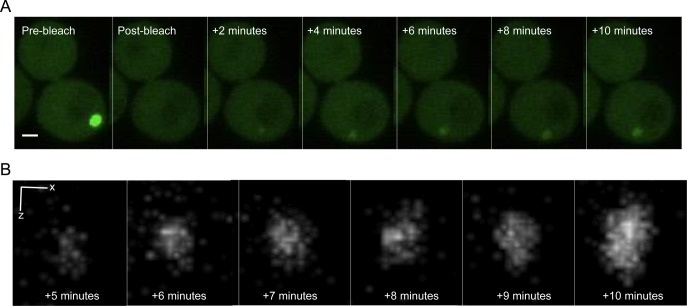
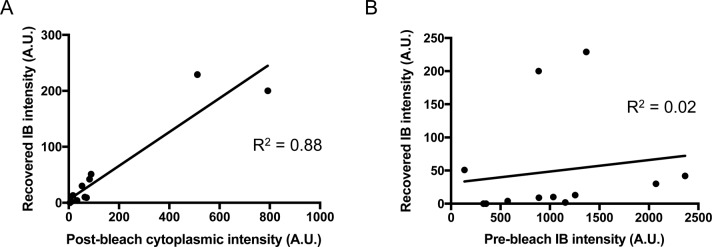
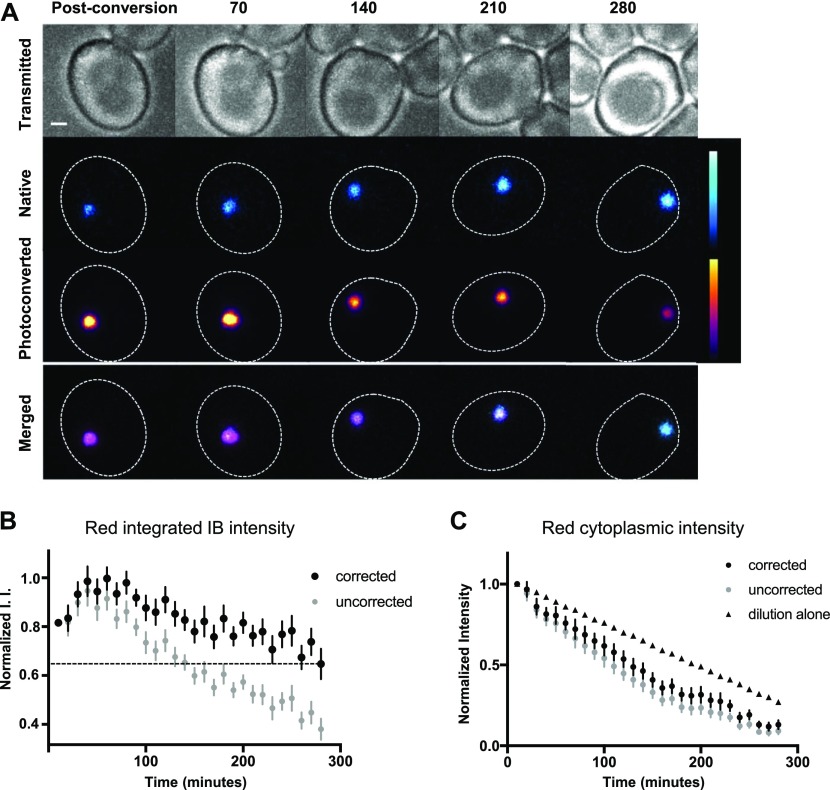
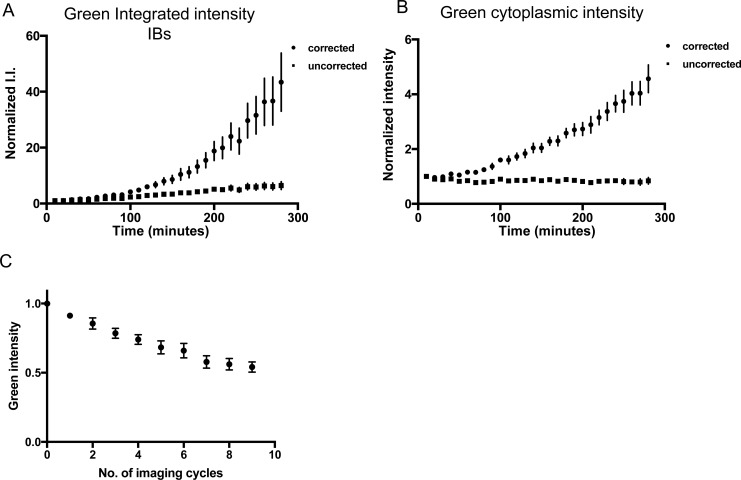
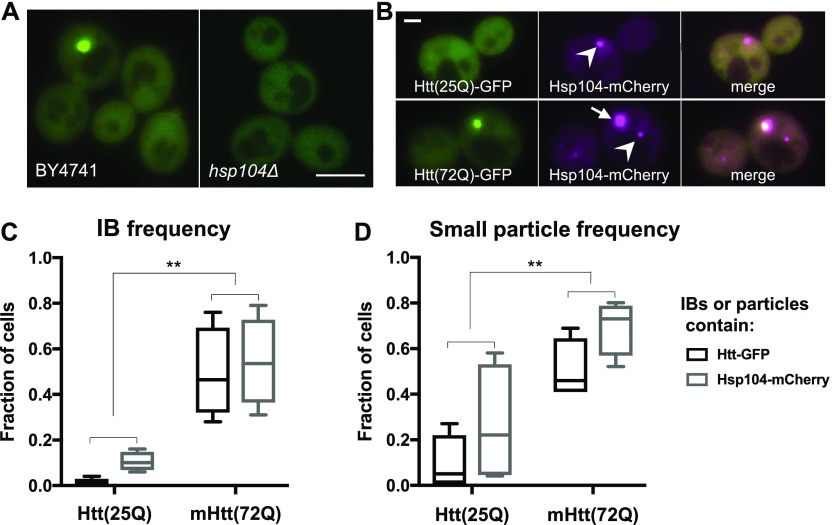
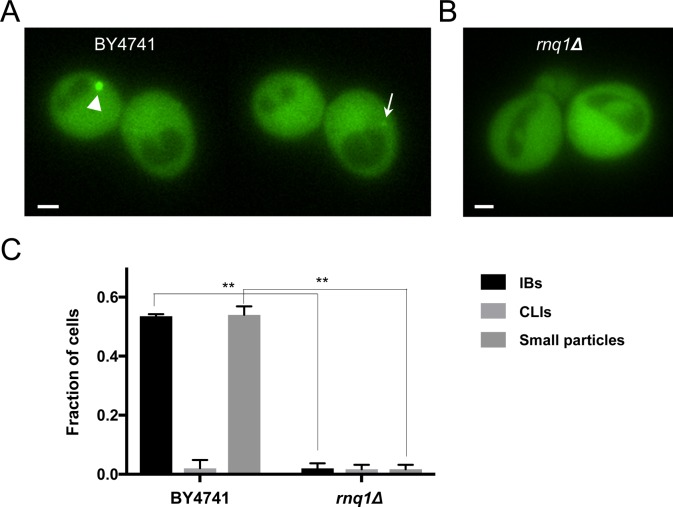
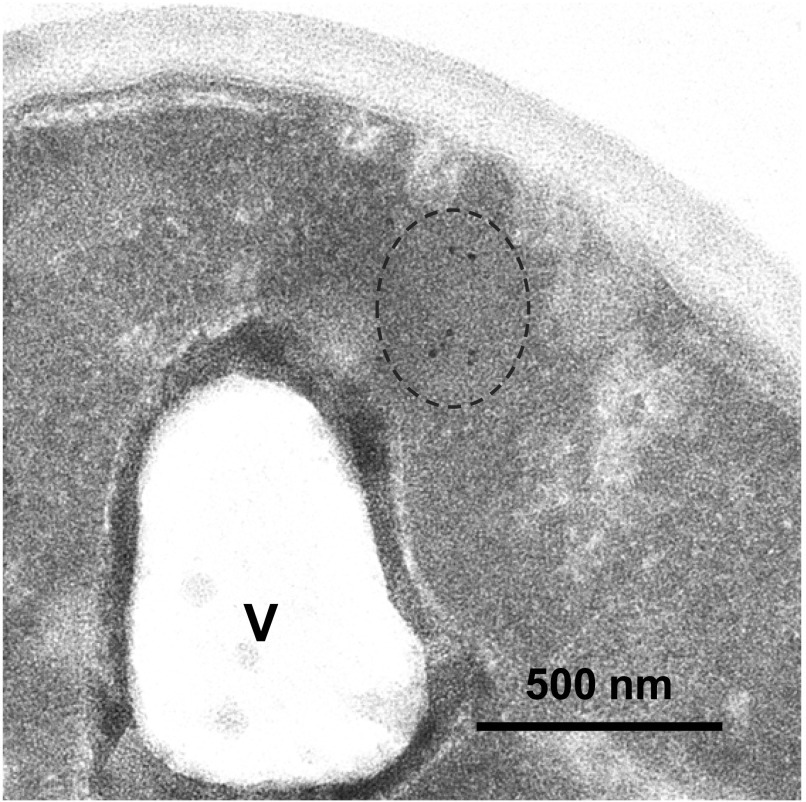
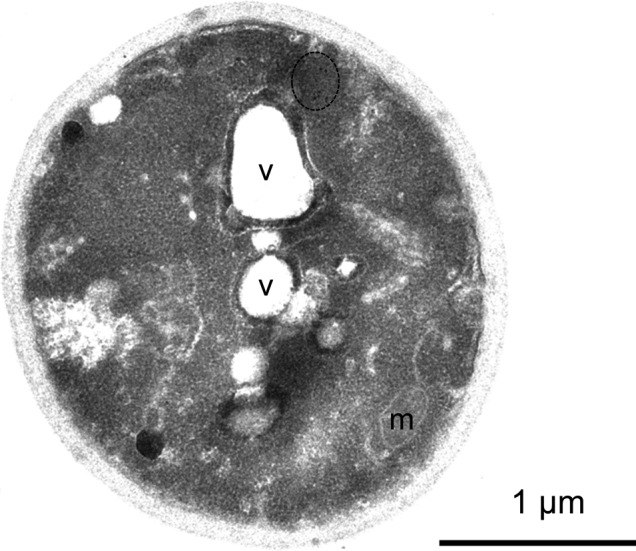
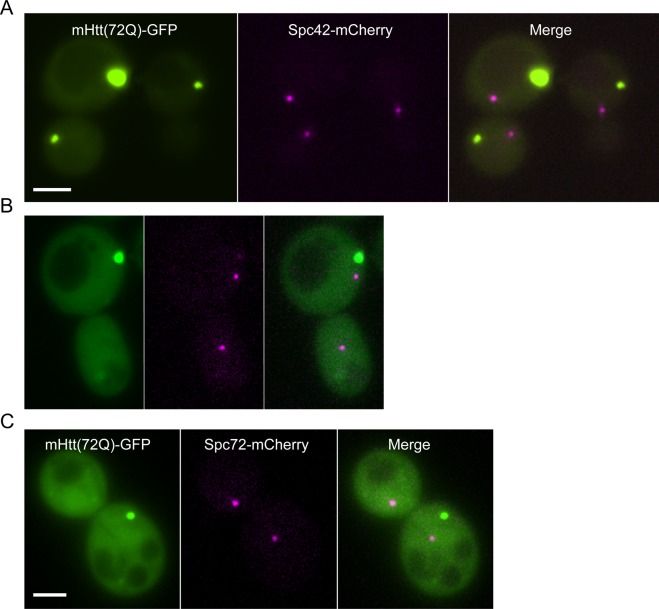
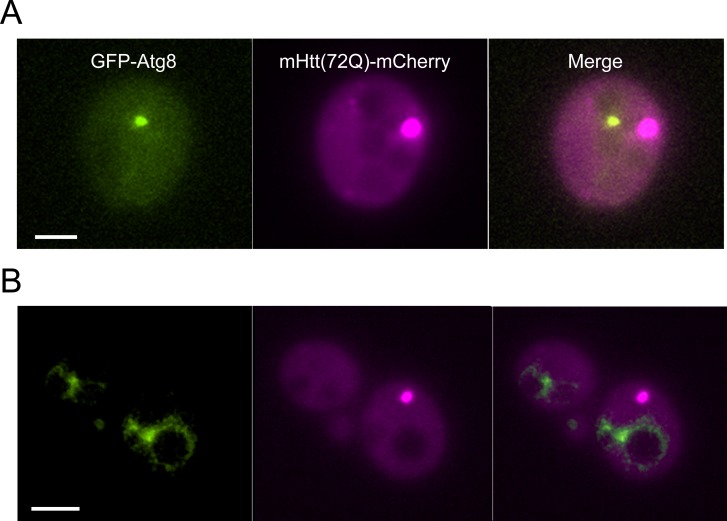
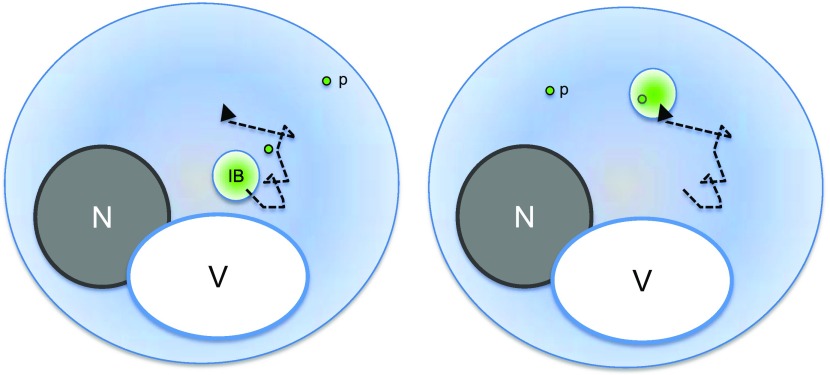
Inclusions of disordered protein are a characteristic feature of most neurodegenerative diseases, including Huntington's disease. Huntington's disease is caused by expansion of a polyglutamine tract in the huntingtin protein; mutant huntingtin protein (mHtt) is unstable and accumulates in large intracellular inclusions both in affected individuals and when expressed in eukaryotic cells. Using mHtt-GFP expressed in Saccharomyces cerevisiae, we find that mHtt-GFP inclusions are dynamic, mobile, gel-like structures that concentrate mHtt together with the disaggregase Hsp104. Although inclusions may associate with the vacuolar membrane, the association is reversible and we find that inclusions of mHtt in S. cerevisiae are not taken up by the vacuole or other organelles. Instead, a pulse-chase study using photoconverted mHtt-mEos2 revealed that mHtt is directly and continuously removed from the inclusion body. In addition to mobile inclusions, we also imaged and tracked the movements of small particles of mHtt-GFP and determine that they move randomly. These observations suggest that inclusions may grow through the collision and coalescence of small aggregative particles.


Conflict of interest statement

The authors declare that they have no conflict of interest.

Figures

Figure S1.
Figure S1.. Inclusions accumulate as cells exit log-phase growth.
Mid-log–phase cells from a single starting culture were inoculated at low and high densities into selective minimal media (SC-Leu) and grown overnight with shaking at 30°C. Approximately 16–20 h later, mid-log cultures (OD600 = 0.1–0.3) and postdiauxic cultures (OD600 = 1.5–2) were analyzed. (A) mHtt(72Q)-GFP inclusions are less frequent and smaller in mid-log than in postdiauxic cultures. A single, representative optical section is shown. Scale, 1 μm. (B) Quantitation of the frequency of cells with single inclusion bodies, multiple inclusion bodies, or CLIs. The total fraction of cells with inclusions rises from 52% in mid-log cells to 80% in postdiauxic cells. The fraction of cells with single IBs increases significantly in postdiauxic cells (error bars indicate SEM; *P = 0.02, two-tailed t test, unequal variance). (C) Quantitation of IB size (defined as maximal cross-sectional area) in mid-log and postdiauxic cells. IBs in postdiauxic cells are significantly larger (bars indicate median ±SEM; *P = 0.02, two-tailed t test, unequal variance). (B, C) Show pooled data from three to four independent experiments of 50–75 cells in each session, for a total of 166 (mid-log) or 250 (postdiauxic) cells.
Figure 1.
Figure 1.. Mutant Htt typically forms a single ovoid IB, accompanied by small particles.
(A) Mutant Htt(72Q)-GFP in mid-log–phase cells forms a single, ovoid, uniformly fluorescent IB. A single optical section is shown. Cell outlines are indicated by dotted white lines. Inset shows enlarged version of area indicated by dotted red rectangle. Bar, 2 μm. (B) Small particles are sometimes seen (arrowhead); a single optical section is shown, from the same z-series as in (A), but in a different imaging plane and with enhanced contrast. (C) In a small fraction of cells, mHtt(72Q)-GFP is found in asymmetric CLIs. Cell outlines are indicated by dotted white lines. Inset shows enlarged version of area indicated by dotted red rectangle, showing inhomogeneous intensity of the CLIs. A single, representative optical section is shown. Bar, 2 μm. (D) Numerous smaller inclusions often accompany a CLI (arrowheads). A single optical section is shown, from the same z-series as in (C), but in a different imaging plane and with contrast enhanced to reveal the smaller inclusions. (E) In mid-log cells, single IBs are significantly more prevalent than either multiple IBs or CLIs. Cells were in mid-log phase and had been growing for at least 10 doubling times. The mean of three trials is shown, n = 166 cells total. Error bars represent SEM. **P < 0.01, ANOVA and unpaired two-tailed t test. (F) Ovoid IBs are approximately circular (whiskers indicate minimum and maximum values; n = 16 IBs with diameters over 0.4 μm). (G) Quantitation of the frequency of small particles in the same cells quantified in (E); error bars indicate SEM. (H) Histogram of apparent IB volumes calculated from 3D series (n = 184). (I) The fraction of cells containing 0, 1–2, or 3 or more small particles was determined in cells with different IB sizes (defined as maximal apparent cross-sectional area). n = 48–233 cells per category.
Figure 2.
Figure 2.. Inclusions and small particles of aggregated mHtt are mobile.
(A) Representative time-lapse sequence of an IB moving within the cytoplasm. Numbers indicate elapsed time in seconds. Bar, 1 μm. (B) Representative time-lapse frames showing a small particle (arrows). Upper panels, denoised images; lower panels, the same images processed with the SpotTracker Spot Enhancing Filter 2D. Numbers indicate elapsed time in seconds. Bar, 1 μm. (C) Track of the particle indicated in (B). (D, E) The log of mean squared displacement (d2) is plotted against the log of time (t) for 23 small particles (D) or 23 IBs (E). Each fitted line is derived from a single small particle. The slope of the line gives the value for the exponent α in the diffusion equation. The red dashed reference line shows α = 1 (random diffusion). A slope >1 indicates directed movement. (F) The average value of α was determined for small particles and IBs. **P = 0.0006, unpaired two-tailed t test with unequal variance, n = 23 for each group; whiskers indicate minimum and maximum values.
Figure 3.
Figure 3.. The mHtt within an IB is mobile.
(A) Recovery of mHtt(72Q)-GFP fluorescence within an IB following photobleaching. Single planes are shown from z-series taken at 200-nm intervals. Bar, 1 μm. In the pre-bleach image, the long axis of the IB is 1,100 nm, and the short axis is 900 nm; after 15 min of recovery, the long and short axes of the IB are 900 and 730 nm, respectively. Bar, 1 μm. (B, D) Left panel, single plane showing the same cell as in (A), at 21 min post-bleach. Right panel, enlarged view of area inside yellow box, with white line indicating the location of the profile plot in (D). Bar, 1 μm. (C) Left panel, single plane showing Vph1-mCherry in the same cell as in (A) and (B). Bar, 1 μm. (E) Right panel, enlarged view of area inside yellow box, with white line indicating the location of the profile plot in (E). (D) Intensity profile of the line across the center of the IB shown in (B). (E) The intensity profile of the line across the center of a small vacuole in the bud shown in (C). Double-headed arrow indicates the distance between the two sides of the vacuole (380 nm). (F) Ratio of IB diameter to pre-bleach IB diameter as a function of time of recovery (n = 6, error bars indicate SEM).
Figure S2.
Figure S2.. 3D rendering of Htt(72Q)-GFP entering the IB.
(A) Recovery of mHtt(72Q)-GFP fluorescence within an IB following photobleaching. Maximum-intensity projections of z-stacks taken at 100-nm intervals are shown. Bar, 1 μm. In the pre-bleach image, the long axis of the IB is 800 nm; after 10 min of recovery, the apparent diameter of the IB is 625 nm. The optical section for these images is calculated to be 300 nm, and the x–y resolution 180 nm. (B) 3D rendering of the z-stack of the IB shown in (A). X bar, 80 nm; Z bar, 100 nm.
Figure S3.
Figure S3.. Recovered fluorescence is entering the IB from the cytoplasm.
(A, B) Total recovered IB fluorescence intensity varies linearly with the post-bleach cytoplasmic intensity (R2 = 0.88, n = 12 IBs), whereas (B) a plot of total recovered IB fluorescence intensity versus pre-bleach total IB fluorescence for the same IBs does not show a linear relationship (R2 = 0.02, n = 12).
Figure 4.
Figure 4.. Mutant Htt in the IB is turned over.
(A) Time-lapse images of mHtt(72Q)-mEos2 were collected every 10 min following photoconversion of a portion of the mEos2 from green to red. Images of a cell containing a large IB taken immediately after photoconversion, and then every 70 min for 280 min, are shown in bright-field (upper panels), the native and photoconverted channels separately (middle two rows), and with native (cyan) and photoconverted (magenta) channels merged (lower panels). Numbers indicate minutes after photoconversion. To better display intensity changes, “fire” and “ice” lookup tables are used in the middle panels; intensity calibration bars are shown on the right. Bar, 1 μm. Mother cell body outlined in dashed white line. (B, C) Integrated red intensity (I.I.) of IBs (B) and mean red cytoplasmic intensity (C) after photoconversion for mHtt(72Q)-mEos2–expressing cells was measured over 4.5 h. Values before (grey circles) and after (black circles) correction for photobleaching were normalized and reported as the fraction of the maximum value following photoconversion. The predicted decrease in cytoplasmic intensity based on dilution of the cytoplasm due to cell growth and division is shown (triangles). Mean ± SEM is shown for 17 cells.
Figure S4.
Figure S4.. Green Htt is continuously synthesized and added to the IB and cytoplasm.
(A, B) Integrated green intensity (I.I.) of IBs in the green channel and (B) mean green cytoplasmic intensity of mHtt(72Q)-mEos2–expressing cells after photoconversion was measured over the 4.5-h time course. Values were normalized to the initial value immediately following photoconversion. The graph shows mean intensity value ± SEM for 17 cells with IBs. Intensity values corrected for photobleaching (circles) and uncorrected for photobleaching (squares) are shown. The correction for photobleaching assumes that all green mHtt(72Q)-mEos2 present in the cell were exposed to every imaging cycle that occurred during the 4.5-h time course, that is, that all green mHtt(72Q)-mEos2 molecules were present for the entire time course. Therefore, the intensity values corrected for photobleaching are maximum possible intensity values. (C) Normalized intensity values for cellular green mHtt(72Q)-mEos2 when imaged 10 times as rapidly as possible; error bars indicate SEM. After 10 rapid cycles of imaging, the green cytoplasmic intensity is 0.54 ± 0.04 A.U. If no new mHtt(72Q)-mEos2 was synthesized, bleaching due to 28 rounds of imaging would be expected to cause the average cytoplasmic intensity to drop to ∼3.5% of its original value at most, considering only fluorescence loss due to cell division. However, it drops only slightly, to 84% of the original value. From the uncorrected intensity values, it is clear that the green mHtt(72Q)-mEos2 present in the cell is a mixed population which contains a substantial amount of newly synthesized green mHtt(72Q)-mEos2. Therefore, the true value lies between the corrected and uncorrected values.
Figure 5.
Figure 5.. Hsp104 is found in mHtt particles and is required for their formation.
(A) Representative images of mHtt(72Q)-GFP in wild-type (left panel) and hsp104Δ (right panel) cells. Bar, 4 μm. (B) Cells containing genomically tagged Hsp104-mCherry and either native Htt(25Q)-GFP (upper panels) or mHtt(72Q)-GFP (lower panels). Hsp104-mCherry is displayed as magenta. Arrow, mHtt IB containing Hsp104; arrowheads, Hsp104 IB with no detectable mHtt. Bar, 1 μm. (C, D) Cells from the strains shown in (B) were assessed for the presence of IBs and small particles. The fraction of cells containing one or more IBs (C) or small particles (D) bearing the indicated marker was determined. **P = 0.0001–0.0003 for differences between Htt alleles, two-way ANOVA, n = 4 replicates, 124–130 cells total per group; whiskers indicate minimum and maximum values.
Figure S5.
Figure S5.. rnq1Δ cells do not typically form visible mHtt(72Q)-GFP aggregates.
(A) Two individual planes of a z-series through two wild-type BY4741 cells expressing mHtt(72Q)-GFP. The cell on the left contains an IB (arrowhead), whereas in a different plane, a small particle is seen in the cell on the right (arrow). (B) A representative plane taken from a z-series through two rnq1Δ cells expressing mHtt(72Q)-GFP. The mHtt(72Q)-GFP remains diffuse and cytoplasmic; no aggregates or liquid assemblies are seen. Bar, 1 μm. (C) The fraction of BY4741 or rnq1Δ cells carrying the indicated type of visible mHtt(72Q)-GFP aggregate. Error bars indicate SEM; n = 88 and 195 cells, respectively, in 2–3 imaging sessions (*P 0.01, both ANOVA and unpaired two-tailed t test).
Figure 6.
Figure 6.. Mutant Htt IBs are non–membrane bound.
Transmitted electron micrograph of a cell expressing mutant Htt(72Q)-GFP, fixed, and stained with anti-GFP and 10-nm gold particle–conjugated secondary antibody. Dotted line indicates a cluster of gold particles, ∼500 nm in diameter, in the cytoplasm. V, a lobe of the vacuole, surrounded by membrane. Bar, 500 nm.
Figure S6.
Figure S6.. Mutant Htt IBs are non–membrane bound.
Section through whole cell shown in Fig 6, showing vacuolar and mitochondrial membranes. Vacuole, v, mitochondrion, m. Bar, 1 μm.
Figure S7.
Figure S7.. The localization of mutant Htt IBs with regard to the spindle-pole body.
(A) Mutant Htt(72Q)-GFP (green) co-expressed in cells with an integrated Spc42-mCherry reporter fusion (magenta). The GFP-tagged IBs and mCherry-tagged spindle poles are visible in different planes. The merged image demonstrates the lack of co-localization in the x–y plane; the magenta and green images are also 1.6 μm apart along the z-axis. (B) Mutant Htt(103Q)-GFP (green) co-expressed in cells with an integrated Spc42-mCherry reporter fusion (magenta). The magenta image is a maximum projection as the two mCherry-tagged spindle poles were visible in planes that were 600 nm apart; in this case, the IB, which is much larger than a spindle pole, was visible in the same planes as the two spindle poles. (C) Mutant Htt(72Q)-GFP (green) co-expressed in cells with an integrated Spc72-mCherry reporter fusion (magenta). The magenta image is a maximum projection as the two mCherry-tagged spindle poles were visible in planes that were 300 nm apart; in this case, the IB was visible in the same planes as the two spindle poles. The scale bar represents 2 μm in (A–C).
Figure S8.
Figure S8.. Unstressed mutant Htt(72Q) IBs do not contain Atg8.
A total of 676 cells co-expressing GFP-Atg8 and mHtt(72Q)-mCherry were examined for co-localization. Of these, 294 contained mHtt IBs, and 101 contained both mHtt IBs and autophagosomes. We measured the average apparent diameter of the IBs and autophagosomes. Based on the apparent area of the IB and autophagosome compared with the available cytoplasmic cross-sectional area of the cell, we estimated that they will overlap by chance ∼5–8% of the time. Because more than 90% of autophagosomes are below the limit of resolution, and the IB is often below the limit of resolution, apparent overlap does not signify contact. Of 101 cells containing both IBs and autophagosomes, there were two instances of partial overlap, below the threshold for significance. (A) A maximum projection of a typical cell with both a GFP-Atg8–labeled vesicle (green) and an mHtt(72Q)-mCherry (magenta) IB is shown. The IB and autophagosome are in different axial planes as well as in different locations in the X–Y plane. (B) Autophagosomes containing the GFP-Atg8 fusion protein are competent to fuse with the vacuolar membrane in cells expressing mHtt-mCherry. The scale bar represents 2 μm in (A) and (B).
Figure 7.
Figure 7.. Mutant Htt IBs may incorporate smaller particles of aggregated protein by collision.
The simplest model of mHtt IB growth that is consistent with direct observations of IB and small particle movement is that IBs incorporate small aggregates of mHtt through collision as they diffuse in the cytosol. Mutant Htt IBs are constantly moving and, in contrast to IPODs, do not contain Atg8. Nucleus (N), vacuole (V), IB, two small mHtt particles (p), and IB path (dashed black line) are indicated. A small particle is shown being incorporated into the IB after the two collide.

References

    1. Arosio P, Vendruscolo M, Dobson CM, Knowles TPJ (2014) Chemical kinetics for drug discovery to combat protein aggregation diseases. Trends Pharmacol Sci 35: 127–135. 10.1016/j.tips.2013.12.005 - DOI - PubMed
    1. Arrasate M, Mitra S, Schweitzer ES, Segal MR, Finkbeiner S (2004) Inclusion body formation reduces levels of mutant huntingtin and the risk of neuronal death. Nature 431: 805–810. 10.1038/nature02998 - DOI - PubMed
    1. Bakshi S, Siryaporn A, Goulian M, Weisshaar JC (2012) Superresolution imaging of ribosomes and RNA polymerase in live Escherichia coli cells. Mol Microbiol 85: 21–38. 10.1111/j.1365-2958.2012.08081.x - DOI - PMC - PubMed
    1. Becher MW, Kotzuk JA, Sharp AH, Davies SW, Bates GP, Price DL, Ross CA (1998) Intranuclear neuronal inclusions in Huntington’s disease and dentatorubral and pallidoluysian atrophy: Correlation between the density of inclusions and IT15 CAG triplet repeat length. Neurobiol Dis 4: 387–397. 10.1006/nbdi.1998.0168 - DOI - PubMed
    1. Brangwynne CP, Eckmann CR, Courson DS, Rybarska A, Hoege C, Gharakhani J, Jülicher F, Hyman AA (2009) Germline P granules are liquid droplets that localize by controlled dissolution/condensation. Science 324: 1729–1732. 10.1126/science.1172046 - DOI - PubMed

Publication types

MeSH terms

LinkOut - more resources