. 2019 Oct 1;116(40):19939-19944.
doi: 10.1073/pnas.1907342116. Epub 2019 Sep 16.

Organization of fast and slow chromatin revealed by single-nucleosome dynamics

Affiliations

Organization of fast and slow chromatin revealed by single-nucleosome dynamics

S S Ashwin et al. Proc Natl Acad Sci U S A. .

Abstract

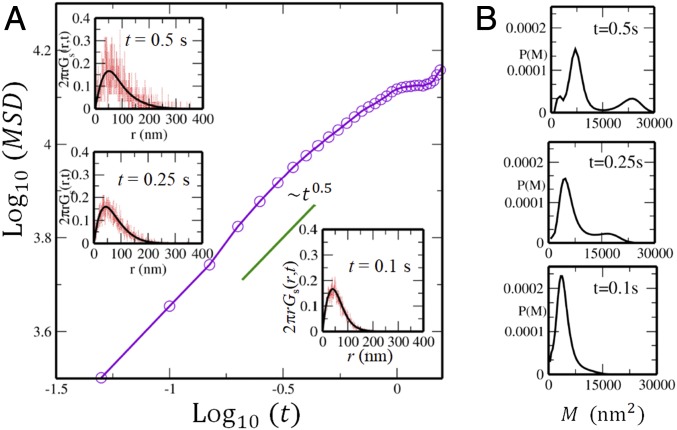
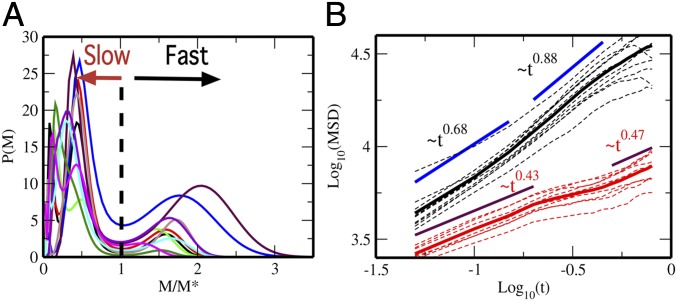
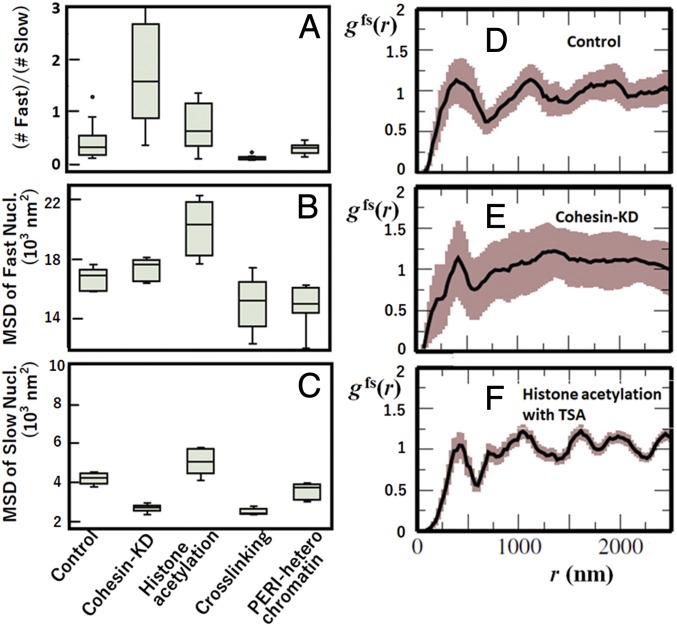
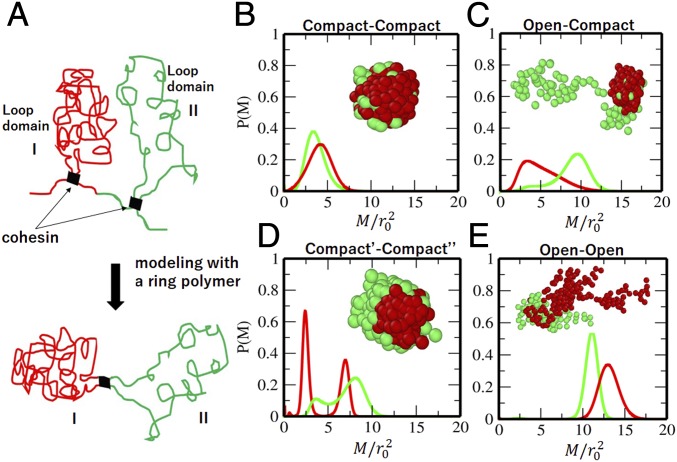
Understanding chromatin organization and dynamics is important, since they crucially affect DNA functions. In this study, we investigate chromatin dynamics by statistically analyzing single-nucleosome movement in living human cells. Bimodal nature of the mean square displacement distribution of nucleosomes allows for a natural categorization of the nucleosomes as fast and slow. Analyses of the nucleosome-nucleosome correlation functions within these categories along with the density of vibrational modes show that the nucleosomes form dynamically correlated fluid regions (i.e., dynamic domains of fast and slow nucleosomes). Perturbed nucleosome dynamics by global histone acetylation or cohesin inactivation indicate that nucleosome-nucleosome interactions along with tethering of chromatin chains organize nucleosomes into fast and slow dynamic domains. A simple polymer model is introduced, which shows the consistency of this dynamic domain picture. Statistical analyses of single-nucleosome movement provide rich information on how chromatin is dynamically organized in a fluid manner in living cells.

Keywords: chromatin domains; cohesin; histone; live cell imaging; nucleosomes.


Conflict of interest statement

The authors declare no conflict of interest.

Figures

Fig. 1.
Fig. 1.
MSD of nucleosome movement observed in live cell imaging of an example cell. (A) The MSD M¯ averaged over nucleosomes is plotted as a function of time. In Insets, the self-part of the vHC 2πrGs(r,t) reproduced from P(M,t) using Eq. 1 (black) is superposed on the one obtained from the observed trajectories of single nucleosomes (red) at t=0.1 , t=0.25 , and t=0.5 s. (B) The distribution P(M,t) of the MSD of single nucleosomes at each corresponding time.
Fig. 2.
Fig. 2.
Fast and slow nucleosomes. (A) The distribution of MSD of single nucleosomes, P(M)=P(M,0.5s), is plotted for 10-cell samples as functions of M/M*, where M* is M at the minimum between 2 peaks of P(M). (B) The MSD averaged over fast nucleosomes, M¯f (black), and the MSD averaged over slow nucleosomes, M¯s (red), are shown for 10 individual cells (dashed lines) and the average over 10 cells (solid lines).
Fig. 3.
Fig. 3.
Autocorrelation functions of displacement of single nucleosomes and the density of vibrational modes. (A) The autocorrelation function of single-nucleosome displacement, ηa(t), is plotted as a function of t. Bars show the standard errors among 10 cells. (B) The density of vibrational modes, Da(ω), is plotted as a function of frequency ω for 10 cells. In A and B, curves are plotted for fast (a=f; black) and slow (a=s; red) nucleosomes.
Fig. 4.
Fig. 4.
Pair correlation functions of position and displacement of single nucleosomes. (A–C) Pair correlations of position: that is, the radial distribution functions, gab(r), of single nucleosomes. Triangles show the distances Dss and 2Dss in A, Dff and 2Dff in B, and Dfs and Dfs+Dss in C. The widths of brown shaded area show the standard errors among 10 cells. (D–F) Profile functions, |ξab(r)|, of pair correlation of displacement of single nucleosomes. Curves are shown with ab=ss for the slow–slow correlation (A and D), ab=ff for the fast–fast correlation (B and E), and ab=fs for the fast–slow correlation (C and F).
Fig. 5.
Fig. 5.
Effects of perturbations on cells and effects of focusing on heterochromatin. (A–C) Features of the effects on the distribution of MSD, P(M,t) at t=0.5 s, of single nucleosomes: (A) the ratio of the number of fast nucleosomes to the number of slow nucleosomes, (B) the mean MSD of fast nucleosomes, and (C) the mean MSD of slow nucleosomes. Box plots of the data from 10 cells. (D–F) The radial distribution function gfs(r) in cases of (D) control, (E) cohesin KD, and (F) histone hyperacetylation with TSA. In D–F, widths of brown shaded area show the standard errors among 10 cells.
Fig. 6.
Fig. 6.
A polymer model of looped domains. (A) Two consecutive looped domains are represented by Region I and Region II in a model ring. The cohesin binding is represented by thick bars. (B–E) Distribution of MSD, P(M), of beads in a polymer model. Connected 2-looped domains of B compact (ϵI/kBT=1.0)–compact (ϵI/kBT=1.0), (C) compact (ϵI/kBT=1.0)–open (ϵII/kBT=0.6), (D) compact′ (ϵI/kBT=1.2)–compact″ (ϵII/kBT=0.9), and (E) open (ϵI/kBT=0.6)–open (ϵII/kBT=0.6) regions. In B–E, P(M) calculated from the reference point in Region I (red) and P(M) calculated from the reference point in Region II (green) are plotted. Insets are snapshots of the polymer ring; beads in Region I (red) and those in Region II (green) are shown with spheres.

References

    1. Bickmore W. A., The spatial organization of the human genome. Annu. Rev. Genom. Hum. Genet. 14, 67–84 (2013). - PubMed
    1. Cardoso M. C., Schneider K., Martin R. M., Leonhardt H., Structure, function and dynamics of nuclear subcompartments. Curr. Opin. Cell Biol. 24, 79–85 (2012). - PubMed
    1. Hübner M., Eckersley-Maslin M., Spector D., Chromatin organization and transcriptional regulation. Curr. Opin. Genet. Dev. 23, 89–95 (2013). - PMC - PubMed
    1. Maeshima K., Ide S., Hibino K., Sasai M., Liquid-like behavior of chromatin. Curr. Opin. Genet. Dev. 37, 36–45 (2016). - PubMed
    1. Dekker J., Heard E., Structural and functional diversity of topologically associating domains. FEBS Lett. 589, 2877–2884 (2015). - PMC - PubMed

Publication types

LinkOut - more resources