. 2019 Sep 16;9(1):13307.
doi: 10.1038/s41598-019-49791-w.

Energy-efficiency of Cardiomyocyte Stimulation with Rectangular Pulses

Affiliations

Energy-efficiency of Cardiomyocyte Stimulation with Rectangular Pulses

Martin Laasmaa et al. Sci Rep. .

Abstract

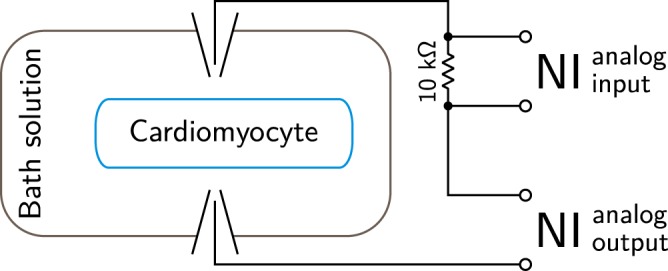
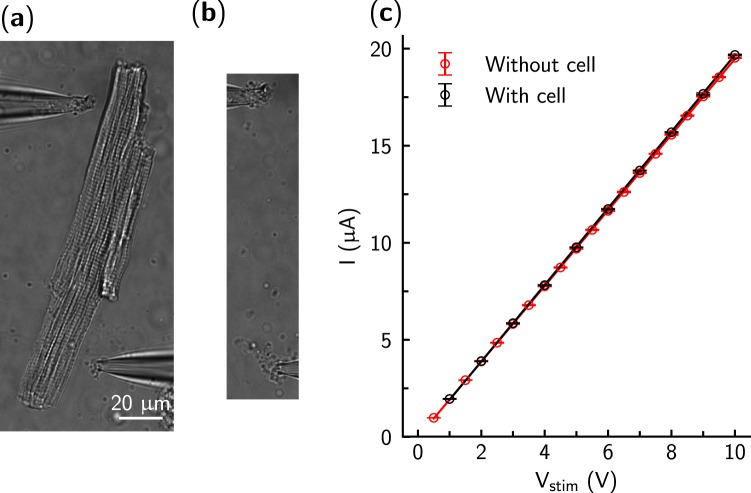
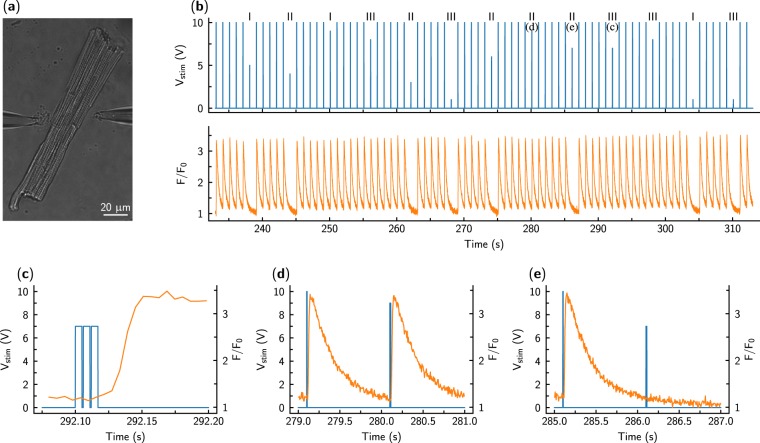
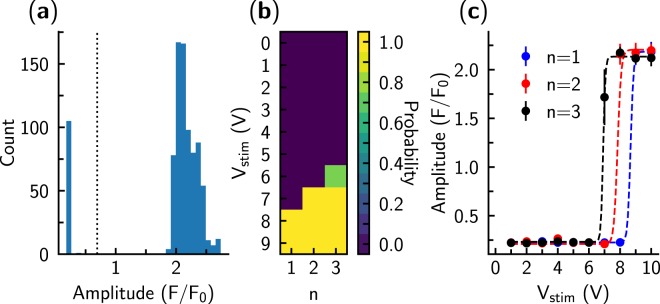
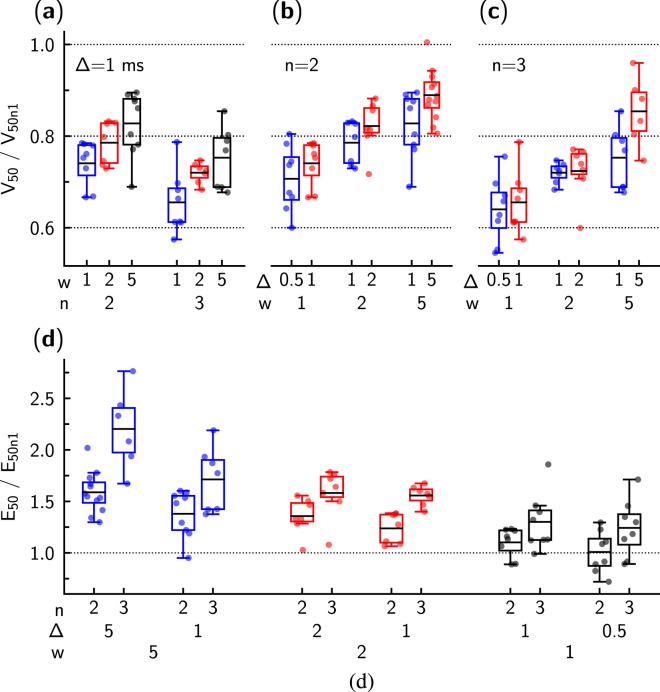
In cardiac pacemaker design, energy expenditure is an important issue. This work aims to explore whether varying stimulation pulse configuration is a viable optimization strategy for reducing energy consumption by the pacemaker. A single cardiomyocyte was used as an experimental model. Each cardiomyocyte was stimulated with different stimulation protocols using rectangular waveforms applied in varying number, in short succession. The amplitude, the width of each pulse, and the interval between consecutive pulses were modified. The application of multiple pulses in a short sequence led to a reduction of the threshold voltage required for stimulation when compared to a single pulse. However, none of the employed multi-pulse sequences reduced the overall energy expenditure of cell stimulation when compared to a single pulse stimulation. Among multiple pulse protocols, a combination of two short pulses (1 ms) separated with a short interval (0.5 ms) had the same energy requirements as a single short pulse (1 ms), but required the application of significantly less voltage. While increasing the number of consecutive pulses does not reduce the energy requirements of the pacemaker, the reduction in threshold voltage can be considered in practice if lower stimulation voltages are desired.


Conflict of interest statement

The authors declare no competing interests.

Figures

Figure 1
Figure 1
The overall scheme of the experimental setup. The cardiomyocyte was placed in the bath solution and stimulated through pipettes. The voltage between the pipettes was driven by a National Instruments data acquisition card (NI) analog output with the current estimated from a voltage drop induced by a 10 kΩ resistor. The voltage drop was measured by the NI analog input.
Figure 2
Figure 2
The experimental setup with (a) and without (b) a cardiomyocyte between the two pipette tips in the bath solution. The current between the pipette tips was linearly dependent on the applied voltage (c).
Figure 3
Figure 3
Response of a cardiomyocyte (a) to the stimulation by a sequence of pulses. The cardiomyocyte was excited by changes in voltage Vstim between the pipette tips applied as short rectangular pulses ((b), top). The pulse sequence consisted of 5 larger single pulses (pre-pulses, used to precondition the cell) followed by a studied stimulation sequence with varying pulse parameters. In (b) (top), changes in applied voltage are visible with the number of pulses per stimulation sequence marked as Roman numerals on the top of the trace. In response to the pulse, the cardiomyocyte was either stimulated or not. When stimulated, the fluorescence increase was somewhat delayed after the applied stimulation sequence (c), in agreement with the mechanism of Ca2+ -induced Ca2+ -release. Stimulation was assessed by recording fluorescence F of the Ca2+ sensitive dye and is shown normalized to the resting cellular fluorescence F0. Note that while the preconditioning pulses always elicited a Ca2+ transient, the success of cellular activation was variable for the studied pulses. As examples, stimulated (d) and non-stimulated (e) cases are shown with the preceding preconditioning pulse (see subplot markings at the top of the trace in (b) next to the corresponding pulse). In the figure, voltage and fluorescence traces are shown in blue and orange, respectively.
Figure 4
Figure 4
Analysis of the recordings performed on a single cardiomyocyte. (a) Fluorescence changes during a single period were analyzed by following the amplitude of the changes. Note that the distribution of the amplitudes was bimodal: one population corresponded to cases with successful stimulation of the cell (larger F/F0) and one to unsuccessful stimulation (lower F/F0). The threshold value used for detection of cell stimulation by the given pulse is shown as a dashed line. (b) Average stimulation success rate for the pulses with different voltages Vstim and number of pulses n shown by color. Here, each pulse sequence was applied 5 times during the experiment. Note that for most of the pulse sequences the stimulation was either always or never successful (probabilities 0 and 1, respectively). However, for a triple pulse with Vstim = 6V, one of the 5 tests did not induce stimulation. (c) Threshold voltage for each of the pulse sequences was found by fitting the Hill equation to the average fluorescence amplitude when the fluorescence was studied as a function of the pulse voltage. Note that lower voltages were required to stimulate the cell if there were more pulses per each stimulation sequence (n). As an example, for this particular case, fitted values for n = 1 were A = 1.96, B = 0.22, V50 = 8.67, and h = 91.84. Here, the Hill equation is used only as a formal equation for description of transition from one state to another.
Figure 5
Figure 5
Statistical analysis of the recorded data. Threshold voltage V50 and energy expenditure E50 obtained for the stimulation sequences with the multiple pulses (n = 2 or 3) were normalized to the respective values obtained for the same pulse width w (shown in ms) and inter-pulse interval Δ (shown in ms) for a single pulse stimulation (n = 1). (ac) show threshold voltage V50 dependency on stimulation pulse width w, the number of pulses used in the sequence n, and the inter-pulse interval Δ. In (a), at the same interval Δ, the influence of pulse width w and the number of pulses n is demonstrated. In (b,c), note that multiple pulses with smaller w could lead to a significant reduction in the threshold voltage (V50/V50n1 < 1). In (d), energy expenditure E50 required to activate cardiomyocyte is shown for studied pulse sequences. For most of the sequences examined, E50 was larger when the cardiomyocyte was stimulated using multiple pulses (n > 1). An exception to this rule was the double pulse with w = 1 ms and Δ = 0.5 or 1 ms.

References

    1. Mulpuru S, Madhavan M, Mcleod C, Cha Y, Friedman P. Cardiac pacemakers: Function, troubleshooting, and management: Part 1 of a 2-part series. J. Am. Coll. Cardiol. 2017;69:189–210. doi: 10.1016/j.jacc.2016.10.061. - DOI - PubMed
    1. Madhavan M, Mulpuru S, Mcleod C, Cha Y, Friedman P. Advances and future directions in cardiac pacemakers: Part 2 of a 2-part series. J. Am. Coll. Cardiol. 2017;69:211–235. doi: 10.1016/j.jacc.2016.10.064. - DOI - PubMed
    1. Miller M, Neuzil P, Dukkipati S, Reddy V. Leadless cardiac pacemakers: Back to the future. J. Am. Coll. Cardiol. 2015;66:1179–1189. doi: 10.1016/j.jacc.2015.06.1081. - DOI - PubMed
    1. Bernard M. Pacing without wires: Leadless cardiac pacing. Ochsner J. 2016;16:238–242. - PMC - PubMed
    1. Elmgvist R, Landegren J, Pettersson S, Senning Å, William-Olsson G. Artificial pacemaker for treatment of adams-stokes syndrome and slow heart rate. Am. Heart J. 1963;65:731–748. doi: 10.1016/0002-8703(63)90239-4. - DOI

Publication types