. 2019 Sep 16;9(1):13326.
doi: 10.1038/s41598-019-50020-7.

Mixing brain cerebrosides with brain ceramides, cholesterol and phospholipids

Affiliations

Mixing brain cerebrosides with brain ceramides, cholesterol and phospholipids

Emilio J González-Ramírez et al. Sci Rep. .

Abstract

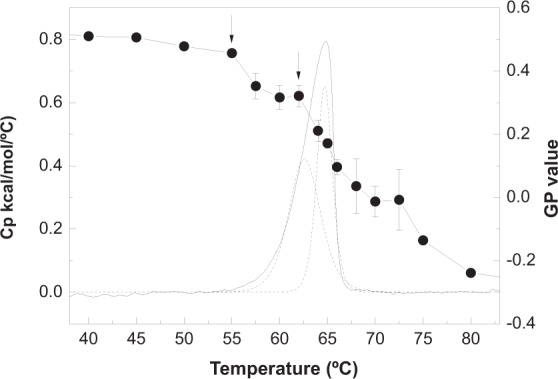
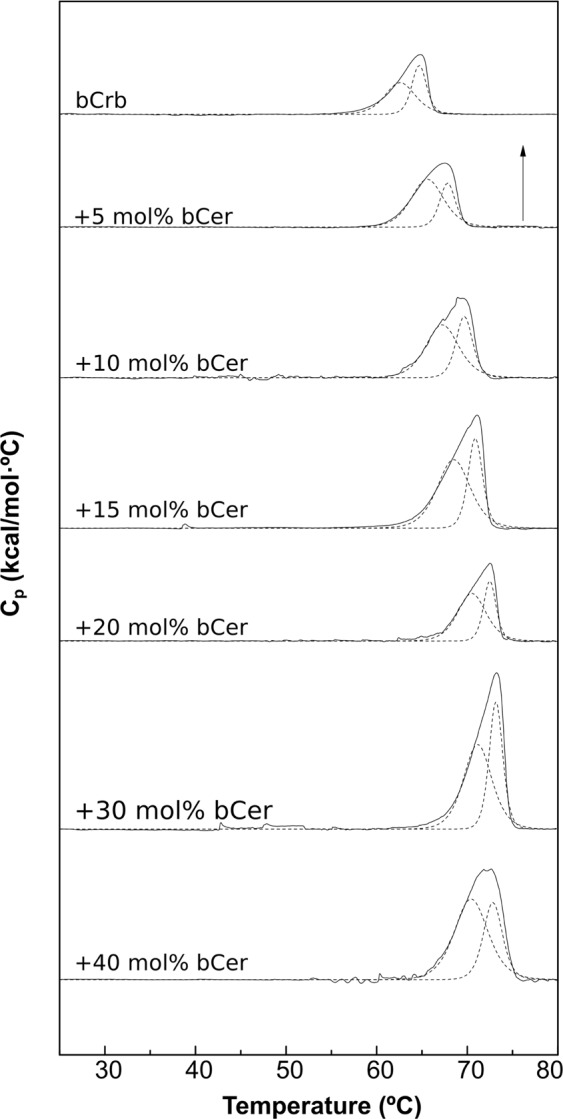
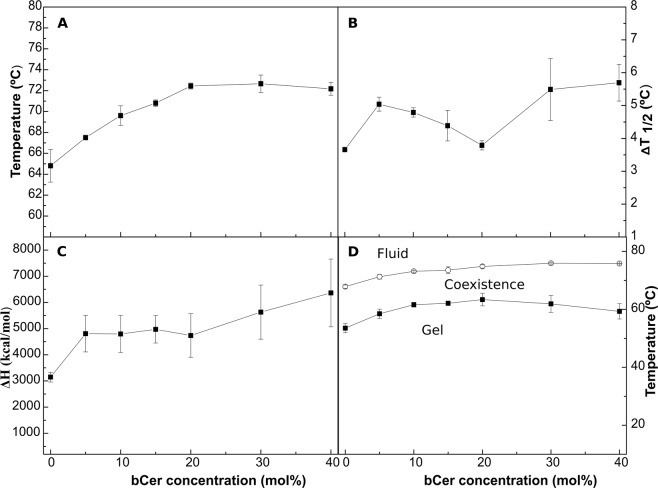
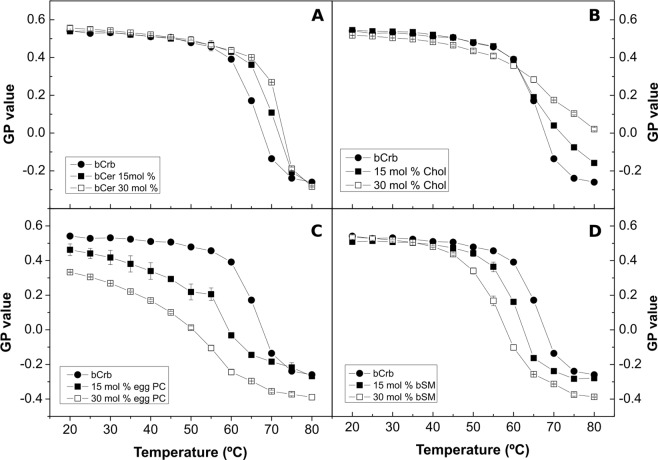
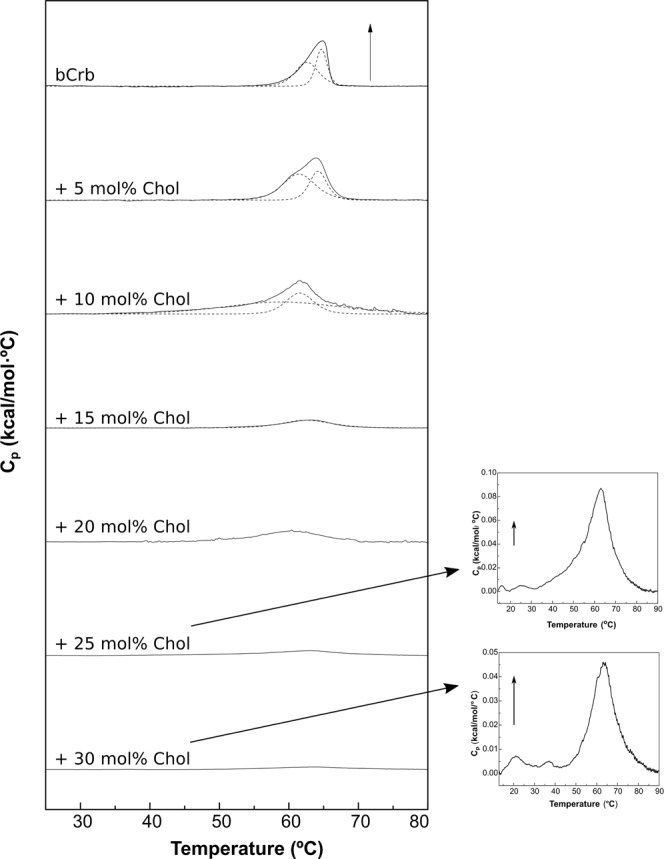
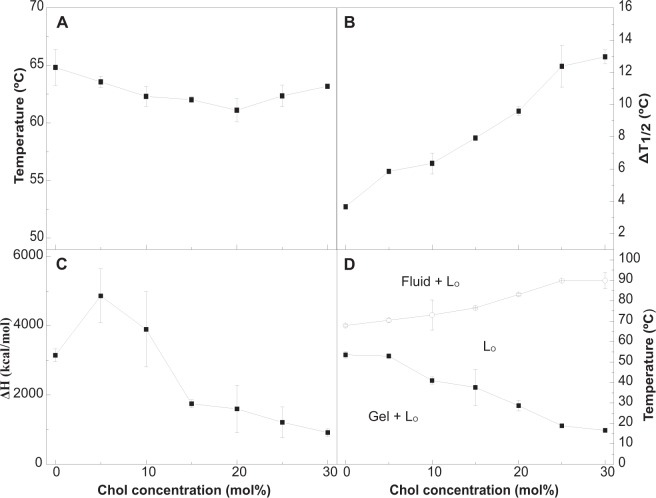
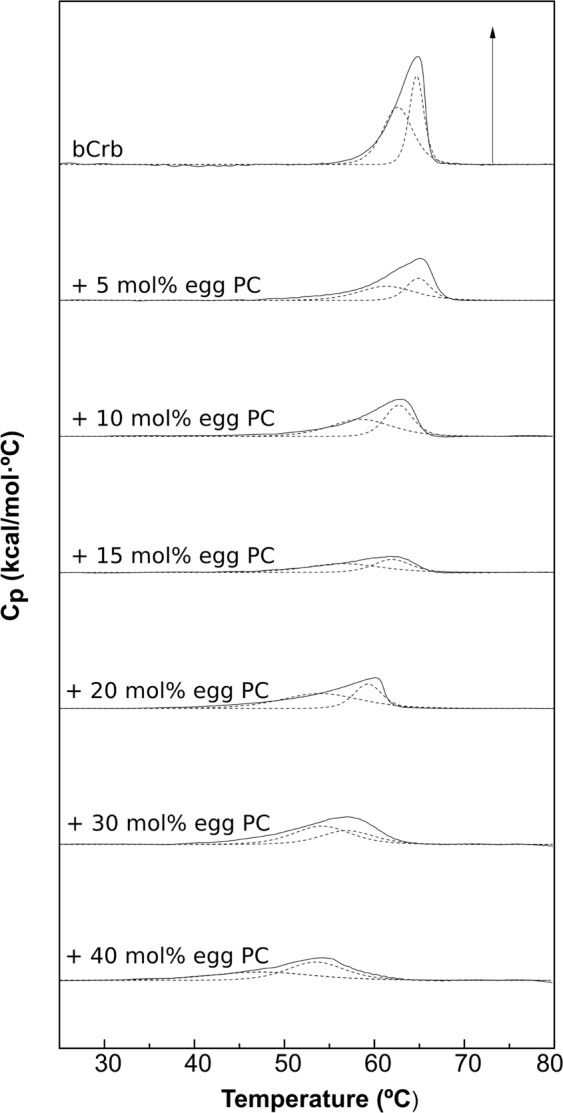
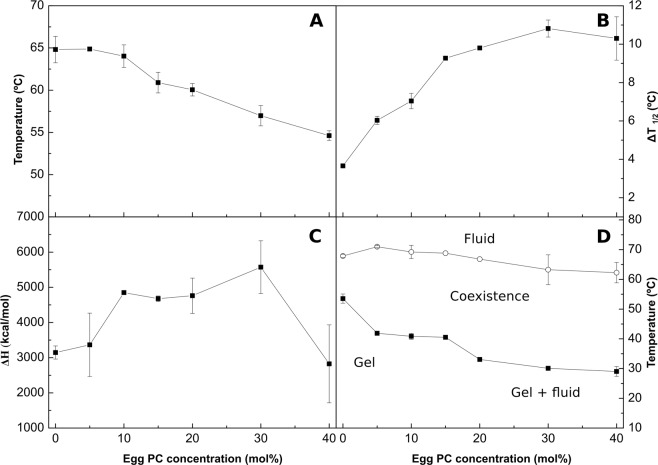
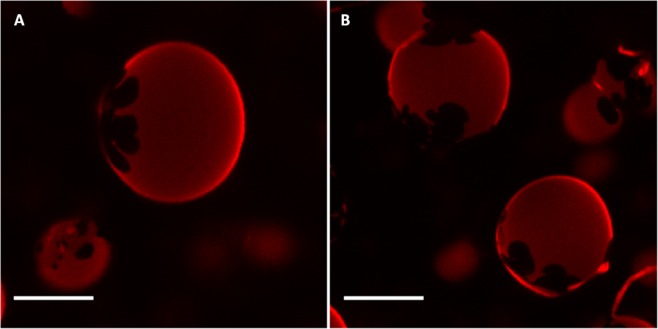
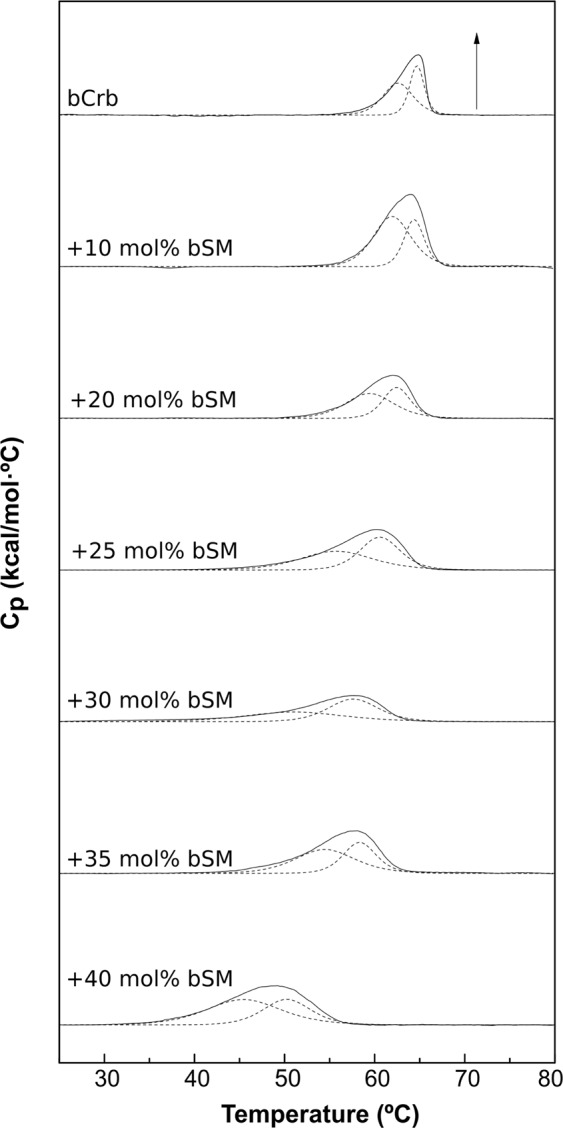
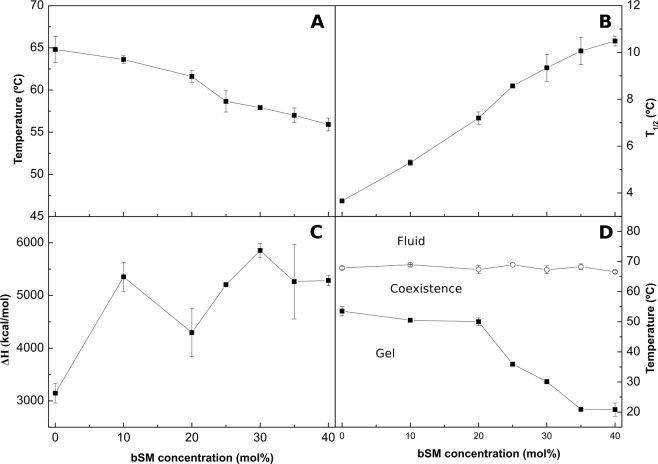
The properties of bilayers composed of pure brain cerebroside (bCrb) or of binary mixtures of bCrb with brain ceramide, cholesterol, egg phosphatidylcholine or brain sphingomyelin have been studied using a combination of physical techniques. Pure bCrb exhibits a rather narrow gel-fluid transition centred at ≈65 °C, with a half-width at half-height T1/2 ≈ 3 °C. bCrb mixes well with both fluid and gel phospholipids and ceramide, and it rigidifies bilayers of egg phosphatidylcholine or brain sphingomyelin when the latter are in the fluid state. Cholesterol markedly widens the bCrb gel-fluid transition, while decreasing the associated transition enthalpy, in the manner of cholesterol mixtures with saturated phosphatidylcholines, or sphingomyelins. Laurdan and DPH fluorescence indicate the formation of fluid ordered phases in the bCrb:cholesterol mixtures. Macroscopic phase separation of more and less fluid domains is observed in giant unilamellar vesicles consisting of bCrb:egg phosphatidylcholine or bCrb:sphingomyelin. Crb capacity to induce bilayer permeabilization or transbilayer (flip-flop) lipid motion is much lower than those of ceramides. The mixtures explored here contained mostly bCrb concentrations >50 mol%, mimicking the situation of cell membranes in Gaucher's disease, or of the Crb-enriched microdomains proposed to exist in healthy cell plasma membranes.


Conflict of interest statement

The authors declare no competing interests.

Figures

Figure 1
Figure 1
Gel-fluid thermothropic transition of bCrb in aqueous solution. Continuous line: DSC thermogram. The dotted curves correspond to the best fit of the endotherm to two Gaussian lines. Round symbols: Laurdan GP data (average ± S.D., triplicate). The arrows point to the apparent onset of the two endotherm components, as detected by discontinuities in the GP vs. T curve.
Figure 2
Figure 2
Representative DSC thermograms corresponding to the gel-fluid transition of pure bCrb and various bCrb:bCer mixtures in excess water. Mol percentage of bCer is indicated for each sample as a function of bCer concentration. Arrow: 1 kcal/mol/°C.
Figure 3
Figure 3
Thermodynamic parameters of bCrb:bCer mixtures. (A) Mid-point temperature of the gel-fluid transition. (B) Transition width at half-height. (C) Transition enthalpy, in cal/mol bCrb. (D) Temperature-composition diagram for the bCrb:bCer mixtures. The predominant phases are given for each area. (Average ± S.D., triplicate). Sometimes the errors are smaller than the symbols.
Figure 4
Figure 4
Thermotropic transitions of various bCrb-based bilayers, as detected through changes in Laurdan GP. Mixtures of bCrb with (A) bCer, (B) Chol, (C) egg PC, (D) bSM. (Average ± S.D., triplicate). Sometimes the errors are smaller than the symbols.
Figure 5
Figure 5
Representative DSC thermograms corresponding to the gel-fluid transition of pure bCrb and various bCrb:Chol mixtures in excess water. Mol percentage of Chol is indicated for each sample as a function of Chol concentration. Arrow: 1 kcal/mol/°C. Arrow (insets, 25 and 30 mol% Chol): 0.02 kcal/mol/°C.
Figure 6
Figure 6
Thermodynamic parameters of bCrb:Chol mixtures. (A) Mid-point temperature of the gel-fluid transition. (B) Transition width at half-height. (C) Transition enthalpy, in cal/mol bCrb. (D) Temperature-composition diagram for the bCrb:Chol mixtures. The predominant phases are given for each area. (Average ± S.D., triplicate). Sometimes the errors are smaller than the symbols.
Figure 7
Figure 7
Representative DSC thermograms corresponding to the gel-fluid transition of pure bCrb and various bCrb:egg PC mixtures in excess water. Mol percentage of egg PC is indicated for each sample as a function of egg PC concentration. Arrow: 1 kcal/mol/°C.
Figure 8
Figure 8
Thermodynamic parameters of bCrb:egg PC mixtures. (A) Mid-point temperature of the gel-fluid transition. (B) Transition width at half-height. (C) Transition enthalpy, in cal/mol bCrb. (D) Temperature-composition diagram for the bCrb:egg PC mixtures. The predominant phases are given for each area. (Average ± S.D., triplicate). Sometimes the errors are smaller than the symbols.
Figure 9
Figure 9
Confocal fluorescence microscopy of giant unilamellar vesicles of compositions: (A) bCrb:egg PC (60:40 mol ratio), (B) bCrb:bSM (60:40 mol ratio). Scale bars: 10 µm.
Figure 10
Figure 10
Representative DSC thermograms corresponding to the gel-fluid transition of pure bCrb and various bCrb:bSM mixtures in excess water. Mol percentage of bSM is indicated for each sample as a function of bSM concentration. Arrow: 1 kcal/mol/°C.
Figure 11
Figure 11
Thermodynamic parameters of bCrb:bSM mixtures. (A) Mid-point temperature of the gel-fluid transition. (B) Transition width at half-height. (C) Transition enthalpy, in cal/mol bCrb. (D) Temperature-composition diagram for the bCrb:bSM mixtures. The predominant phases are given for each area. (Average ± S.D., triplicate). Sometimes the errors are smaller than the symbols.
Figure 12
Figure 12
Cerebroside effects on bilayer permeabilization and phospholipid flip-flop. (A) Release of vesicular aqueous contents induced in LUV composed of egg PC:Chol (3:1) by addition of C16:0 Cer, C16:0 Crb, or C16:0 SM. (B) Transbilayer (flip-flop) motion of lipids in LUV composed of egg PC:Chol (3:1) by addition of C16:0 Cer, C16:0 Crb, or C16:0 SM. Average ± S.D (triplicate).

References

    1. Maggio B, Fanani ML, Rosetti CM, Wilke N. Biophysics of sphingolipids II. Glycosphingolipids: An assortment of multiple structural information transducers at the membrane surface. Biochim. Biophys. Acta - Biomembr. 2006;1758:1922–1944. doi: 10.1016/j.bbamem.2006.04.020. - DOI - PubMed
    1. Hoetzl S, Sprong H, van Meer G. The way we view cellular (glyco)sphingolipids. J. Neurochem. 2007;103(Suppl):3–13. doi: 10.1111/j.1471-4159.2007.04721.x. - DOI - PubMed
    1. Van Meer G, Wolthoorn J, Degroote S. The fate and function of glycosphingolipid glucosylceramide. Philos. Trans. R. Soc. B Biol. Sci. 2003;358:869–873. doi: 10.1098/rstb.2003.1266. - DOI - PMC - PubMed
    1. Lloyd-Evans E, et al. Glucosylceramide and glucosylsphingosine modulate calcium mobilization from brain microsomes via different mechanisms. J. Biol. Chem. 2003;278:23594–23599. doi: 10.1074/jbc.M300212200. - DOI - PubMed
    1. Varela ARP, et al. Pathological levels of glucosylceramide change the biophysical properties of artificial and cell membranes. Phys. Chem. Chem. Phys. 2017;19:340–346. doi: 10.1039/C6CP07227E. - DOI - PubMed

Publication types