. 2019 Sep 16;9(1):13304.
doi: 10.1038/s41598-019-49453-x.

Spaceflight influences gene expression, photoreceptor integrity, and oxidative stress-related damage in the murine retina

Affiliations

Spaceflight influences gene expression, photoreceptor integrity, and oxidative stress-related damage in the murine retina

Eliah G Overbey et al. Sci Rep. .

Abstract

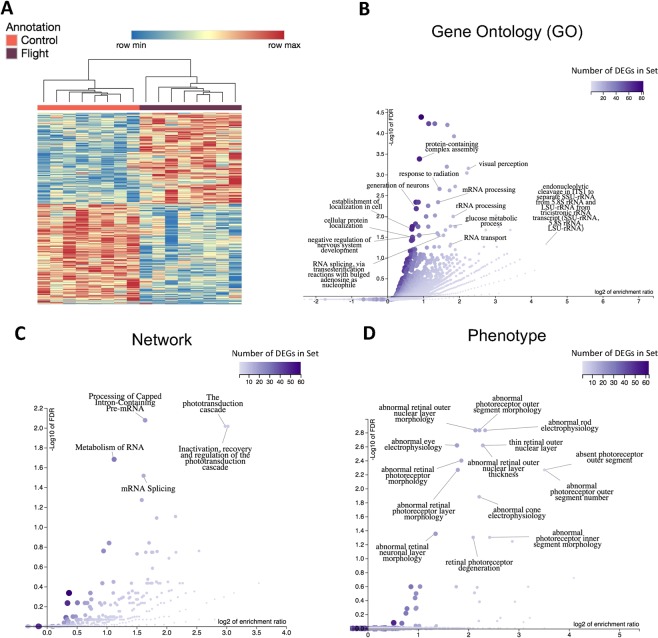
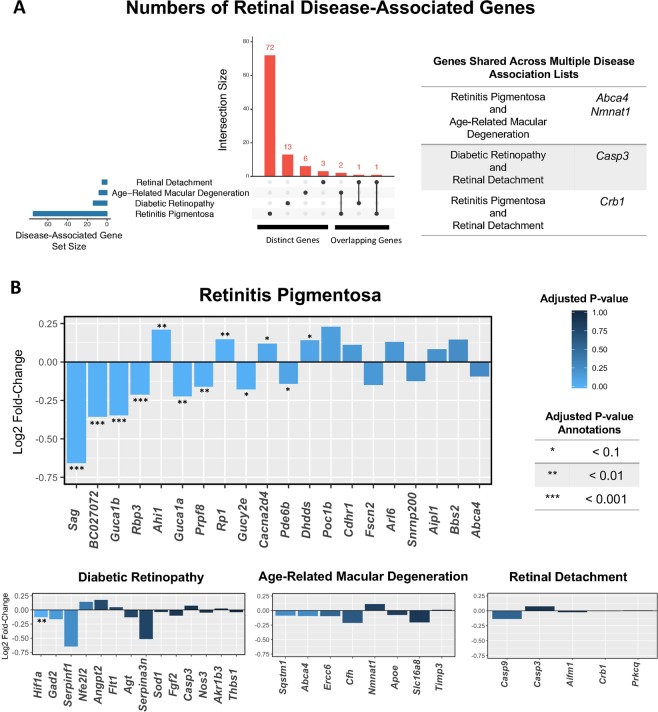
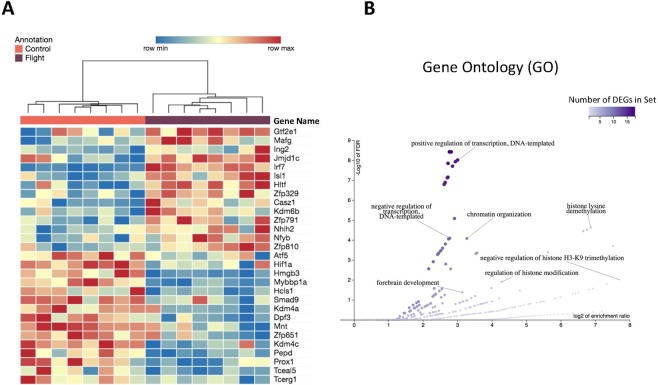
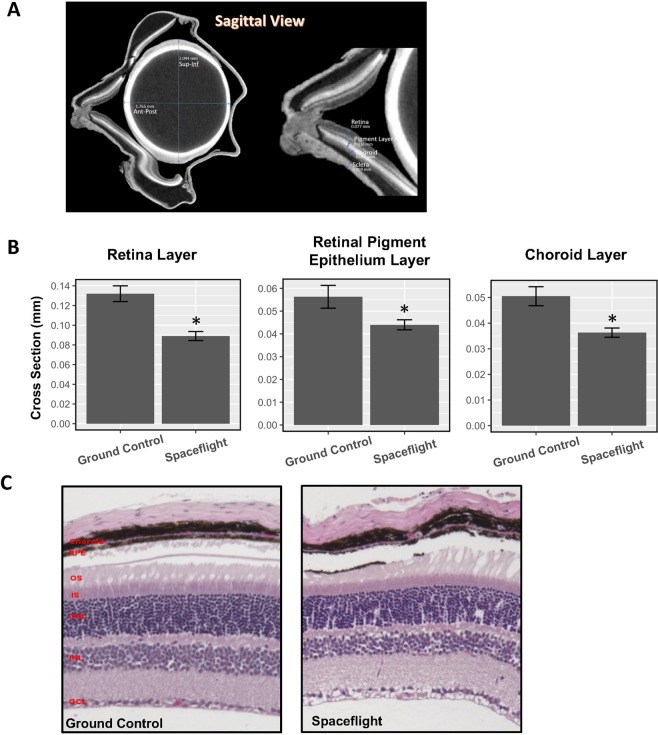
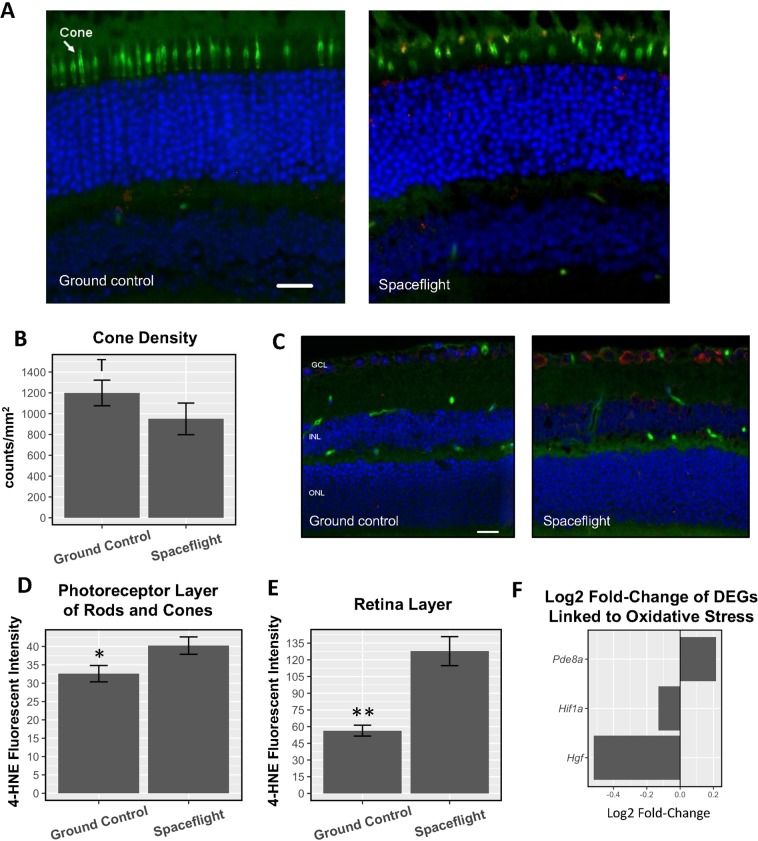
Extended spaceflight has been shown to adversely affect astronaut visual acuity. The purpose of this study was to determine whether spaceflight alters gene expression profiles and induces oxidative damage in the retina. Ten week old adult C57BL/6 male mice were flown aboard the ISS for 35 days and returned to Earth alive. Ground control mice were maintained on Earth under identical environmental conditions. Within 38 (+/-4) hours after splashdown, mice ocular tissues were collected for analysis. RNA sequencing detected 600 differentially expressed genes (DEGs) in murine spaceflight retinas, which were enriched for genes related to visual perception, the phototransduction pathway, and numerous retina and photoreceptor phenotype categories. Twelve DEGs were associated with retinitis pigmentosa, characterized by dystrophy of the photoreceptor layer rods and cones. Differentially expressed transcription factors indicated changes in chromatin structure, offering clues to the observed phenotypic changes. Immunofluorescence assays showed degradation of cone photoreceptors and increased retinal oxidative stress. Total retinal, retinal pigment epithelium, and choroid layer thickness were significantly lower after spaceflight. These results indicate that retinal performance may decrease over extended periods of spaceflight and cause visual impairment.


Conflict of interest statement

The authors declare no competing interests.

Figures

Figure 1
Figure 1
DEG clustering and functions between spaceflight and control mice. (A) Hierarchical clustering of the 600 DEGs between spaceflight and control mice using an adjusted p-value threshold of 0.1. The spaceflight group had 286 upregulated genes and 314 downregulated genes compared to the ground control; (B) Enriched gene ontology (GO) biological process categories for DEGs. The affinity propagation option from WebGestalt was applied to the select representative display categories; (C) Enriched networks among DEGs from the Reactome database; (D) Enriched phenotypes impacted by the DEGs from the Mammalian Phenotype Ontology; (BD) Overrepresented categories were found relating to ocular function (GO categories: ‘visual perception’, ‘response to light stimulus’, ‘sensory perception of light stimulus’, ‘retina development in camera-type eye’; Pathways: ‘the phototransduction cascade’ ‘inactivation, recovery and regulation of the phototransduction cascade’; Phenotype: electrophysiology, morphology, and degeneration of the retina, rods, and cones), various RNA processing, splicing, and metabolism functions (GO categories: ‘RNA processing’, ‘rRNA processing’, ‘mRNA processing’, ‘RNA splicing’, via transesterification reactions’, ‘mRNA splicing, via spliceosome’, ‘rRNA metabolic process’, ‘ncRNA metabolic process’, ‘mRNA metabolic process’, ‘RNA transport’), and direct responses to the physical pressures of spaceflight (GO categories: ‘response to abiotic stimulus’, ‘response to radiation’, ‘cellular response to stress’).
Figure 2
Figure 2
Retinal disease-associated gene expression. (A) UpSet diagram showing the number of genes in each disease set from DisGeNet. Genes that are distinct to each set are in the first four columns. Genes shared among sets are in the last three columns; (B) Log2 fold-change values of disease-associated genes. Genes are plotted from left to right in order of adjusted p-value. Bars are colored by the magnitude of the adjusted p-value. Adjusted p-values are further annotated based on their order of magnitude. The plot for retinitis pigmentosa displays the top 20 most significant genes based on adjusted p-value. All other diseases are displaying all of their associated genes.
Figure 3
Figure 3
Transcription factor clustering and functions between spaceflight and control mice. (A) Hierarchical clustering of the 29 DETFs between spaceflight and ground control mice; (B) Enriched gene ontology (GO) biological process categories for DETFs.
Figure 4
Figure 4
Spaceflight decreases the thickness of multiple layers of the eye. (A) Sagittal view of a ground control mouse. Layers of the eye on the right side of the image are annotated, from top-to-bottom, retina (0.077 mm), retina pigment layer (RPE, 0.038 mm), choroid (0.041 mm), sclera (0.059 mm); (B) Average thickness of the retinal layer, RPE layer, and the choroid layer measured by MicroCT in the spaceflight and control groups. Counts were averaged across five retinas per group. Values were represented as mean thickness + standard error (SEM). SEM of the mean is marked with error bars. Significantly lower in cross section thickness in the spaceflight group compared to the ground control group is denoted ‘*’ (p < 0.05). (C) Cross sections of the retina from control and spaceflight mice. GCL: ganglion cell layer; INL: inner nuclear layer; ONL: outer nuclear layer; IS: inner segment; OS: outer segment, RPE: pigment epithelium layer.
Figure 5
Figure 5
Spaceflight causes photoreceptor degradation and oxidative stress. (A) Immunofluorescence staining for PNA, a marker for cone photoreceptors (green), and HNE, a marker for oxidative stress (red), in the photoreceptor layer. The nuclei were counterstained with DAPI (blue); Scale bar = 50 mm. (B) Cell density for PNA–positive cone photoreceptors; (C) Immunofluorescence staining for HNE (red) in the retina layer. Scale bar = 50 µm; (D) Fluorescent intensity of the HNE marker in the photoreceptor layer of rods and cones (arrow); (E) Fluorescent intensity of the HNE marker across the retina; (F) Log2 fold-change of DEGs under the GO category “negative regulation of oxidative stress-induced cell death”; (B,D,E) Counts were averaged across five retinas per group. Values are represented as mean density ± SEM. Significance values of the spaceflight group compared to ground controls are denoted with ‘*’ (p < 0.05), ‘**’ (p < 0.01), and ‘T’ (strong trend differences between spaceflight and ground controls; p = 0.06).

References

    1. Dawson Linda. The Politics and Perils of Space Exploration. Cham: Springer International Publishing; 2016. The New Space Race; pp. 1–24.
    1. Mao XW, et al. Spaceflight environment induces mitochondrial oxidative damage in ocular tissue. Radiat. Res. 2013;180:340–350. doi: 10.1667/RR3309.1. - DOI - PubMed
    1. Overbey EG, et al. Mice Exposed to Combined Chronic Low-Dose Irradiation and Modeled Microgravity Develop Long-Term Neurological Sequelae. International Journal of Molecular Sciences. 2019;20(17):4094. doi: 10.3390/ijms20174094. - DOI - PMC - PubMed
    1. Nelson ES, Mulugeta L, Myers JG. Microgravity-induced fluid shift and ophthalmic changes. Life. 2014;4:621–665. doi: 10.3390/life4040621. - DOI - PMC - PubMed
    1. Lee AG, Mader TH, Robert Gibson C, Brunstetter TJ, Tarver WJ. Space flight-associated neuro-ocular syndrome (SANS) Eye. 2018;32:1164–1167. doi: 10.1038/s41433-018-0070-y. - DOI - PMC - PubMed

Publication types