. 2019 Sep 16;9(1):13344.
doi: 10.1038/s41598-019-50009-2.

Distinct effects of Q925 mutation on intracellular and extracellular Na+ and K+ binding to the Na+, K+-ATPase

Affiliations

Distinct effects of Q925 mutation on intracellular and extracellular Na+ and K+ binding to the Na+, K+-ATPase

Hang N Nielsen et al. Sci Rep. .

Abstract

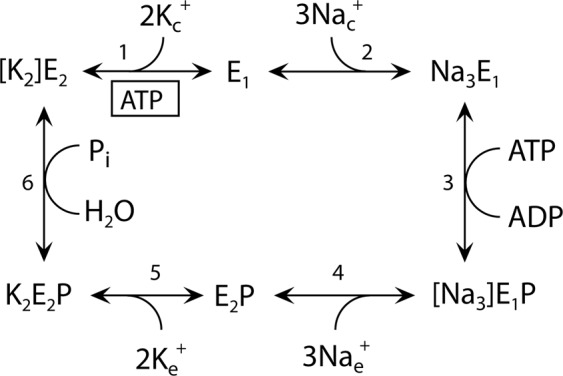
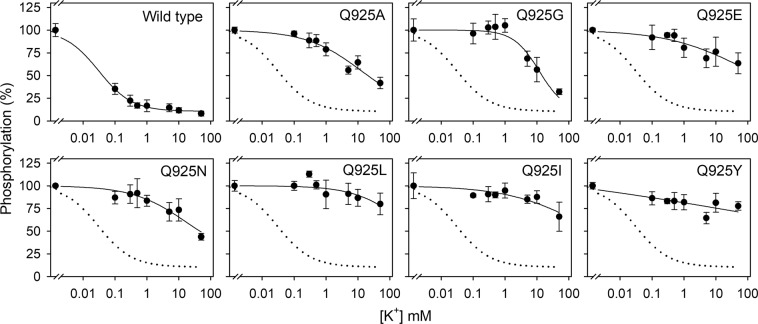
Three Na+ sites are defined in the Na+-bound crystal structure of Na+, K+-ATPase. Sites I and II overlap with two K+ sites in the K+-bound structure, whereas site III is unique and Na+ specific. A glutamine in transmembrane helix M8 (Q925) appears from the crystal structures to coordinate Na+ at site III, but does not contribute to K+ coordination at sites I and II. Here we address the functional role of Q925 in the various conformational states of Na+, K+-ATPase by examining the mutants Q925A/G/E/N/L/I/Y. We characterized these mutants both enzymatically and electrophysiologically, thereby revealing their Na+ and K+ binding properties. Remarkably, Q925 substitutions had minor effects on Na+ binding from the intracellular side of the membrane - in fact, mutations Q925A and Q925G increased the apparent Na+ affinity - but caused dramatic reductions of the binding of K+ as well as Na+ from the extracellular side of the membrane. These results provide insight into the changes taking place in the Na+-binding sites, when they are transformed from intracellular- to extracellular-facing orientation in relation to the ion translocation process, and demonstrate the interaction between sites III and I and a possible gating function of Q925 in the release of Na+ at the extracellular side.


Conflict of interest statement

The authors declare no competing interests.

Figures

Figure 1
Figure 1
Na+, K+-ATPase reaction cycle. E1 and E2 represent the main conformational states of the enzyme. P indicates phosphorylated states. E1P and E2P are the respective ADP-sensitive and ADP-insensitive (K+ sensitive) phosphoenzyme intermediates. Occluded Na+ and K+ ions are shown in brackets. Free ions are labelled c and e for cytoplasmic and extracellular side, respectively. Boxed ATP indicates ATP bound in a non-phosphorylating mode, enhancing the rate of K+ deocclusion, and accompanying E2-E1 conformational change. The partial reactions of the cycle are numbered 1–6.
Figure 2
Figure 2
Na+ dependence of phosphorylation. Phosphorylation was carried out for 10 s at 0 °C with 2 μM [γ-32P]ATP in 20 mM Tris (pH 7.5), 3 mM MgCl2, 1 mM EGTA, 20 μg oligomycin/ml (to prevent dephosphorylation), ouabain to inhibit the endogenous COS-1 cell Na+, K+-ATPase (10 μM for stably expressed enzyme and 100 μM for transiently expressed enzyme), and various concentrations of NaCl (and NMG+ to maintain the same ionic strength at all NaCl concentrations). For further details, see Methods. Symbols with error bars represent mean ± s.d. Open and closed symbols represent transiently and stably expressed enzyme, respectively. Each line represents the best fit of a Hill function (Eq. 1 of Methods). Extracted K0.5 values are listed in Table 1 with statistical information. Dotted lines reproduce the corresponding wild type for direct comparison in the same panel (only the stably expressed wild type is shown in the panel with Q925A).
Figure 3
Figure 3
K+ inhibition of phosphorylation. Phosphorylation with [γ-32P]ATP was carried out for 10 s at 0 °C with 2 μM [γ-32P]ATP in 20 mM Tris (pH 7.5), 50 mM NaCl, 3 mM MgCl2, 1 mM EGTA, ouabain to inhibit the endogenous COS-1 cell Na+, K+-ATPase, and various concentrations of KCl (with choline chloride to maintain a constant ionic strength). In these experiments, oligomycin was absent to allow dephosphorylation. For further details, see Methods. Symbols with error bars represent mean ± s.d. Each line represents the best fit of Eq. 2 of Methods. Extracted IC50 values are listed in Table 1 with statistical information. Dotted lines reproduce the wild type for direct comparison in the same panel.
Figure 4
Figure 4
ATPase activity of stably expressed Q925A and Q925G mutants. The ATPase activity was determined at 37 °C in medium containing 30 mM histidine (pH 7.4), 1 mM EGTA, 3 mM MgCl2, and 3 mM ATP, together with the NaCl, KCl, and ouabain additions indicated below. Symbols and columns with error bars represent mean ± s.d. The lines show the best fits of the equations from Methods indicated below. Extracted parameters are listed in Table 2. Turnover rates were calculated as the ratio between the ATPase activity and the active site concentration (see Methods). (a) Medium additions: 130 mM NaCl, 20 mM KCl, and 10 μM ouabain. Individual data points are shown as grey circles. (b) Medium additions: 40 mM NaCl, 10 μM ouabain, and KCl as indicated. The extrapolated value corresponding to infinite K+ concentration was taken as 100%. Eq. (1) used for fitting. (c) Medium additions: 130 mM NaCl, 20 mM KCl, and ouabain as indicated. Eq. (3) used for fitting. (d) Medium additions: 20 mM KCl, 10 μM ouabain, and NaCl as indicated. The maximum was taken as 100%. K0.5 values for activation obtained by fitting Eq. 1. to the rising part of the Na+ dependence are listed in Table 2. The inhibition phase at high Na+ concentrations is caused by competition of Na+ with K+ at extracellular-facing sites due to low K+ affinity of the mutants. (e) Medium additions: 10 μM ouabain and NaCl as indicated, no KCl was present.
Figure 5
Figure 5
K+-concentration dependence of Na+, K+-ATPase currents in oocytes. (ac) Representative current recordings at –50 mV (black, red, and blue traces). (a) Wild type-injected oocyte exposed to increasing concentrations of K+ (black lines) while bathed in NMG+ solution. K+-induced currents were fully saturated at 3 mM K+. (b) A similar experiment in an oocyte injected with Q925A. Here, much larger K+ concentrations (black lines) were required to activate Na+, K+-ATPase currents. Ouabain (10 mM, orange line) completely inhibited the K+-induced currents. (c) An oocyte injected with Q925L was exposed to 10 mM K+ (black line) followed by 10 mM ouabain (orange line), in NMG+ solution. Upon ouabain withdrawal in Na+ solution (black line) to recover from ATPase inhibition, the solution was switched to NMG+ where 25 mM K+ and subsequently ouabain were applied, uncovering Na+, K+-ATPase currents. The manoeuvres were repeated with 50 and 125 mM K+. (d) K+-concentration dependence of the current at –50 mV. Data points represent the mean ± s.d. Line plots are the Hill equations (Eq. 4. in Methods) fitted to the data from individual oocytes, with the K0.5 and statistics shown in Table 3. The global fit of the experiments used a single Hill coefficient shared among all the experiments for each mutant, with values n = 1.3 ± 0.1 for wild type, n = 1.3 ± 0.1 for Q925A and n = 1.8 ± 0.2 for Q925L (s.e.m. values as obtained from the fitting program). For wild type, the K+-induced currents obtained in the absence of ouabain are shown. For Q925A and Q925L, the ouabain-inhibited part of the currents are shown at all K+ concentrations, thereby eliminating contributions from K+ channels at high K+ concentrations.
Figure 6
Figure 6
Transient charge movement in 125 mM Na+ without external K+. (ad) Ouabain-sensitive currents elicited by voltage pulses from –50 mV to –180 mV (cyan), −140 mV (green), −100 mV (magenta), −60 mV (blue), −20 mV (red) and + 20 mV (black), in representative oocytes injected with wild type (a), Q925A (b), Q925L (c) and Q925E (d). (e) Normalized charge-voltage plots. Data points represent the mean ± s.d. Line plots are Boltzmann distributions (Eq. 5 in Methods) fitted to individual experiments with slope factors 38 mV for wild type, 46 mV for Q925A, 48 mV for Q925L, and 46 mV for Q925E. V0.5 values, and the corresponding fold changes in Na+ affinity calculated, are shown in Table 3 with further information on statistics.
Figure 7
Figure 7
Ion-binding sites in Na+, K+-ATPase crystal structures with indication of Q925 (Gln925) and other relevant site-III residues. (a) Na+-bound [Na3]E1·AlF4 ADP form (mimicking the transition state between Na3E1 and [Na3]E1P, see Fig. 1), Protein Data Bank code 3WGV, chain A (protomer B). Na+ ions are shown as pink spheres numbered I, II, and III according to standard nomenclature. (b) K+-bound [K2]E2·MgF42– form (mimicking the [K2]E2·Pi intermediate between K2E2P and [K2]E2), Protein Data Bank code 2ZXE. K+ ions are shown as green spheres numbered I and II, and the associated water molecule is red. View along the plane of the membrane with the intracellular side up, for both structures. Selected residues are shown in stick representation coloured according to the elements (carbon, grey; oxygen, red; nitrogen, blue) and numbered according to the rat α1-isoform (Q925 of rat α1 corresponds to Q923 and Q930 in the crystallized pig α1 and shark rectal gland enzymes, respectively). Broken lines indicate potential hydrogen bonds or coordination bonds between ions and oxygen ligands of residue side chains.

Similar articles

Cited by

References

    1. Skou JC. The influence of some cations on an adenosine triphosphatase from peripheral nerves. Biochim. Biophys. Acta. 1957;23:394–401. doi: 10.1016/0006-3002(57)90343-8. - DOI - PubMed
    1. Post RL, Hegyvary C, Kume S. Activation by adenosine triphosphate in the phosphorylation kinetics of sodium and potassium ion transport adenosine triphosphatase. J. Biol. Chem. 1972;247:6530–6540. - PubMed
    1. Glynn IM. Annual review prize lecture. All hands to the sodium pump. J. Physiol. 1993;462:1–30. doi: 10.1113/jphysiol.1993.sp019540. - DOI - PMC - PubMed
    1. Kaplan JH. Biochemistry of Na,K-ATPase. Annu. Rev. Biochem. 2002;71:511–535. doi: 10.1146/annurev.biochem.71.102201.141218. - DOI - PubMed
    1. Jewell-Motz EA, Lingrel JB. Site-directed mutagenesis of the Na,K-ATPase: consequences of substitutions of negatively-charged amino acids localized in the transmembrane domains. Biochemistry. 1993;32:13523–13530. doi: 10.1021/bi00212a018. - DOI - PubMed

Publication types