. 2019 Oct;20(10):1335-1347.
doi: 10.1038/s41590-019-0480-4. Epub 2019 Sep 16.

PTPN2 regulates the generation of exhausted CD8+ T cell subpopulations and restrains tumor immunity

Affiliations

PTPN2 regulates the generation of exhausted CD8+ T cell subpopulations and restrains tumor immunity

Martin W LaFleur et al. Nat Immunol. 2019 Oct.

Abstract

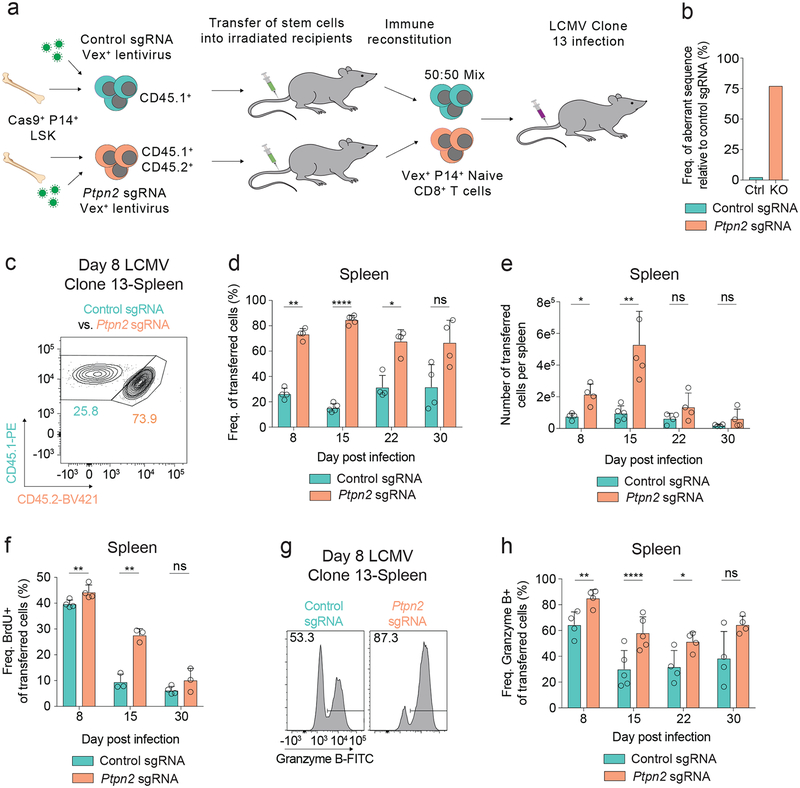
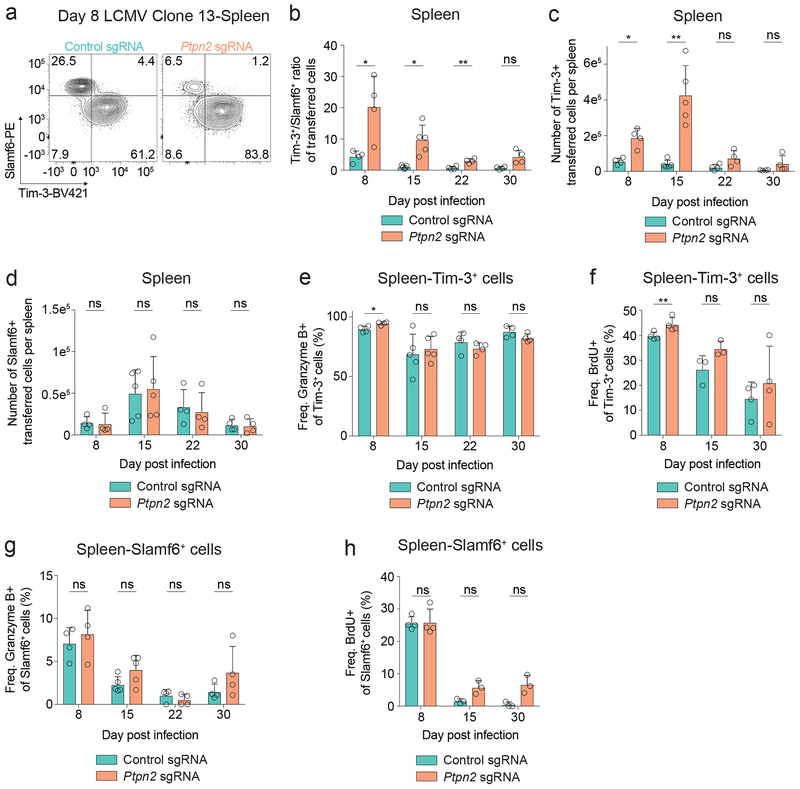
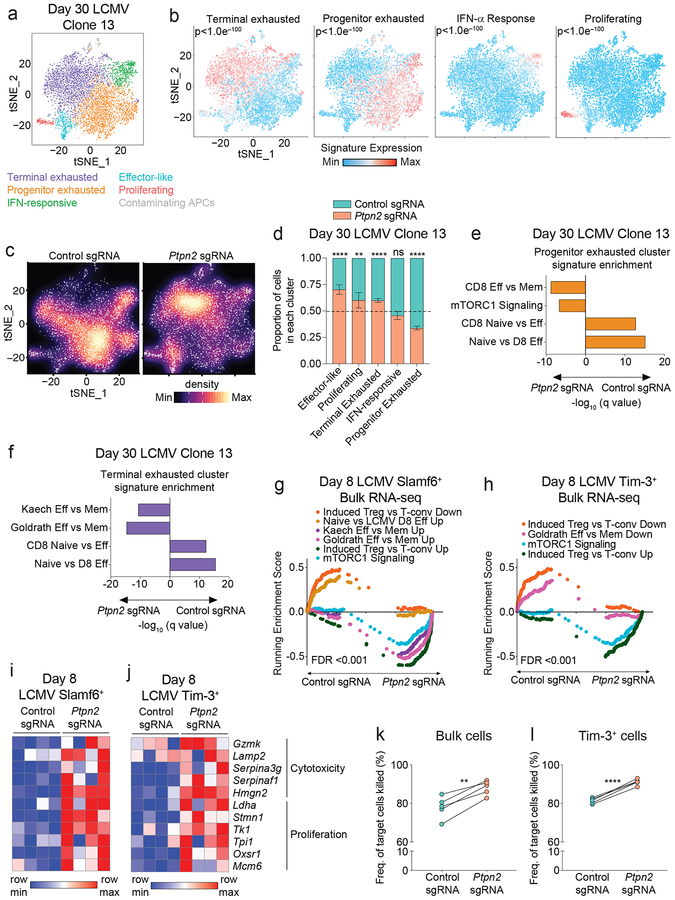
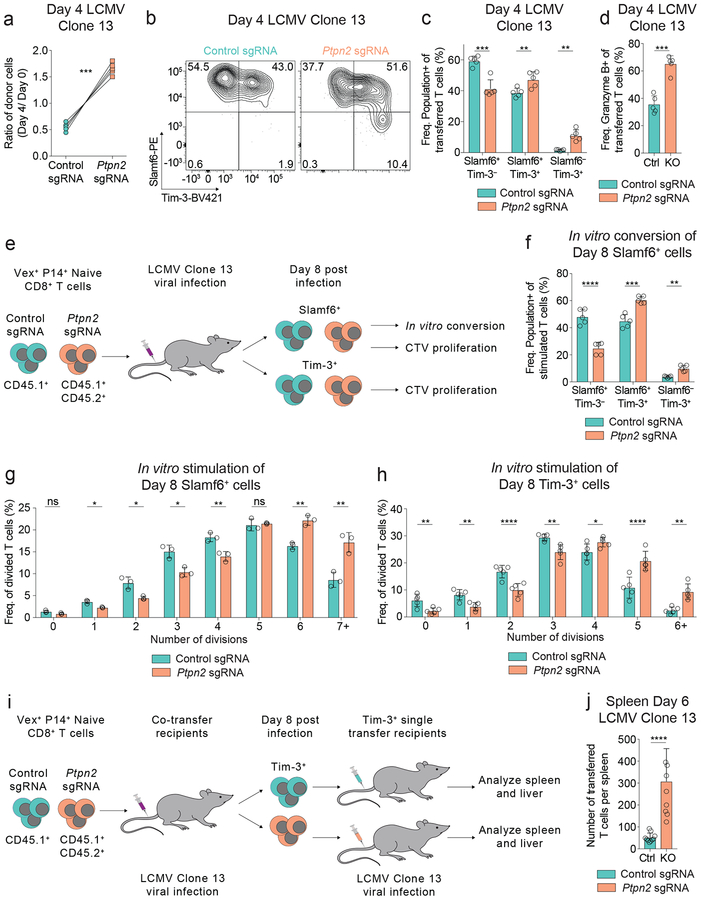
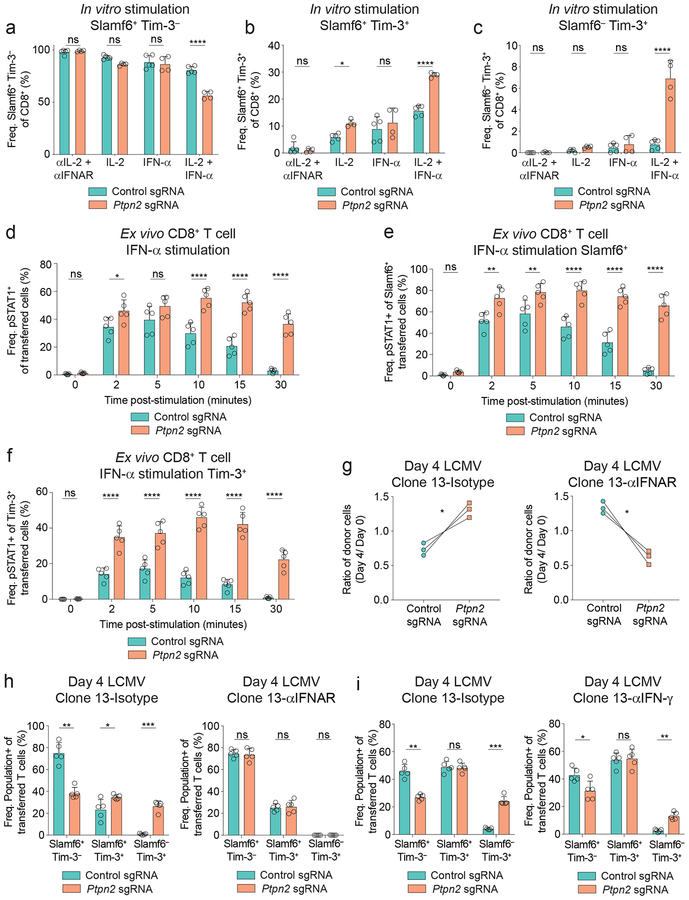
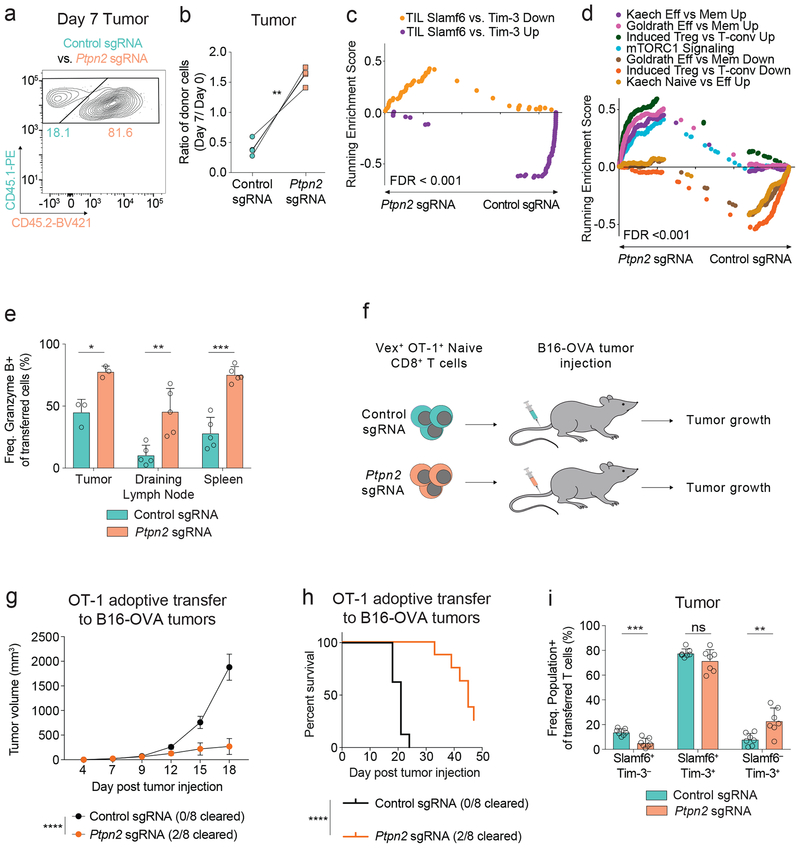
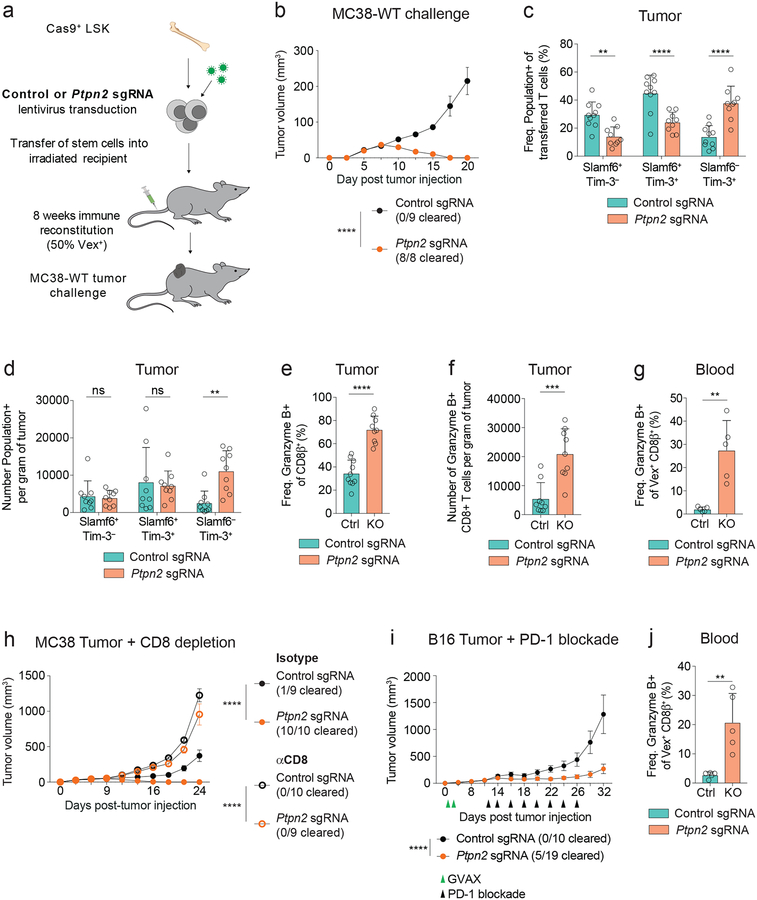
CD8+ T cell exhaustion is a state of dysfunction acquired in chronic viral infection and cancer, characterized by the formation of Slamf6+ progenitor exhausted and Tim-3+ terminally exhausted subpopulations through unknown mechanisms. Here we establish the phosphatase PTPN2 as a new regulator of the differentiation of the terminally exhausted subpopulation that functions by attenuating type 1 interferon signaling. Deletion of Ptpn2 in CD8+ T cells increased the generation, proliferative capacity and cytotoxicity of Tim-3+ cells without altering Slamf6+ numbers during lymphocytic choriomeningitis virus clone 13 infection. Likewise, Ptpn2 deletion in CD8+ T cells enhanced Tim-3+ anti-tumor responses and improved tumor control. Deletion of Ptpn2 throughout the immune system resulted in MC38 tumor clearance and improved programmed cell death-1 checkpoint blockade responses to B16 tumors. Our results indicate that increasing the number of cytotoxic Tim-3+CD8+ T cells can promote effective anti-tumor immunity and implicate PTPN2 in immune cells as an attractive cancer immunotherapy target.


Conflict of interest statement

Competing Financial Interests Statement

A.H.S. has patents on the PD-1 pathway licensed by Roche/Genentech and Novartis, consults for Novartis, is on the scientific advisory boards for Surface Oncology, Sqz Biotech, Elstar Therapeutics, Elpiscience, Selecta, and Monopteros, and has research funding from Merck, Novartis, Roche, Ipsen, UCB and Quark Ventures. W.N.H. has a patent application on T cell exhaustion-specific enhancers held by Dana-Farber Cancer Institute and now is employed by Merck. W.N.H. is also a founder of Arsenal Biosciences. A.H.S. and W.N.H. have a patent application on PTPN2 as a therapeutic target held/submitted by Dana-Farber Cancer Institute. G.J.F. has a consulting or advisory role for Novartis, Lilly, Roche/Genentech, Bristol-Myers Squibb, Bethyl Laboratories, Xios Therapeutics, Quiet Therapeutics, Seattle Genetics; patents, royalties, or other intellectual property from Novartis, Roche/Genentech, Bristol-Myers Squibb/Medarex, Amplimmune/Astrazeneca, Merck, EMD Serono, Boehringer Ingelheim and research funding from Bristol-Myers Squibb. The remaining authors declare no competing interests.

Figures

Figure 1:
Figure 1:. Loss of Ptpn2 promotes the early proliferation of CD8+ T cells during LCMV Clone 13 infection
(a) Schematic of co-transfer experiment during LCMV Clone 13 infections. Chimeric mice were generated using the CHIME system. (b) TIDE assay on naïve CD8+ T cells for a control and Ptpn2-targeting sgRNA. Representative of four independent experiments, n = 1 mouse. (c) Representative flow cytometry plot of co-transferred control or Ptpn2-deleted P14 T cells in the spleen 8 days post LCMV Clone 13 infection. Representative of eight independent experiments, n ≥ 4 mice. (d-e) Frequency of CD45.1+ transferred cells (d) and number (e) of control or Ptpn2-deleted P14 T cells in the spleen 8, 15, 22, and 30 days post LCMV Clone 13 infection. Representative of two independent experiments, n ≥ 4 mice. (f) Quantification of BrdU incorporation for co-transferred control and Ptpn2-deleted P14 T cells 8, 15, and 30 days post LCMV Clone 13 infection. Representative of two independent experiments, n ≥ 3 mice. (g) Representative flow cytometry plots of Granzyme B expression from splenic control or Ptpn2-deleted P14 CD8+ T cells co-transferred at day 8 post LCMV Clone 13 infection as in (c). Representative of two independent experiments, n ≥ 4 mice. (h) Quantification of (g) days 8, 15, 22, and 30 post LCMV Clone 13 infection. Representative of two independent experiments, n ≥ 4 mice. Bar graphs represent mean and error bars represent standard deviation. Statistical significance was assessed by two-sided Student’s paired t-test (d, e, f, h) (ns p>.05, * p≤.05, ** p≤.01, *** p≤.001, **** p≤.0001). See also Supplementary Figure 1.
Figure 2:
Figure 2:. Deletion of Ptpn2 enhances formation of the Tim-3+ terminally exhausted subpopulation during LCMV Clone 13 infection
(a) Representative flow cytometry plots of Tim-3 and Slamf6 expression on control or Ptpn2-deleted P14 T cells in the spleen 8 days post LCMV Clone 13 infection. Representative of eight independent experiments, n ≥ 4 mice. (b) Ratio of Tim-3+/Slamf6+ control or Ptpn2-deleted P14 T cells in the spleen 8, 15, 22, and 30 days post LCMV Clone 13 infection. Representative of two independent experiments, n ≥ 4 mice. (c) Number of Tim-3+ control or Ptpn2-deleted P14 T cells in the spleen 8, 15, 22, and 30 days post LCMV Clone 13 infection. Representative of two independent experiments, n ≥ 4 mice. (d) Number of Slamf6+ control or Ptpn2-deleted P14 T cells in the spleen 8, 15, 22, and 30 days post LCMV Clone 13 infection. Representative of two independent experiments, n ≥ 4 mice. (e) Quantification of Granzyme B expression for Tim-3+ control or Ptpn2-deleted P14 T cells in the spleen 8, 15, 22, and 30 days post LCMV Clone 13 infection. Representative of two independent experiments, n ≥ 4 mice. (f) Quantification of BrdU incorporation for Tim-3+ control or Ptpn2-deleted P14 T cells in the spleen 8, 15, and 30 days post LCMV Clone 13 infection. Representative of two independent experiments, n ≥ 3 mice. (g) Quantification of Granzyme B expression for Slamf6+ control or Ptpn2-deleted P14 T cells in the spleen 8, 15, 22, and 30 days post LCMV Clone 13 infection. Representative of two independent experiments, n ≥ 4 mice. (h) Quantification of BrdU incorporation for Slamf6+ control or Ptpn2-deleted P14 T cells in the spleen 8, 15, and 30 days post LCMV Clone 13 infection. Representative of two independent experiments, n ≥ 3 mice. Bar graphs represent mean and error bars represent standard deviation. Statistical significance was assessed by two-sided Student’s paired t-test (b-h) (ns p>.05, * p≤.05, ** p≤.01, *** p≤.001, **** p≤.0001). See also Supplementary Figure 2.
Figure 3:
Figure 3:. Ptpn2 deletion promotes effector-skewed Slamf6+ and Tim-3+ subpopulations during LCMV infection
(a) tSNE projection of single-cell RNA-seq profiles from 7,027 control or Ptpn2-deleted P14+ CD8+ T cells responding to day 30 LCMV Clone 13 infection. Clusters are distinct colors. Representative of one experiment, n = 4 pooled mice. (b) Enrichment of gene signatures in the clusters. Representative of one experiment, n = 4 pooled mice. (c) Plots depicting the inter-cluster density for control or Ptpn2-deleted cells. Representative of one experiment, n = 4 pooled mice. (d) Quantification of the proportion of control or Ptpn2-deleted cells in each cluster. Error bars represent the 95% confidence interval and the dotted line represents the proportion of Ptpn2-deleted cells among all cells projected. Representative of one experiment, n = 4 pooled mice. (e-f) Signature enrichments of co-transferred control and Ptpn2-deleted cells from the (e) progenitor or (f) terminally exhausted clusters. Representative of one experiment, n = 4 pooled mice. (g-h) GSEA curves for significantly enriched signatures in (g) Slamf6+ cells and (h) Tim-3+ cells for bulk RNA-seq of co-transferred control and Ptpn2-deleted cells day 8 post LCMV Clone 13 infection. Representative of one experiment, n = 2 mice with n = 2 technical replicates per mouse. (i-j) Row-normalized heat map of effector-associated genes in (i) Slamf6+ cells and (j) Tim-3+ cells for bulk RNA-seq of co-transferred control and Ptpn2-deleted cells day 8 post LCMV Clone 13 infection. Representative of one experiment, n = 2 mice with n = 2 technical replicates per mouse. (k) Quantification of frequency of tumor cells killed when co-cultured with control or Ptpn2-deleted CD8+ T cells (2:1 effector: target ratio) isolated from day 8 LCMV Clone 13 infection. Representative of two independent experiments, n = 5 mice. (l) Quantification of frequency of tumor cells killed when co-cultured with Tim-3+ control or Tim-3+ Ptpn2-deleted CD8+ T cells (2:1 effector: target ratio) isolated from day 8 LCMV Clone 13 infection. Representative of two independent experiments, n = 5 mice. Statistical significance was assessed by the two-sided Wilcoxon rank sum test (b, e, f), two-sided binomial test (d), two-sided Kolmogorov-Smirnov test (g-h), and two-sided Student’s paired t-test (k-l) (ns p>.05, * p≤.05, ** p≤.01, *** p≤.001, **** p≤.0001). See also Supplementary Figure 3.
Figure 4:
Figure 4:. Ptpn2 deletion increases Tim-3+ cell differentiation and proliferation
(a) Quantification of frequencies of co-transferred control or Ptpn2-deleted CD8+ T cells day 4 post LCMV Clone 13 infection. Frequencies at day 4 were normalized to input frequencies at day 0. Representative of two independent experiments, n = 5 mice. (b) Representative flow cytometry plots of Slamf6 and Tim-3 expression on splenic CD8+ T cells day 4 post LCMV Clone 13 infection for co-transferred control and Ptpn2-deleted cells. Representative of two independent experiments, n = 5 mice. (c) Quantification of Slamf6+ Tim-3, Slamf6+ Tim-3+, and Slamf6 Tim-3+ subsets in (b). Representative of two independent experiments, n = 5 mice. (d) Quantification of Granzyme B expression of cells as in (a). Representative of two independent experiments, n = 5 mice. (e) Schematic of in vitro conversion and CTV proliferation assays using co-transferred control or Ptpn2-deleted CD8+ T cells isolated at day 8 post LCMV Clone 13 infection. (f) Quantification of Slamf6+ Tim-3, Slamf6+ Tim-3+, and Slamf6 Tim-3+ subsets following in vitro stimulation (αCD3/CD28 with IL-2 and IFN-α) of control or Ptpn2-deleted CD8+ T cells isolated at day 8 post LCMV Clone 13 infection. Representative of two independent experiments, n = 5 mice. (g-h) Quantification of frequency of divisions following in vitro stimulation (αCD3/CD28 with IL-2) of (g) CTV-labeled Slamf6+ or (h) CTV-labeled Tim-3+, control or Ptpn2-deleted CD8+ T cells isolated at day 8 post LCMV Clone 13 infection. Representative of two independent experiments, n = 3 mice (g), 5 mice (h). (i) Schematic of in vivo persistence assay of Tim-3+ cells. (j) Quantification of number of recovered Tim-3+ control or Ptpn2-deleted cells in the spleen day 6 post LCMV Clone 13 infection, following the transfer of these cells which were previously isolated at day 8 post LCMV Clone 13 infection. Representative of two pooled experiments, n = 8 mice. Bar graphs represent mean and error bars represent standard deviation. Statistical significance was assessed by two-sided Student’s paired t-test (a, c-d, f-h) or two-sided Student’s unpaired t-test (j) (ns p>.05, * p≤.05, ** p≤.01, *** p≤.001, **** p≤.0001). See also Supplementary Figure 4.
Figure 5:
Figure 5:. Ptpn2 deletion increases Tim-3+ cell differentiation through enhanced IFN-α signaling
(a-c) Quantification of (a) Slamf6+ Tim-3, (b) Slamf6+ Tim-3+, and (c) Slamf6 Tim-3+ subsets following in vitro stimulation (αCD3/CD28) of control or Ptpn2-deleted naive CD8+ T cells in the presence of indicated cytokines or blocking antibodies. Representative of two pooled experiments, n ≥ 4 technical replicates. (d) Quantification of pSTAT1 expression of splenic CD8+ T cells day 6 post LCMV Clone 13 infection for co-transferred control and Ptpn2-deleted cells following ex vivo restimulation with IFN-α. Representative of two independent experiments, n = 5 biological replicates. (e-f) Quantification of pSTAT1 in (e) Slamf6+ or (f) Tim-3+ cells following ex vivo IFN-α restimulation of co-transferred control and Ptpn2-deleted cells as in (d). Representative of two independent experiments, n = 5 biological replicates. (g) Quantification of frequencies of co-transferred control and Ptpn2-deleted CD8+ T cells day 4 post LCMV Clone 13 infection following treatment with isotype (left graph) or IFNAR blocking antibody (right graph). Frequencies at day 4 were normalized to input frequencies at day 0. Representative of two independent experiments, n = 3 biological replicates. (h) Quantification of Slamf6+ Tim-3, Slamf6+ Tim-3+, and Slamf6 Tim-3+ subsets day 4 post LCMV Clone 13 infection in mice that received co-transferred control and Ptpn2-deleted P14 CD8+ T cells and were treated with isotype (left) or IFNAR blocking antibody (right). Representative of two independent experiments, n = 5 biological replicates. (i) Quantification of Slamf6+ Tim-3, Slamf6+ Tim-3+, and Slamf6 Tim-3+ subsets day 4 post LCMV Clone 13 infection in mice that received co-transferred control and Ptpn2-deleted P14 CD8+ T cells and were treated with isotype (left) or IFN-γ neutralizing antibody (right). Representative of two independent experiments, n = 5 biological replicates. Bar graphs represent mean and error bars represent standard deviation. Statistical significance was assessed by two-way ANOVA (a-c) or two-sided Student’s paired t-test (d-i) (ns p>.05, * p≤.05, ** p≤.01, *** p≤.001, **** p≤.0001). See also Supplementary Figure 5.
Figure 6:
Figure 6:. Loss of Ptpn2 enhances Tim-3+ CD8+ T cell differentiation in tumors
(a) Representative flow cytometry plot of control or Ptpn2-deleted OT-1 T cells in the tumor 7 days post MC38-OVA injection. Representative of two independent experiments, n = 4 biological replicates. (b) Quantification of frequencies of co-transferred control or Ptpn2-deleted CD8+ T cells day 7 post MC38-OVA injection. Frequencies at day 7 were normalized to input frequencies at day 0. Representative of two independent experiments, n = 4 biological replicates. (c-d) (c) GSEA TIL Slamf6+ vs. Tim-3+ Up top 50 and TIL Slamf6+ vs. Tim-3+ Down top 50 signature enrichment and (d) GSEA effector signatures for co-transferred control or Ptpn2-deleted OT-1 T cells in MC38-OVA tumors 7 days post injection. Representative of one experiment, n = 3 pooled mice and 2 technical replicates. (e) Quantification of Granzyme B expression in co-transferred OT-1 CD8+ T cells day 7 post MC38-OVA implantation in the tumor, draining lymph node, and spleen for control and Ptpn2-deleted co-transferred mix as in (a). Representative of two independent experiments, n ≥ 3 mice. (f) Schematic of adoptive transfer of either control or Ptpn2-deleted naive OT-1 CD8+ T cells separately to mice challenged with B16-OVA one day post transfer of T cells. (g) Tumor growth curves for B16-OVA tumors following transfer of naive OT-1 control or Ptpn2-deleted CD8+ T cells separately into WT recipients that were implanted with B16-OVA cells. Representative of two independent experiments, n = 8 mice. (h) Survival curves of mice in (g). Representative of two independent experiments, n = 8 mice. (i) Quantification of Slamf6+ Tim-3, Slamf6+ Tim-3+, and Slamf6 Tim-3+ subsets day 9 post B16-OVA implantation in the tumor for co-transferred control and Ptpn2-deleted cells as in (a). Representative of two independent experiments, n = 7 mice. Bar graphs represent mean and error bars represent standard deviation (except for g where error bars represent standard error). Statistical significance was assessed by two-sided Student’s paired t-test (b, e, i), two-sided Kolmogorov-Smirnov test (c, d), two-way ANOVA (g), or two-sided log-rank Mantel-Cox test (h) (ns p>.05, * p≤.05, ** p≤.01, *** p≤.001, **** p≤.0001). See also Supplementary Figure 6.
Figure 7:
Figure 7:. Deletion of Ptpn2 enhances CD8+ T cell responses to tumors and checkpoint blockade efficacy
(a) Schematic for MC38-WT tumor challenge in chimeric mice where approximately 50% of immune cells express a control sgRNA or a Ptpn2-targeting sgRNA. (b) Tumor growth curves for control or Ptpn2-deleted chimeric mice following 1 × 10⁶ cell MC38-WT challenge. Representative of two independent experiments, n ≥ 8 mice. (c-d) Quantification of (c) frequency and (d) number of Slamf6+ Tim-3, Slamf6+ Tim-3+, and Slamf6 Tim-3+ subsets in CD8+ T cells infiltrating day 9 MC38 tumors in control or Ptpn2-deleted bone marrow chimeras. Representative of two independent experiments, n ≥ 9 mice. (e-f) Quantification of (e) frequency and (f) number of Granzyme B-expressing CD8+ T cells infiltrating day 9 MC38 tumors implanted in control or Ptpn2-deleted bone marrow chimeras. Representative of two independent experiments, n ≥ 9 mice. (g) Quantification of frequency of Granzyme B+ CD8+ T cells from the blood of control or Ptpn2-deleted bone marrow chimeras day 14 post MC38 tumor implantation, pregated on CD8β+ Vex+ cells. Representative of two independent experiments, n = 5 mice. (h) Tumor growth curves for mice as in (a) challenged with 1 × 10⁶ MC38-WT tumor cells following treatment with CD8-depleting antibody or isotype control. Representative of two independent experiments, n ≥ 9 mice. (i) Tumor growth curves for control or Ptpn2-deleted bone marrow chimeras challenged with 1 × 10⁶ B16 tumor cells treated with GVAX (green triangles) on days 1, 4 and αPD-1 (black triangles) on days 12, 14, 16, 18, 20, 22, 24, and 26. Representative of two independent experiments, n ≥ 9 mice. (j) Quantification of frequency of Granzyme B+ CD8+ T cells from the blood of chimeras in (i) day 14 post B16 tumor implantation, pregated on CD8β+ Vex+ cells. . Representative of two independent experiments, n = 5 mice. Bar graphs represent mean and error bars represent standard deviation (except for b, h, i where error bars represent standard error). Statistical significance was assessed by two-way ANOVA (b-d, h-i), or two-sided Student’s unpaired t-test (e-g, j) (ns p>.05, * p≤.05, ** p≤.01, *** p≤.001, **** p≤.0001). See also Supplementary Figure 7.

References

    1. Zajac AJ et al. Viral Immune Evasion Due to Persistence of Activated T Cells Without Effector Function. The Journal of Experimental Medicine 188, 2205–2213 (1998). - PMC - PubMed
    1. Wherry EJ T cell exhaustion. Nature Immunology 12, 492–499 (2011). - PubMed
    1. Baitsch L et al. Exhaustion of tumor-specific CD8(+) T cells in metastases from melanoma patients. J Clin Invest 121, 2350–2360 (2011). - PMC - PubMed
    1. Miller BC et al. Subsets of exhausted CD8(+) T cells differentially mediate tumor control and respond to checkpoint blockade. Nat Immunol 20, 326–336 (2019). - PMC - PubMed
    1. Wherry EJ, Blattman JN, Murali-Krishna K, van der Most R & Ahmed R Viral Persistence Alters CD8 T-Cell Immunodominance and Tissue Distribution and Results in Distinct Stages of Functional Impairment. Journal of Virology 77, 4911–4927 (2003). - PMC - PubMed

Methods-only references

    1. Platt RJ et al. CRISPR-Cas9 knockin mice for genome editing and cancer modeling. Cell 159, 440–455 (2014). - PMC - PubMed
    1. Doench JG et al. Optimized sgRNA design to maximize activity and minimize off-target effects of CRISPR-Cas9. Nat Biotechnol 34, 184–191 (2016). - PMC - PubMed
    1. Juneja VR et al. PD-L1 on tumor cells is sufficient for immune evasion in immunogenic tumors and inhibits CD8 T cell cytotoxicity. J Exp Med 214, 895–904 (2017). - PMC - PubMed
    1. Corces MR et al. Lineage-specific and single-cell chromatin accessibility charts human hematopoiesis and leukemia evolution. Nat Genet 48, 1193–1203 (2016). - PMC - PubMed
    1. Buenrostro JD, Giresi PG, Zaba LC, Chang HY & Greenleaf WJ Transposition of native chromatin for fast and sensitive epigenomic profiling of open chromatin, DNA-binding proteins and nucleosome position. Nat Methods 10, 1213–1218 (2013). - PMC - PubMed

Publication types

MeSH terms

Substances