. 2019 Sep 17;14(9):e0222279.
doi: 10.1371/journal.pone.0222279. eCollection 2019.

Continuous norming of psychometric tests: A simulation study of parametric and semi-parametric approaches

Affiliations

Continuous norming of psychometric tests: A simulation study of parametric and semi-parametric approaches

Alexandra Lenhard et al. PLoS One. .

Abstract

Continuous norming methods have seldom been subjected to scientific review. In this simulation study, we compared parametric with semi-parametric continuous norming methods in psychometric tests by constructing a fictitious population model within which a latent ability increases with age across seven age groups. We drew samples of different sizes (n = 50, 75, 100, 150, 250, 500 and 1,000 per age group) and simulated the results of an easy, medium, and difficult test scale based on Item Response Theory (IRT). We subjected the resulting data to different continuous norming methods and compared the data fit under the different test conditions with a representative cross-validation dataset of n = 10,000 per age group. The most significant differences were found in suboptimal (i.e., too easy or too difficult) test scales and in ability levels that were far from the population mean. We discuss the results with regard to the selection of the appropriate modeling techniques in psychometric test construction, the required sample sizes, and the requirement to report appropriate quantitative and qualitative test quality criteria for continuous norming methods in test manuals.


Conflict of interest statement

cNORM was developed by the authors and is freely available and licensed under the GNU Affero General Public License v3 (AGPL-3.0). We do not pursue economic interests with this publication. The authors have declared that no competing interests exist.

Figures

Fig 1
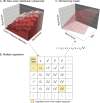
Fig 1. Norming as the group-specific (e.g., age-specific) mapping of raw scores to latent abilities.
While the latent trait or ability is normally distributed in every single age group, the features and shapes of the resulting raw score distributions can change depending on age. As the norm scores are scaled with respect to each separate age-group, they reflect the exceptionality of the test result within a certain age group but do not reflect general developmental changes of the latent ability between age groups.
Fig 2
Fig 2. Parametric continuous norming.
Known parametric functions are used to model the raw score distributions at specific age levels. The function parameters are subsequently modeled as a function of explanatory variables such as age.
Fig 3
Fig 3. Semi-parametric continuous norming.
Polynomial regression is applied to model a two-dimensional surface (age x location) in a three-dimensional space (age x location x raw score).
Fig 4
Fig 4. Flow chart of the simulation cycles.
Fig 5
Fig 5. Age progression of the fictitious ability in the simulated population.
θAge corresponds to the latent ability z-standardized with regard to subjects of exactly the same age and θPop corresponds to the latent ability z-standardized with regard to the total population.
Fig 6
Fig 6
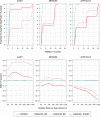
RMSE obtained by the different norming methods in the cross-validation sample as a function of scale difficulty (upper panel) and MSD per sample size and difficulty (lower panel).
Fig 7
Fig 7. RMSE as a function of approach (semi-parametric vs. best parametric), sample size n and scale difficulty.
The solid lines represent the 50th percentile, whereas the dashed lines represent the 25th resp. 75th percentile. This analysis includes all simulation cycles with at least one parametric model with an RMSE < 10.
Fig 8
Fig 8. RMSE of the three parametric methods as a function of scale difficulty and sample size n.
The figure includes all models with a RMSE < 10.
Fig 9
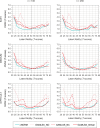
Fig 9. RMSE as a function of method, scale difficulty, and latent ability for sample size n = 100 (left panel) and n = 250 (right panel).
Fig 10
Fig 10. Percentile curves generated with the cNORM package based on the normative sample of a real vocabulary test.
The curves show which raw score (y-axis) is assigned to a specific ability level (each represented by a percentile curve) at a certain age (x-axis). The upper panel shows a deliberately ill-executed norming procedure (31 terms, k = 5, raw score RMSE = 3.33, norm score SE = 0.88), whereas the lower panel depicts an optimally executed procedure (7 terms, k = 4, raw score RMSE = 3.83, norm score SE = 1.11).

References

    1. American Psychiatric Association, American Psychiatric Association, Editor. Diagnostic and statistical manual of mental disorders: DSM-5. 5th ed. Washington, D.C: American Psychiatric Association; 2013.
    1. Rutter M, Tizard J, Yule W, Graham P, Whitmore K. Isle of Wight Studies, 1964–1974. Psychological Medicine. 1976;6(02):313. - PubMed
    1. Lenhard A, Lenhard W, Suggate S, Segerer R. A continuous solution to the norming problem. Assessment. 2016February;25(1):112–25. 10.1177/1073191116656437 - DOI - PubMed
    1. Oosterhuis HEM, van der Ark LA, Sijtsma K. Standard errors and confidence intervals of norm statistics for educational and psychological Tests. Psychometrika. September 2017;82(3):559–88. - PubMed
    1. Zhu J, Chen H-Y. Utility of inferential norming with smaller sample sizes. Journal of Psychoeducational Assessment. December 2011;29(6):570–80.

Publication types