Growth arrest-specific gene 2 suppresses hepatocarcinogenesis by intervention of cell cycle and p53-dependent apoptosis
- PMID: 31528096
- PMCID: PMC6718038
- DOI: 10.3748/wjg.v25.i32.4715
Growth arrest-specific gene 2 suppresses hepatocarcinogenesis by intervention of cell cycle and p53-dependent apoptosis
Abstract
Background: Growth arrest-specific gene 2 (GAS2) plays a role in modulating in reversible growth arrest cell cycle, apoptosis, and cell survival. GAS2 protein is universally expressed in most normal tissues, particularly in the liver, but is depleted in some tumor tissues. However, the functional mechanisms of GAS2 in hepatocellular carcinoma (HCC) are not fully defined.
Aim: To investigate the function and mechanism of GAS2 in HCC.
Methods: GAS2 expression in clinic liver and HCC specimens was analyzed by real-time PCR and western blotting. Cell proliferation was analyzed by counting, MTS, and colony formation assays. Cell cycle analysis was performed by flow cytometry. Cell apoptosis was investigated by Annexin V apoptosis assay and western blotting.
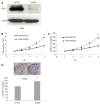
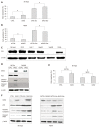
Results: GAS2 protein expression was lower in HCC than in normal tissues. Overexpression of GAS2 inhibited the proliferation of HCC cells with wide-type p53, while knockdown of GAS2 promoted the proliferation of hepatocytes (P < 0.05). Furthermore, GAS2 overexpression impeded the G1-to-S cell cycle transition and arrested more G1 cells, particularly the elevation of sub G1 (P < 0.01). Apoptosis induced by GAS2 was dependent on p53, which was increased by etoposide addition. The expression of p53 and apoptosis markers was further enhanced when GAS2 was upregulated, but became diminished upon downregulation of GAS2. In the clinic specimen, GAS2 was downregulated in more than 60% of HCCs. The average fold changes of GAS2 expression in tumor tissues were significantly lower than those in paired non-tumor tissues (P < 0.05).
Conclusion: GAS2 plays a vital role in HCC cell proliferation and apoptosis, possibly by regulating the cell cycle and p53-dependent apoptosis pathway.
Keywords: Apoptosis; Cell cycle; Growth arrest-specific gene 2; Hepatocellular carcinoma; p53-dependent signaling pathway.
Conflict of interest statement
Conflict-of-interest statement: No potential conflicts of interest ware disclosed.
Figures


Similar articles
-
Growth arrest-specific 2 protein family: Structure and function.Cell Prolif. 2021 Jan;54(1):e12934. doi: 10.1111/cpr.12934. Epub 2020 Oct 25. Cell Prolif. 2021. PMID: 33103301 Free PMC article. Review.
-
Truncated HBx-dependent silencing of GAS2 promotes hepatocarcinogenesis through deregulation of cell cycle, senescence and p53-mediated apoptosis.J Pathol. 2015 Sep;237(1):38-49. doi: 10.1002/path.4554. Epub 2015 May 28. J Pathol. 2015. PMID: 25925944
-
Downregulation of PRAME Suppresses Proliferation and Promotes Apoptosis in Hepatocellular Carcinoma Through the Activation of P53 Mediated Pathway.Cell Physiol Biochem. 2018;45(3):1121-1135. doi: 10.1159/000487353. Epub 2018 Feb 7. Cell Physiol Biochem. 2018. PMID: 29439259
-
A novel all-trans retinoic acid derivative 4-amino‑2‑trifluoromethyl-phenyl retinate inhibits the proliferation of human hepatocellular carcinoma HepG2 cells by inducing G0/G1 cell cycle arrest and apoptosis via upregulation of p53 and ASPP1 and downregulation of iASPP.Oncol Rep. 2016 Jul;36(1):333-41. doi: 10.3892/or.2016.4795. Epub 2016 May 9. Oncol Rep. 2016. PMID: 27177208
-
Insights into Structure and Function of Growth Arrest Specific 2 (GAS2).J Cancer. 2025 Jan 1;16(1):146-156. doi: 10.7150/jca.102893. eCollection 2025. J Cancer. 2025. PMID: 39744572 Free PMC article. Review.
Cited by
-
Data mining of key genes expression in hepatocellular carcinoma: novel potential biomarkers of diagnosis prognosis or progression.Clin Exp Metastasis. 2022 Aug;39(4):589-602. doi: 10.1007/s10585-022-10164-9. Epub 2022 Apr 16. Clin Exp Metastasis. 2022. PMID: 35429302 Free PMC article.
-
Key role of interferon regulatory factor 1 (IRF-1) in regulating liver disease: progress and outlook.J Zhejiang Univ Sci B. 2024 Jun 15;25(6):451-470. doi: 10.1631/jzus.B2300159. J Zhejiang Univ Sci B. 2024. PMID: 38910492 Free PMC article. Review.
-
Growth arrest-specific 2 protein family: Structure and function.Cell Prolif. 2021 Jan;54(1):e12934. doi: 10.1111/cpr.12934. Epub 2020 Oct 25. Cell Prolif. 2021. PMID: 33103301 Free PMC article. Review.
-
Transcriptome RNA Sequencing Reveals That Circular RNAs Are Abundantly Expressed in Embryonic Breast Muscle of Duck.Vet Sci. 2023 Jan 19;10(2):75. doi: 10.3390/vetsci10020075. Vet Sci. 2023. PMID: 36851380 Free PMC article.
-
A novel variant in GAS2 is associated with autosomal dominant nonsyndromic hearing impairment in a Chinese family.Hum Genomics. 2024 Jul 2;18(1):73. doi: 10.1186/s40246-024-00628-2. Hum Genomics. 2024. PMID: 38956677 Free PMC article.
References
-
- Torre LA, Siegel RL, Ward EM, Jemal A. Global Cancer Incidence and Mortality Rates and Trends--An Update. Cancer Epidemiol Biomarkers Prev. 2016;25:16–27. - PubMed
-
- Torre LA, Bray F, Siegel RL, Ferlay J, Lortet-Tieulent J, Jemal A. Global cancer statistics, 2012. CA Cancer J Clin. 2015;65:87–108. - PubMed
-
- Ferlay J, Soerjomataram I, Dikshit R, Eser S, Mathers C, Rebelo M, Parkin DM, Forman D, Bray F. Cancer incidence and mortality worldwide: Sources, methods and major patterns in GLOBOCAN 2012. Int J Cancer. 2015;136:E359–E386. - PubMed
MeSH terms
Substances
LinkOut - more resources
Full Text Sources
Medical
Research Materials
Miscellaneous

