. 2019 Jan;1(1):86-97.
doi: 10.1038/s42255-018-0003-x. Epub 2018 Nov 19.

Knockdown of Ant2 Reduces Adipocyte Hypoxia And Improves Insulin Resistance in Obesity

Affiliations

Knockdown of Ant2 Reduces Adipocyte Hypoxia And Improves Insulin Resistance in Obesity

Jong Bae Seo et al. Nat Metab. 2019 Jan.

Abstract

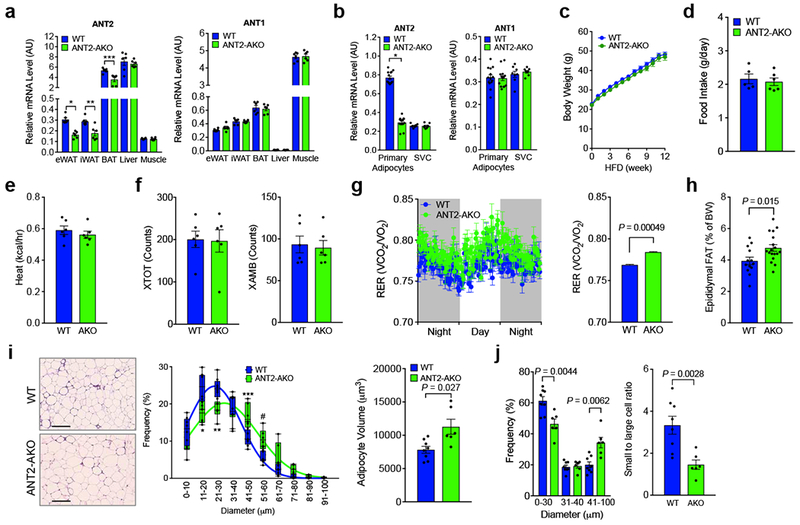
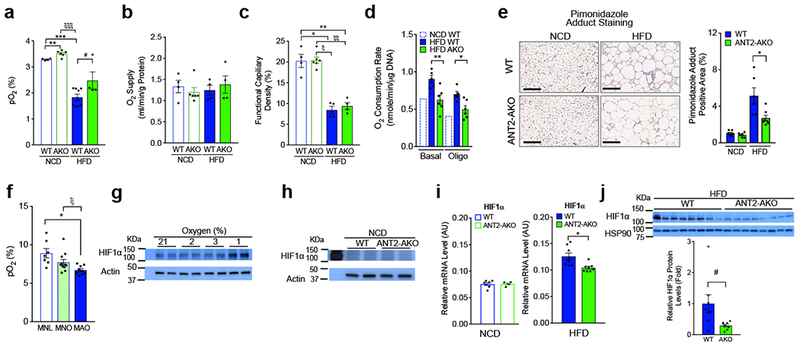
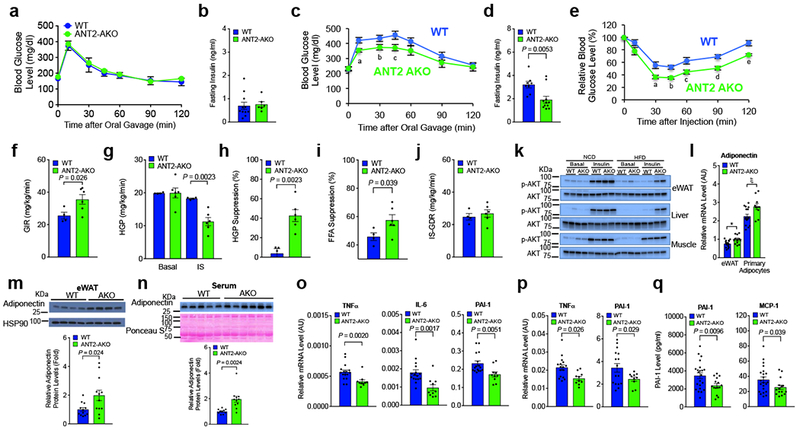
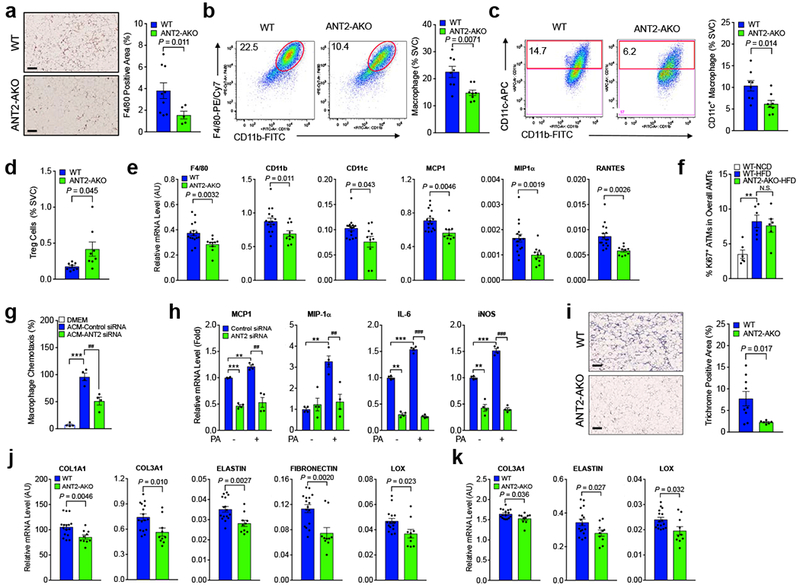
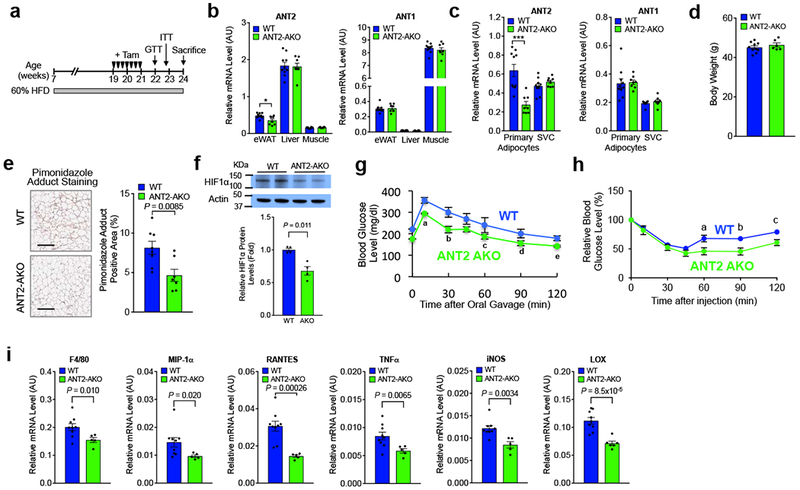
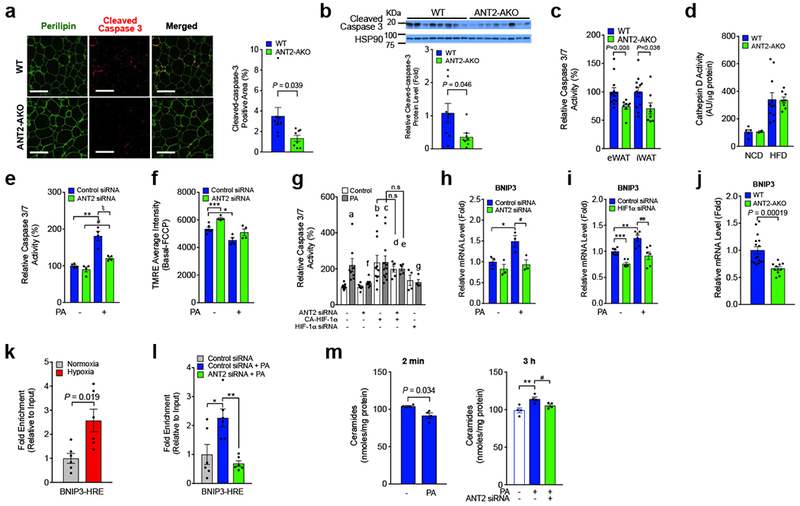
Decreased adipose tissue oxygen tension and increased HIF-1α expression can trigger adipose tissue inflammation and dysfunction in obesity. Our current understanding of obesity-associated decreased adipose tissue oxygen tension is mainly focused on changes in oxygen supply and angiogenesis. Here, we demonstrate that increased adipocyte O2 demand, mediated by ANT2 activity, is the dominant cause of adipocyte hypoxia. Deletion of adipocyte Ant2 improves obesity-induced intracellular adipocyte hypoxia by decreasing obesity-induced adipocyte oxygen demand, without effects on mitochondrial number or mass, or oligomycin-sensitive respiration. This led to decreased adipose tissue HIF-1α expression and inflammation with improved glucose tolerance and insulin resistance in both a preventative or therapeutic setting. Our results suggest that ANT2 may be a target for the development of insulin sensitizing drugs and that ANT2 inhibition might have clinical utility.

Keywords: ANT2; Adipose Tissue Hypoxia; HIF-1α; Inflammation; Insulin Resistance; Mitochondria; Obesity; Oxygen Consumption; Type 2 diabetes; Uncoupled Respiration.


Conflict of interest statement

Authors have no competing interest to declare.

Figures

Figure 1
Figure 1
Adipocyte-specific ANT2 knockout mice exhibit normal body weight with increased adipose tissue mass. (a) mRNA expression of ANT1 and ANT2 in different tissues of WT and ANT2 AKO mice fed HFD for 12 weeks (n=6 mice per group). *P=0.00038, **P=0.0062, and ***P=0.0056 vs. WT controls. (b) mRNA expression of ANT1 and ANT2 in primary adipocytes (n=14 mice per group) and SVCs (n=8 mice per group) isolated from eWAT of WT and ANT2 AKO mice. *P=8.25×10⁻¹⁷, vs. WT controls. (c) Body weight gain on HFD (n=17 and 22 for WT and AKO mice, respectively). (d) Average daily food intake in HFD WT (n=5 mice) and ANT2 AKO mice (n=6 mice). (e-g) Metabolic rates (heat generation, e; locomotor activity, f; respiratory exchange rate, g) of HFD WT and ANT2 AKO mice (n=6 mice per group). Each of data points from individual mice was omitted in the bar graph to more clearly show the mean values and error bar sizes. Statistical analyses were performed by the two-way ANOVA. (h) Tissue weights of eWAT of HFD WT (n=13) and ANT2 AKO (n=18) mice. (i) H&E staining (left) of eWAT and the frequency distribution of adipocyte sizes (middle) and average adipocyte volume (right). n=8 (7944 cells) and 6 (4334 cells) mice for WT and AKO, respectively. Scale bar, 200 μm. *P=0.0064, ** P=0.0022, *** P=0.018, and #P=0.010 vs WT controls. Box plot element and lines indicate the range of minimum to maximum and curve fits, respectively. (j) The frequency distribution in panel i was divided into tertiles and the right hand bars show he ratio of lowest and highest adipocyte size tertiles. Statistical analyses in panels a,b,h-j were performed by the two-tailed Student’s t test. All data are presented as mean +/− SEM.
Figure 2
Figure 2
Intracellular O2 tension and HIF-1α expression are decreased in the eWAT of ANT2 AKO mice. (a,b) Interstitial O2 tension (a) and arterial O2 supply (b) in the eWAT of NCD or HFD WT or ANT2 AKO mice (n=4, 6, 8 (or 4) and 4 mice, respectively). **P=0.0041, ξξξP=5.1×10⁻⁶, ***P=4.3×10⁻⁷ according to the two-way ANOVA with post-hoc two-tailed t-tests between the individual groups. #P=0.073 (one-tailed t-test). (c) Functional capillary density in eWAT of mice fed NCD or HFD (n=4 mice per group). *P=0.0015, **P=0.0024, ξP=3.0×10⁻⁵, and ξξP=2.1×10⁻⁵. (d) O2 consumption in primary adipocyte isolated from eWAT of mice fed HFD WT or AKO mice (n=5 and 6 mice for HFD WT and HFD AKO, respectively). NCD WT mouse data was modified from a previous report . *P=0.0074, **P=0.011. (e) Pimonidazole (brown) and H&E stainings of eWAT from WT (n=6 mice) and ANT2 AKO (n=7 mice) mice fed NCD or HFD. Scale bar, 200 μm. P=0.037. (f) Human subcutaneous abdominal adipose tissue O2 tension. Subcutaneous abdominal adipose tissue O2 tension in metabolically-normal lean (MNL) (n=7 individual participants), metabolically-normal obese (MNO) (n=11 individual participants) and metabolically-abnormal obese (MAO) (n=9 individual participants) participants. *P=0.01, ξP=0.028. (g) Western blot analysis of HIF-1α protein expression at different O2 conditions. (h-j) Protein (h, j) and mRNA (i) levels of HIF-1α in eWAT of NCD (h, i) or HFD (i, j) WT or ANT2 AKO mice. Individual data points in panels h,i,j were collected from 2 WT and 2 KO mice (h), 7 NCD WT, 5NCD KO, 8 HFD WT and HFD KO mice (i), and 8 WT and 8 KO mice (j), respectively. *P=0.012, #P=0.045 according to the two-tailed t-test. Similar results to those in panels g,h data were obtained from at least two independent experiments. All data are presented as mean +/− SEM. Statistical analyses in panels c-f were performed by the ANOVA with post-hoc two-tailed t-tests between the individual groups.
Figure 3
Figure 3
ANT2 AKO mice are protected from HFD-induced adipose tissue inflammation, glucose intolerance and insulin resistance. (a) GTTs in NCD mice (WT, n=10; ANT2 AKO, n=5). (b) Fasting plasma insulin levels in NCD mice (n=11 and 6 mice for WT and ANT2 AKO, respectively). (c) GTTs in 12 week HFD mice (n=11 and 8 mice for WT and ANT2 AKO, respectively). aP=0.008, bP=0.043, cP=0.028, according to the two-way ANOVA with post-hoc two-tailed t-tests between the individual groups. (d) Fasting plasma insulin levels in HFD mice (n=8 and 11 mice for WT and ANT2 AKO, respectively). (e) ITTs in HFD mice for 12 weeks (n=8 and 11 mice for WT and ANT2 AKO, respectively). aP=0.020, bP=0.002, cP=0.030, dP=0.005, eP=0.005 according to the two-way ANOVA with post-hoc two-tailed t-tests between the individual groups. (f-j) Systemic and tissue-specific effects of ANT2 AKO was determined by hyperinsulinemic euglycemic clamp studies in 12 week HFD mice (n=4 and 6 mice for WT and ANT2 AKO, respectively). (f) GIR. (g) HGP. (h) HGP suppression. (i) Suppression of plasma FFA levels. (j) IS-GDR. (k) Akt phosphorylation in eWAT, liver, and muscle of WT and ANT2 AKO mice. Representative data from two independent experiments are shown. (l) mRNA levels of adiponectin in eWAT and primary adipocytes of HFD WT and ANT2 AKO mice (n=8 mice per group). *P=0.027, ξP=0.018. (m,n) Western blot analysis of adiponectin protein levels in eWAT (m; n=12 mice per group) and serum (n; n=10 and 11 for WT and AKO, respectively) of HFD WT and ANT2 AKO. Representative images were shown on the top of each bar graph. (o,p) mRNA levels of inflammatory cytokines in primary adipocytes (o) or eWAT (p) of HFD WT (n=16 mice) and ANT2 AKO (n=10 mice per group) mice. (q) Serum levels of PAI-1 and MCP-1 in HFD WT (n=11 mice) and ANT2 AKO mice (n=15 mice). Statistical analyses in panels d,f-i,l-q were performed by the two-tailed Student’s t test. All data are presented as mean +/− SEM.
Figure 4
Figure 4
HFD-induced ATM accumulation and M1-like polarization is reduced in ANT2 AKO mice with improved adipose tissue fibrosis. (a) F4/80 staining (brown) of eWAT sections of 12 week HFD mice (n=9 and 5 mice for WT and AKO, respectively). Scale bar, 200 μm. (b-d) Flow cytometry analysis of eWAT SVCs of 12 week HFD mice (n=8). Total macrophage (CD45+ / CD11b+ / F4/80+ triple positive cells) (b), CD11c+ M1-like polarized macrophage (c), and Treg (CD3+ / CD4+ / Foxp3+ triple positive cells) (d) ratio among total SVC population was calculated and presented in bar graphs. Representative scatter plot images were shown on the left side of each bar graph or in Supplementary Fig. 4d. (e) mRNA levels of macrophage marker and chemokine genes in eWAT of HFD WT and ANT2 AKO mice were measured by qRT-PCR (n=16 and 10 for WT and ANT2 AKO mice, respectively). (f) The ratio of Ki67+ ATM population in ATMs of NCD WT, HFD WT, or HFD ANT2 AKO mice (n=6 mice per group). **P=0.0020. N.S., not significant. (g) Migration of Raw264.7 macrophage cells to ACM harvested from 3T3-L1 cells transfected with control or anti-ANT2 siRNA (n=4 wells per group). ***P=0.0007, ##P=0.0043. (h) mRNA levels of inflammatory gene expression. 3T3-L1 adipocytes were transfected with control or ANT2 siRNAs and then incubated in no or high palmitic acid (400 μM) medium for 24 h (n=4 wells per group). For MCP1, ***P=9.8×10⁻⁵, ** P=0.0050, ##P=0.0034. For MIP1α, ** P=0.0023, ##P=0.0060. For IL-6, **P=1.5×10⁻⁵, *** P=1.3×10⁻⁵, ###P=4.4×10⁻⁷. For iNOS, ** P=0.0022, *** P=0.00029, ##P=1.6×10⁻⁶. (i) Trichrome (blue) staining of eWAT sections of 12 week HFD mice (n=9 and 6 mice for WT and AKO, respectively). Scale bar, 200 μm. (j,k) mRNA levels of fibrogenic genes in primary adipocytes (j) and eWAT (k) of HFD mice (n=16 and 10 mice for WT and AKO, respectively). Statistical analyses in panels a-e,i-k were performed by the two-tailed Student’s t test. Statistical analyses in panels f-h were performed by the ANOVA with post-hoc two-tailed t-tests between the individual groups. All data are presented as mean +/− SEM.
Figure 5
Figure 5
Inducible ANT2 AKO reverses established glucose and insulin intolerance. (a) Schematic representation of the experimental scheme for tamoxifen injection and metabolic analyses in inducible adipocyte ANT2 AKO mice. (b) mRNA levels of Ant2 and Ant1 in eWATs of WT and KO mice after induction (n=9 and 5 mice for WT and AKO, respectively). *P=0.037. (c) mRNA levels of Ant2, and Ant1 in adipocyte and SVC fraction of eWATs of WT and KO mice after induction (n=10 and 8 mice for WT and AKO, respectively). ***P=0.0058. (d) Body weight of HFD WT and KO at 22 weeks of age (n=10 and 6 mice for WT and AKO, respectively). (e) Ratio of pimonidazole adduct positive area among total section area (n=8 and 7 mice per group). Scale bar, 200 μm. (f) Western blot analysis of HIF-1α expression in HFD WT and ANT2 iAKO mice (n=4 mice per group). (g) GTTs (n=7 mice per group). aP=0.018, bP=0.045, cP=0.005, dP=0.004. (h) ITTs (n=10 and 6 mice for WT and AKO, respectively). aP=0.024, bP=0.015, and cP=0.014. (i) mRNA levels of inflammatory genes in eWAT (n=9 and 5 mice for WT and AKO, respectively). Statistical analyses were performed by the two-tailed Student’s t test (in panels b,c,e,f,i) or by the two-way ANOVA with post-hoc two-tailed t-tests between the individual groups (in panels g,h). All data are presented as mean +/− SEM.
Figure 6
Figure 6
HFD-induced adipocyte apoptosis is decreased in ANT2 AKO mice. (a) Immunofluoresence staining of eWATs from 12 week HFD mice. Percentage of cleaved caspase-positive area was calculated and graphed on the right (n=8 mice per group). Scale bar, 200 μm. (b) Cleaved caspase-3 protein levels in eWAT of 12 week HFD mice (n=8 mice per group). (c) Caspase-3/7 activity in eWAT and iWAT of HFD WT (n=12 mice) and KO (n=8 mice) mice. (d) Cathepin D activity in eWAT (n=5, 2, 11 and 8 mice in bars 1 through 4) . (e,f) ANT2 effects on adipocyte apoptosis. 24 h after siRNA transfection, cells were incubated with or without high palmitate (PA; 400 μM) for 24 h, and subjected to caspase-3/7 activity (e; **P=0.0062, #P=0.012, ξP=0.014) or MMP (f; ***P=0.00083, *P=0.010) measurements (n=4 wells per group). (g) Chronic palmitate-induced Caspase-3/7 activity in 3T3-L1 adipocytes with ANT2 KD, HIF-1α KD and/or constitutively active (CA)-HIF-1α overexpression (n=9, 8,6,7,11,12,6,5,4, and 4 wells in bars 1 through 10). aP=0.013, bP=0.0067, cP=0.0021, dP=0.016, and eP=0.00066 vs lane 1; fP=0.030, and gP=0.039 vs lane 2. (h) Bnip3 mRNA expression in the same set of samples in panel e. *P=0.045, #P=0.038. (i) mRNA levels of Bnip3 in control or HIF-1α KD adipocytes (n=6 wells per group). ***P=0.00014, *P=0.0054, ##P=0.0054. (j) mRNA levels of Bnip3 in eWAT of HFD WT (n=16 mice) and KO mice (n=10 mice). (k,l) ChIP analysis of HIF-1α occupancy at Bnip3 promoter in 3T3-L1 adipocytes incubated at normoxic (21% O2) or hypoxic (1% O2) condition for 3h (k), or after 400 μM palmitic acid treatment for 24h (l). n=6 wells per group. *P=0.021, **P=0.0028. (m) Intracellular ceramide levels in control or ANT2 KD 3T3-L1 adipocytes. 48h after siRNA transfection, cells were incubated with or without 400 μM palmitate-containing media for 2 min or 3h, and subjected to intracellular ceramide measurements (n=4 wells per group). **P=0.012, #P=0.045. Statistical analyses were performed by the two-tailed Student’s t test (in panels a-c,j,l,m(left)) or by the ANOVA with post-hoc two-tailed t-tests between the individual groups was performed (in panels e-i,m(left)). All data are presented as mean +/− SEM.

References

    1. Olefsky JM & Glass CK Macrophages, inflammation, and insulin resistance. Annu Rev Physiol 72, 219–246 (2010). - PubMed
    1. Kusminski CM, Bickel PE & Scherer PE Targeting adipose tissue in the treatment of obesity-associated diabetes. Nat Rev Drug Discov 15, 639–660 (2016). - PubMed
    1. Lee YS, Wollam J & Olefsky JM An Integrated View of Immunometabolism. Cell 172, 22–40 (2018). - PMC - PubMed
    1. Friedman J The long road to leptin. J Clin Invest 126, 4727–4734 (2016). - PMC - PubMed
    1. Yore MM, et al. Discovery of a class of endogenous mammalian lipids with anti-diabetic and anti-inflammatory effects. Cell 159, 318–332 (2014). - PMC - PubMed

Publication types

MeSH terms