. 2019 Dec 2;47(21):e138.
doi: 10.1093/nar/gkz789.

cellHarmony: cell-level matching and holistic comparison of single-cell transcriptomes

Affiliations

cellHarmony: cell-level matching and holistic comparison of single-cell transcriptomes

Erica A K DePasquale et al. Nucleic Acids Res. .

Abstract

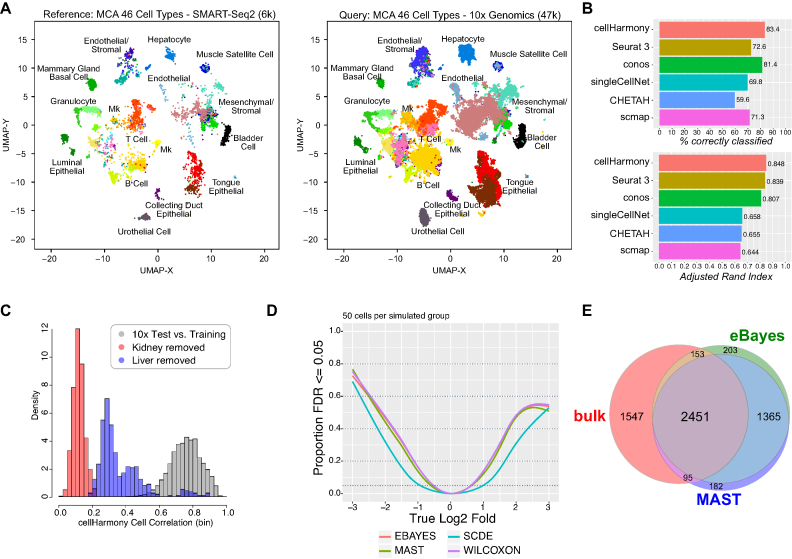
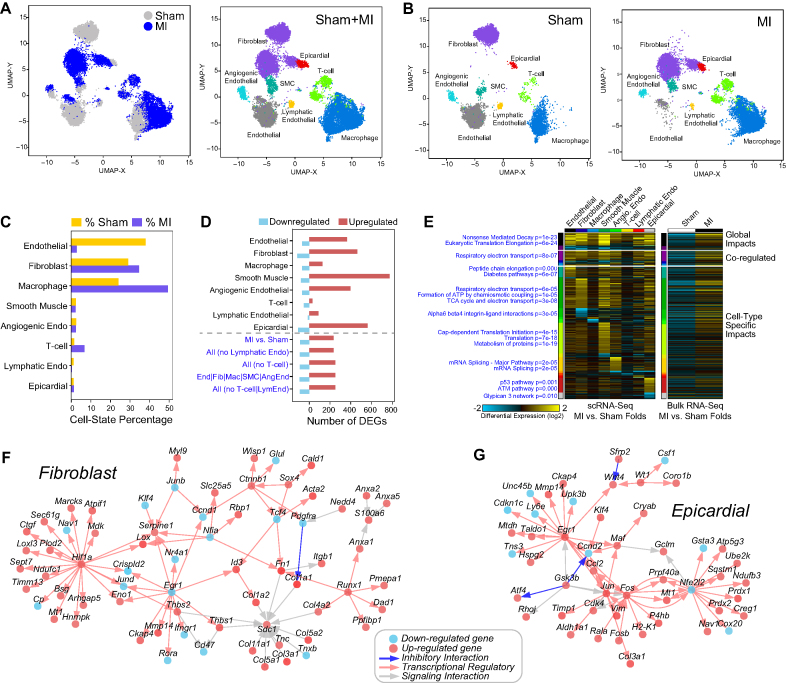
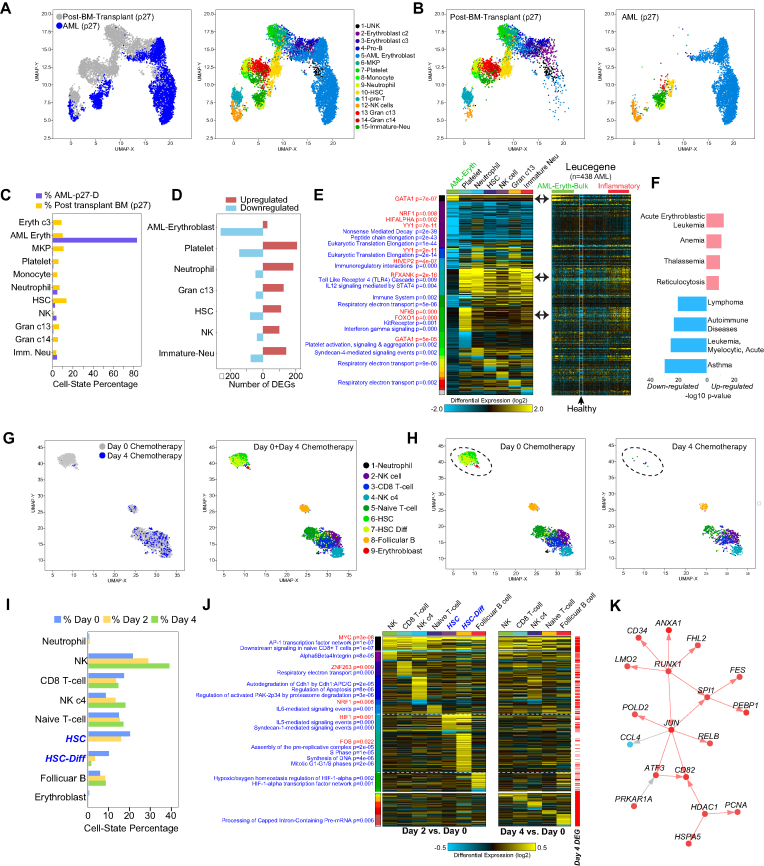
To understand the molecular pathogenesis of human disease, precision analyses to define alterations within and between disease-associated cell populations are desperately needed. Single-cell genomics represents an ideal platform to enable the identification and comparison of normal and diseased transcriptional cell populations. We created cellHarmony, an integrated solution for the unsupervised analysis, classification, and comparison of cell types from diverse single-cell RNA-Seq datasets. cellHarmony efficiently and accurately matches single-cell transcriptomes using a community-clustering and alignment strategy to compute differences in cell-type specific gene expression over potentially dozens of cell populations. Such transcriptional differences are used to automatically identify distinct and shared gene programs among cell-types and identify impacted pathways and transcriptional regulatory networks to understand the impact of perturbations at a systems level. cellHarmony is implemented as a python package and as an integrated workflow within the software AltAnalyze. We demonstrate that cellHarmony has improved or equivalent performance to alternative label projection methods, is able to identify the likely cellular origins of malignant states, stratify patients into clinical disease subtypes from identified gene programs, resolve discrete disease networks impacting specific cell-types, and illuminate therapeutic mechanisms. Thus, this approach holds tremendous promise in revealing the molecular and cellular origins of complex disease.


Figures

Figure 1.
Figure 1.
Integrated and automated holistic discovery of cell population-specific perturbations. Illustrated automated workflow of the cellHarmony analysis pipeline. (A) Small and large (>100k cell) scRNA-Seq datasets can be pre-processed in the parent software AltAnalyze (expression scaling, outlier exclusion) for the query and reference dataset. Raw data can be input from multiple file formats (Methods). Both query and reference can be individual samples or combined collections (joined and analyzed or merged post unsupervised analysis with the cellHarmonyMerge function). The default unsupervised clustering population prediction method in AltAnalyze is ICGS version 2.0 (ICGS-NMF output), which provides different input options (population marker genes or guide-gene correlated results). (B) Alignment of individual cells from the query to the reference is accomplished through community clustering of each dataset, following the creation of a k-nearest neighbor graph in each dataset. Prior to matching cells, Louvain partitions (cluster centroids) are matched between datasets to define the nearest neighborhoods (Pearson coefficient). Labels provided for the reference clusters (stem cell, macrophage…) can be provided as alternatives to cluster labels (c1,c2,c3…), based on the ICGS cluster cell-type predictions (curated by the user). (C) Query cells that meet a minimum correlation threshold (Pearson coefficient > 0.4, default) are placed adjacent to their aligned reference cell in the ICGS heatmap and projected into a common UMAP coordinate space to determine the mixing of cells and qualitative transcriptomic differences. (D) Quantitative transcriptome differences between query and reference cells are computed using a multi-step differential expression analysis between matched cell clusters and (E) population proportion differences reported (Fishers Exact test). (F) Gene-level statistical differences are used to identify the most similar impacted cell clusters (co-regulated), defined by comparing the frequency of genes similar patterns of regulation from a binarized P-value and fold-change matrix. Genes with expression best described by global regulation (impacted across all cell populations), co-regulated clusters (regional) or that are most restricted in their differences to specific cell clusters (local) are ordered statistically in a combined heatmap (left). Integrated with this heatmap are statistically enriched pathways and transcription-factor targets to determine the perturbation-specific impacts along a continuum of related and distinct cell populations. Putative transcriptional regulatory and curated protein-protein interaction networks are derived from each cell population or co-regulated comparison to identify likely regulators and their targets among these impacted populations (right).
Figure 2.
Figure 2.
cellHarmony produces accurate alignments across technologies. (A) cellHarmony produced UMAP projection of cells from 12 Tabula Muris tissues profiled using two different single-cell methods, SMART-Seq2 (reference, left) and 10x Genomics (query, right). 10x Genomics cell population labels were transferred from the SMART-Seq2 through community-alignment. Cells were restricted in both sets to those with common assigned Cell Ontology annotations by the study authors to allow for evaluation of the alignment agreements. (B) Comparison of the cell-label assignment by six independent algorithms (cellHarmony, Seurat3 reference label transfer, conos label projection, scmap, singleCellNet and CHETAH) using the cells and labels from panel C. Results from cellHarmony are reported using variable genes derived from an unsupervised analysis of all SMARTSeq2 cells (ICGS version 2), whereas marker genes for all other applications were derived within those tools. Adjusted Rand Index is reported as the overall measure of agreement to the author provided Cell Ontology labels with confidence intervals for ARI computed using the normal approximation. (C) Evaluation of excluded cell types by cellHarmony in the 10× Genomics MCA dataset. The histogram indicates the cellHarmony cell similarity values (Pearson coefficient coefficient) in: (i) 50% of the MCA 10× Genomics cells against the remainder for all 46 cell types, (ii) liver cell hepatocytes aligned against 50% of the MCA 10x Genomics cells (excluding these cells form the reference), (iii) kidney collecting duct cells aligned against 50% of the MCA 10x Genomics cells (excluding these cells from the reference). Both kidney and liver cells should not have an analogous reference cells in the reference set, hence, alignments should be poor. (D, E) Evaluation of differential gene expression sensitivity using the empirical Bayes method. (D) Statistical power curves for simulated RNA-Seq data indicate the proportion of tests (features) with FDR-adjusted p-values ≤ 0.05 over a range of log2 fold-change values. Simulated data was generated using the R package ‘splatter’ with 50 cells for each of the two groups (composite of 5 simulated datasets). (E) Overlap of differentially expressed genes (DEGs) from T-cells versus B-cells profiled either by bulk RNA-Seq (benchmark data) or scRNA-Seq predicted using the MAST testing procedure or empirical Bayes t-test (eBayes) (see Supplemental Information).
Figure 3.
Figure 3.
Identification of cell-type specific regulatory networks in cardiac ischemia. (A) cellHarmony UMAP projection of mouse heart scRNA-Seq, comparing myocardial infarction (MI) to non-diseased hearts (Sham surgery). Cell cluster labels and colors were assigned by cellHarmony (MI) or from the Seurat analysis (Sham). (B) Separation of the combined UMAP projections for reference Seurat Sham clusters and aligned MI clusters. Differences in the projected population locations in the MI are attributed to disease-associated transcriptomic changes. (C) Cell population percentages for cells from Sham and MI. (D) Number of differentially expressed genes for each cell cluster (local), global (all AML cells versus all wild-type) and regional (coregulated cell clusters) comparisons for MI versus Sham (fold>1.5, empirical Bayes moderated t-test P < 0.05 (FDR adjusted)). (E) Ordered gene expression changes (upregulation and downregulation) for each global, regional and the cell population-specific comparison, based on relative gene expression P-value rankings, along with associated statistically enriched pathways and enrichment P-values (blue text) (left panel). The same genes are shown in the right panel for comparable bulk RNA-Seq of MI versus Sham, from a prior study (GSE96561). (FG) cellHarmony produced gene network displaying putative regulatory interactions (red arrows) among up-regulated (red notes) and down-regulated genes (blue nodes), separately for fibroblast (F) and epicardial (G) MI versus Sham comparisons.
Figure 4.
Figure 4.
Cell population-specific impacts in transitioning progenitors and AML. (A) cellHarmony alignment of previously profiled splenic c-kit-positive AML cells relative to ICGS results from all captured normal mouse bone marrow hematopoietic progenitors (reference sample, Olsson et al. 2016). (B) AML cells were aligned most frequently to annotated dendritic cells (DC), monocyte progenitors (Mono), and previously described bipotential hematopoietic progenitors (IG2, Olsson et al. 2016). The AML DCs were high enriched relative to wild-type DCs by cellHarmony Fisher Exact test (P = 4.8E–24). C) Number of differentially expressed genes (DEG) by cell cluster (upregulated and down-regulated) for AML versus wild-type cell populations (fold > 2, P < 0.05, FDR adjusted). Negative numbers on the x-axis indicate downregulation (i.e. ‘-100’ means ‘100 downregulated genes’). (D) Heatmap of AML versus wild-type fold changes for all significant differentially regulated genes from panel C. Genes are grouped as global, regional, and local transcriptomic differences (DEG p-value ranked), with DEGs demonstrating global regulation shown at the top of the heatmap, co-regulated cluster impacts in the middle, and cell population-specific impacts at the bottom. The regional or co-regulated clusters indicate shared patterns of gene expression across multiple cell populations (e.g. HSCP-1 + HSCP-2 + IG2 + Mono). For each pattern, a separate up-regulated and down-regulated cluster is shown. Known transcription factors are displayed to the right of the heatmap where present by cellHarmony and enriched Pathway Commons gene-sets (blue) and transcription factor target sets (red) are displayed on the left next to each cluster in ranked order of significance (bottom to top). (E) Corresponding gene expression differences from bulk RNA-Seq of the AML model compared to wild-type bone marrow controls as an independent verification. Red lines = upregulated genes (fold >1.5, empirical Bayes moderated t-test P < 0.05 (FDR adjusted)), Blue lines = downregulated genes (fold < –1.5, empirical Bayes moderated t-test P < 0.05 (FDR adjusted)).
Figure 5.
Figure 5.
Assessing temporal changes in cell population-specific gene regulatory programs in Acute Myeloid Leukemia. (A) UMAP projection of ICGS-NMF scRNA-Seq clusters from bone marrow mononuclear cells from a single-patient (AML027) after bone marrow transplantation and a cellHarmony aligned diagnosis AML sample. (B) Separation of the combined UMAP projections for reference post-transplantation clusters and aligned AML clusters. (C) Cell population percentages for cells from post-transplantation and AML. The diagnosis AML erythroblast cluster represents the dominant cell population in the AML patient. (D) The number of corresponding gene expression changes in the AML compared to the post-transplantation. The AML erythroblast cluster is characterized by downregulation while all other clusters by upregulation. (E) Ordered gene expression changes (upregulation and downregulation) for each global, regional and the cell cluster-specific comparison, with transcription factor target gene-sets displayed on the left (red) and pathways (blue) to the left of the heatmap with corresponding enrichment p-value (left panel). The same genes are shown in the right panel for comparable bulk RNA-Seq from the Leucegene AML RNA-Seq cohort with 438 patients and 16 donor CD34+CD45RA- cord-blood samples (row median normalized). Samples indicated as AML Eryth are those with a matching GATA1 transcription factor target enrichment in the left panel heatmap and those denoted as inflammatory correspond to gene clusters with an enrichment in interferon-gamma and TLR gene set enrichments. (F) Disease Ontology gene-set enrichment with the program ToppGene of the two Leucegene patient groups high GATA1 and low inflammatory gene expression versus the converse sample sets. Red bars indicate statistical enrichment of upregulated (GATA1 high) gene sets and blue, downregulation associated genes (inflammatory). (GH) Analogous plots to those shown in panels A and B, respectively, for two scRNA-Seq timepoints of a single-patient's blood at Day 0 and Day 4 of chemotherapy. (I) Cell population percentages for Day 2 and Day 4 cells aligned to Day 0 ICGS-NMF clusters. No cells were aligned for HSC cells at Day 4 and only 11 cells for HSC-Differentiating at Day 4 (too few for differential expression analysis of those clusters). (J) Ordered AML time-course heatmap, in which ordered genes for both Day 2 and Day 4 versus Day 0 were combined. Differentials for Day 2 are shown on the left panel and Day 4 on the right, with red tick marks denoting genes significantly differentially expressed in Day 4 versus Day 0. (K) The cellHarmony gene network for the differentiating HSC cluster at Day 2 versus Day 0.

References

    1. Olsson A., Venkatasubramanian M., Chaudhri V.K., Aronow B.J., Salomonis N., Singh H., Grimes H.L.. Single-cell analysis of mixed-lineage states leading to a binary cell fate choice. Nature. 2016; 537:698–702. - PMC - PubMed
    1. Barkas N., Petukhov V., Nikolaeva D., Lozinsky Y., Demharter S., Khodosevich K., Kharchenko P.V.. Joint analysis of heterogeneous single-cell RNA-seq dataset collections. Nat. Methods. 2019; 16:695–698. - PMC - PubMed
    1. Stuart T., Butler A., Hoffman P., Hafemeister C., Papalexi E., Mauck W.M. 3rd, Hao Y., Stoeckius M., Smibert P., Satija R.. Comprehensive integration of Single-Cell data. Cell. 2019; 177:1888–1902. - PMC - PubMed
    1. de Kanter J.K., Lijnzaad P., Candelli T., Margaritis T., Holstege F.C.P.. CHETAH: a selective, hierarchical cell type identification method for single-cell RNA sequencing. Nucleic Acids Res. 2019; doi:10.1093/nar/gkz543. - PMC - PubMed
    1. Pliner H.A., Shendure J., Trapnell C.. Supervised classification enables rapid annotation of cell atlases. 2019; bioRxiv doi:04 February 2019, preprint: not peer reviewed 10.1101/538652. - DOI - PMC - PubMed

Publication types