. 2019 Sep 2;11(5):344-348.
doi: 10.1093/inthealth/ihz046.

Maintaining progress for the most beautiful chart in the world

Affiliations

Maintaining progress for the most beautiful chart in the world

Simon I Hay. Int Health. .

Abstract

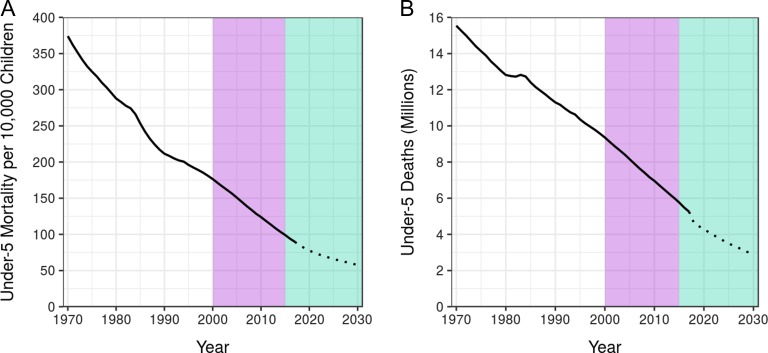
The decline in child mortality over the past two decades has been described as the greatest story in global public health. Indeed, using modern tools and interventions, there has been remarkable progress, reducing deaths in children <5 y of age by nearly half from 2000 to 2017. However, as a consequence of persistent geographic inequalities, we fall short of the United Nations Sustainable Development Goal to end all preventable child deaths by 2030, with an estimated 44.6 million preventable deaths expected to occur by the target year. This article discusses how we might further improve the downward trend in child mortality over the next decade to end preventable child deaths.

Keywords: child mortality; data visualization; global health; public health surveillance.


Figures

Figure 1.
Figure 1.
Trends in under-5 mortality in 103 LMICs, 1970–2030. (A) Under-5 mortality rate per 10 000 children. (B) Total under-5 deaths in millions. The mortality rate was determined by dividing the number of deaths by the population among all children <5 y of age. The purple area identifies the era of the MDGs and the green area represents the time remaining until 2030, the target year of the SDGs. The projected under-5 mortality rate and total deaths are indicated by the dotted portion of each line.
Figure 2.
Figure 2.
National-level estimates of under-5 mortality (U5M) in 103 LMICs in 2017. (A) Total number of deaths in children <5 y of age in 2017. (B) Probability of death for children <5 y of age in 2017.
Figure 3.
Figure 3.
(A) Under-5 mortality rates at the 5×5-km resolution for 2000, 2005, 2010 and 2015. Pixels at the 5×5-km resolution are highlighted according to the under-5 mortality rate, from purple, indicating ≤25 deaths/1000 live births (the SDG 3.2 target), to orange, indicating >200 deaths/1000 live births. Grey indicates pixels with a population of fewer than 10 people. Grey areas with diagonal lines were not included in the analysis. (B) Locations with little to no improvements in the lowest 20% under-5 mortality rates across Africa between 2000 and 2017. The locations of the highest 20% of under-5 mortality rates, or the ‘bottom 20%’, are highlighted, indicating those with the highest likelihood of children dying before the age of 5 y in 2000 (pale pink) and 2017 (deep pink). The burgundy areas represent the aggregated data for 2000 and 2017, indicating where little to no change occurred during that time period. Grey areas with diagonal lines are not included in this analysis.

References

    1. Dicker D, Nguyen G, Abate D, et al. . Global, regional, and national age-sex-specific mortality and life expectancy, 1950–2017: a systematic analysis for the Global Burden of Disease Study 2017. Lancet. 2018;392(10159):1684–735. - PMC - PubMed
    1. Gates Notes 2017. annual letter. https://www.gatesnotes.com/2017-Annual-Letter (accessed 21 March 2019).
    1. Centers for Disease Control and Prevention Ten great public health achievements—worldwide, 2001. –2010. https://www.cdc.gov/mmwr/preview/mmwrhtml/mm6024a4.htm (accessed 29 April 2019).
    1. Golding N, Burstein R, Longbottom J, et al. . Mapping under-5 and neonatal mortality in Africa, 2000–15: a baseline analysis for the Sustainable Development Goals. Lancet. 2017;390(10108):2171–82. - PMC - PubMed
    1. Abajobir AA, Abbafati C, Abbas KM, et al. . Global, regional, and national age-sex specific mortality for 264 causes of death, 1980–2016: a systematic analysis for the Global Burden of Disease Study 2016. Lancet. 2017;390(10100):1151–210. - PMC - PubMed

Publication types