

Impact of an Episode-Based Payment Initiative by Commercial Payers in Arkansas on Procedure Volume: an Observational Study
- PMID: 31529377
- PMCID: PMC7018907
- DOI: 10.1007/s11606-019-05318-7
Impact of an Episode-Based Payment Initiative by Commercial Payers in Arkansas on Procedure Volume: an Observational Study
Abstract
Background: Episode-based payment (EBP) is gaining traction among payers as an alternative to fee-for-service reimbursement. However, there is concern that EBP could influence the number of episodes.
Objective: To examine how procedure volume changed after the introduction of EBP in 2013 and 2014 under the Arkansas Health Care Payment Improvement Initiative.
Design: Using 2011-2016 commercial claims data, we estimate a difference-in-differences model to assess the impact of EBP on the probability of a beneficiary having an episode for four procedures that were reimbursed under EBP in Arkansas: total joint replacement, cholecystectomy, colonoscopy, and tonsillectomy.
Participants: Commercially insured beneficiaries in Arkansas serve as our treatment group, while commercially insured beneficiaries in neighboring states serve as our comparison group.
Interventions: Statewide implementation of EBP for various clinical conditions by two of Arkansas' largest commercial insurers.
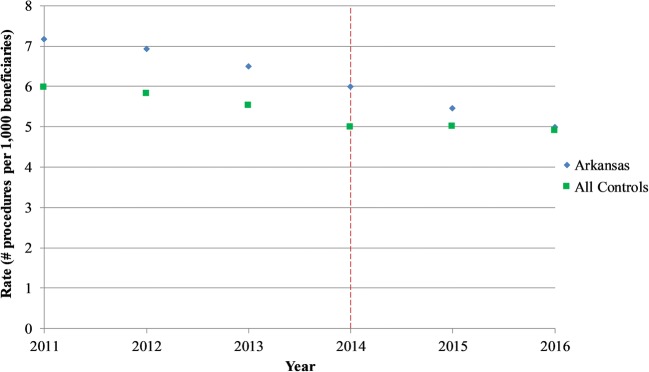
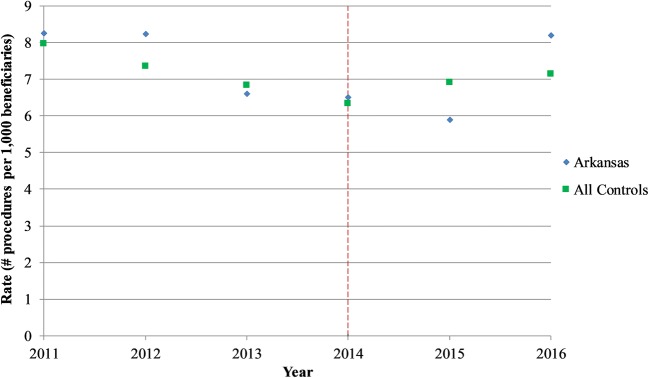
Main measures: For a given procedure type, the primary outcomes are the annual rate of procedures (number of procedures per 1000 beneficiaries) and the probability of a beneficiary undergoing that procedure in a given quarter.
Key results: The relationship between EBP and procedure volume varies across procedures. After EBP was implemented, the probability of undergoing colonoscopy increased by 17.2% (point estimate, 2.63; 95% CI, 1.18 to 4.08; p < 0.001; Arkansas pre-period mean, 15.29). The probability of undergoing total joint replacement increased by 9.9% (point estimate, 0.091; 95% CI, - 0.011 to 0.19; p = 0.08; Arkansas pre-period mean, 0.91), though this effect is not significant. There is no discernable impact on cholecystectomy or tonsillectomy volume.
Conclusions: We do not find clear evidence of deleterious volume expansion. However, because the impact of EBP on procedure volume may vary by procedure, payers planning to implement EBP models should be aware of this possibility.
Keywords: health economics; health insurance; health policy; physician behavior; reimbursement.
Conflict of interest statement
Dr. Chernew reports having equity in Archway Health, V-BID Health, Virta Health, and Paladin Healthcare Capital. He reports having consulted for the American Hospital Association, Anthem Health Insurance, Janssen Pharmaceuticals, Madalena Consulting, Merck & Company, Milliman, Navigant, Pfizer, PhRMA, Precision Health Economics, State of North Carolina, Takeda Pharmaceuticals, University of Michigan, White & Case, Amgen, J&J, Sanofi, University of Maine, McKinsey & Company, and John Freedman Healthcare. He has received research funding from the Laura and John Arnold Foundation, NIH/NIA, NBER/AHRQ, CMS via Abt Associates, MITRE/CMS, Altarum/RWJK, Peterson Center on Health Care, and The Commonwealth Fund. Dr. Fendrick reports having consulted for AbbVie, Amgen, Centivo, Community Oncology Association, Department of Defense, EmblemHealth, Exact Sciences, Freedman Health, Health at Scale Technologies, Health Management Associates, Lilly, MedZed, Penguin Pay, Risalto, Sempre Health, State of Minnesota, Wellth, and Zansors. He has received research funding from AHRQ, Boehringer-Ingelheim, Gary and Mary West Health Policy Center, Laura and John Arnold Foundation, National Pharmaceutical Council, PCORI, PhRMA, RWJ Foundation, and State of Michigan/CMS. All other authors report no relationships or potential conflicts of interest.
Figures


Comment in
-
Capsule Commentary on Chen et al., "Impact of an Episode-Based Payment Initiative by Commercial Payers in Arkansas on Procedure Volume: an Observational Study".J Gen Intern Med. 2020 Feb;35(2):622. doi: 10.1007/s11606-019-05496-4. J Gen Intern Med. 2020. PMID: 31720961 Free PMC article. No abstract available.
Similar articles
-
Capsule Commentary on Chen et al., "Impact of an Episode-Based Payment Initiative by Commercial Payers in Arkansas on Procedure Volume: an Observational Study".J Gen Intern Med. 2020 Feb;35(2):622. doi: 10.1007/s11606-019-05496-4. J Gen Intern Med. 2020. PMID: 31720961 Free PMC article. No abstract available.
-
Effects of episode-based payment on health care spending and utilization: Evidence from perinatal care in Arkansas.J Health Econ. 2018 Sep;61:47-62. doi: 10.1016/j.jhealeco.2018.06.010. Epub 2018 Jul 3. J Health Econ. 2018. PMID: 30059822
-
Early impact of the implementation of Medicaid episode-based payment reforms in Arkansas.Health Serv Res. 2020 Aug;55(4):556-567. doi: 10.1111/1475-6773.13296. Epub 2020 May 21. Health Serv Res. 2020. PMID: 32438480 Free PMC article.
-
Payment methods for healthcare providers working in outpatient healthcare settings.Cochrane Database Syst Rev. 2021 Jan 20;1(1):CD011865. doi: 10.1002/14651858.CD011865.pub2. Cochrane Database Syst Rev. 2021. PMID: 33469932 Free PMC article.
-
Is There An Association Between Bundled Payments and "Cherry Picking" and "Lemon Dropping" in Orthopaedic Surgery? A Systematic Review.Clin Orthop Relat Res. 2021 Nov 1;479(11):2430-2443. doi: 10.1097/CORR.0000000000001792. Clin Orthop Relat Res. 2021. PMID: 33942797 Free PMC article.
Cited by
-
Evaluation of the impact of prospective payment systems on cholecystectomy: A systematic review and meta-analysis.Ann Hepatobiliary Pancreat Surg. 2024 Aug 31;28(3):291-301. doi: 10.14701/ahbps.24-038. Epub 2024 May 7. Ann Hepatobiliary Pancreat Surg. 2024. PMID: 38710538 Free PMC article. Review.
-
Capsule Commentary on Chen et al., "Impact of an Episode-Based Payment Initiative by Commercial Payers in Arkansas on Procedure Volume: an Observational Study".J Gen Intern Med. 2020 Feb;35(2):622. doi: 10.1007/s11606-019-05496-4. J Gen Intern Med. 2020. PMID: 31720961 Free PMC article. No abstract available.
References
-
- Dummit LA, Marrufo G, Marshall J, et al; The Lewin Group. CMS Bundled Payments for Care Improvement Initiative Models 2-4: Year 3 Evaluation & Monitoring Annual Report. 2017. Available at: https://downloads.cms.gov/files/cmmi/bpci-models2-4yr3evalrpt.pdf. Accessed June 28, 2019.
-
- Finkelstein A, Ji Y, Mahoney N, Skinner J. Mandatory Medicare Bundled Payment Program for Lower Extremity Joint Replacement and Discharge to Institutional Postacute Care: Interim Analysis of the First Year of a 5-Year Randomized Trial. JAMA. 2018;320(9):892–900. doi: 10.1001/jama.2018.12346. - DOI - PMC - PubMed
Publication types
MeSH terms
LinkOut - more resources
Full Text Sources
